Publication-ready forest plots for regression model outputs in Python.

Project description


forestplotx
Publication-ready forest plots for regression model outputs in Python.
forestplotx takes DataFrame output from logistic, linear, ordinal, or gamma regression models and produces a combined table + forest plot figure — ready for papers, reports, and presentations.
Features
- Multiple model types — binomial (logistic), linear, gamma, and ordinal (cumulative logit)
- Automatic effect-scale handling — exponentiation, log-scale axes, and reference lines driven by link function
- Flexible column detection — accepts
OR,Ratio,Estimate,beta,Coef, oreffectas input - Dual-outcome layout — side-by-side comparison of up to two outcomes
- Category grouping — optional row grouping with bold category headers
- Deterministic layout presets — fixed internal geometry for 4 core display cases
- Adaptive small-table sizing — compact height heuristic for low row counts
- Static matplotlib output — high-resolution, saveable figures
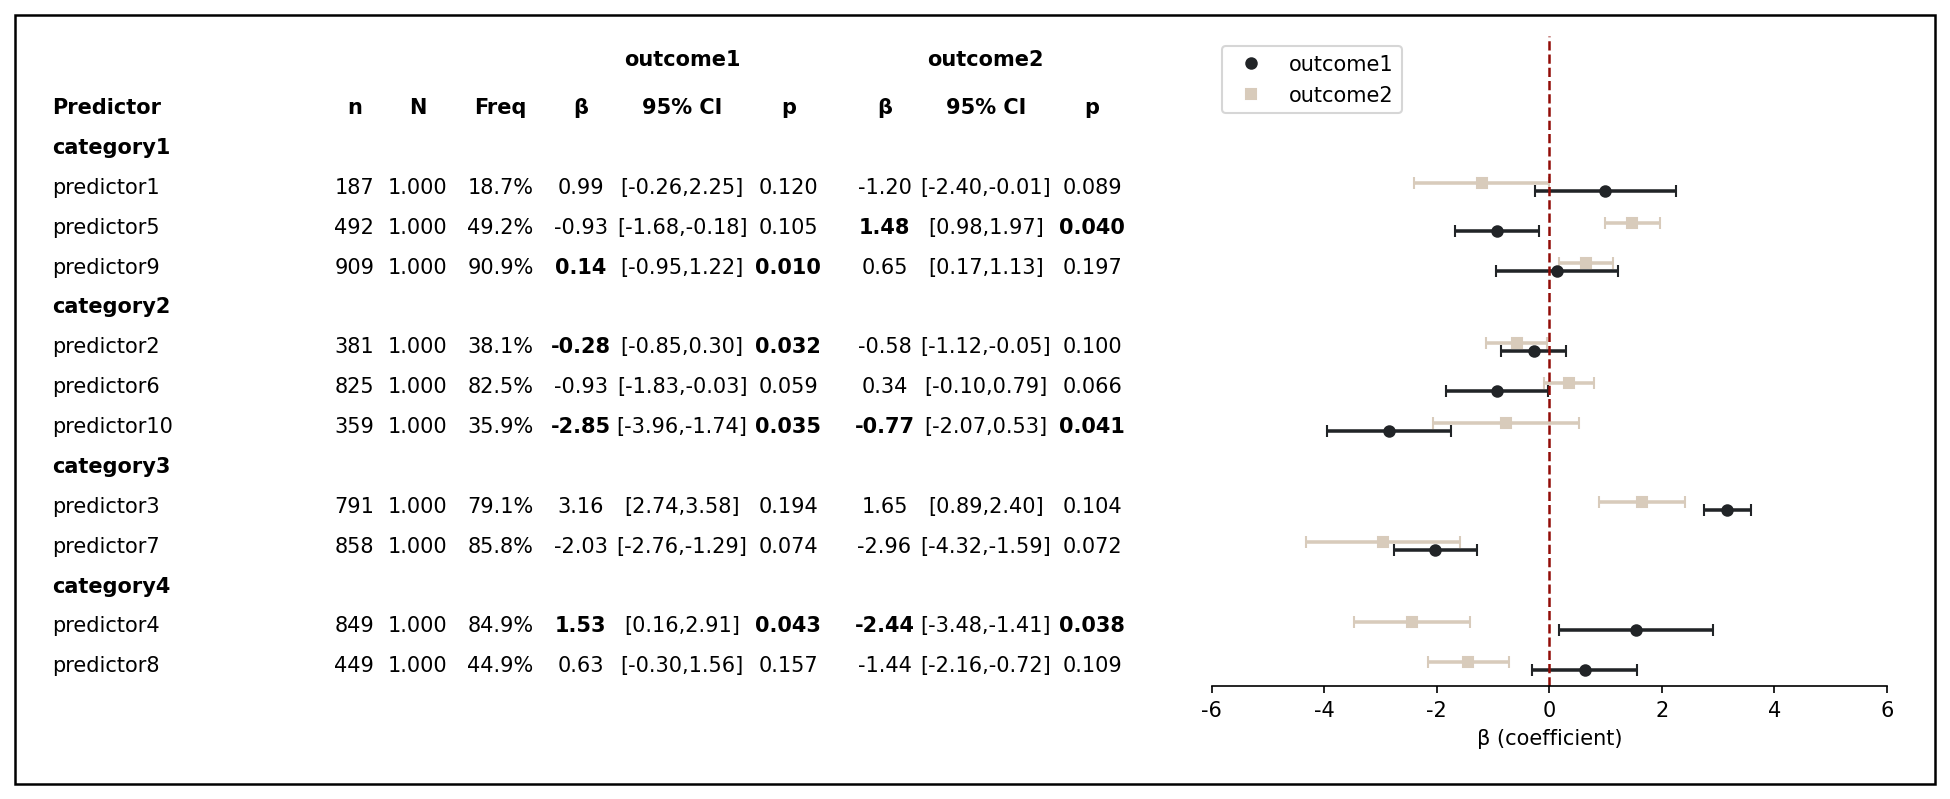
Layout Examples
examples/layout_case1_general_true_two_outcomes.pngexamples/layout_case2_general_true_one_outcome.pngexamples/layout_case3_general_false_two_outcomes.pngexamples/layout_case4_general_false_one_outcome.png
Installation
pip install forestplotx
Requires Python ≥ 3.10. Dependencies: matplotlib>=3.7, numpy>=1.24, pandas>=2.0.
Development install (reproducible environment)
pip install -r requirements.txt   # pin exact versions used during development
pip install -e ".[dev]"           # install forestplotx itself in editable mode
requirements.txt pins the full transitive closure of runtime + test dependencies. pyproject.toml declares the minimum-version constraints used when installing normally.
Quick Start
import pandas as pd
import forestplotx as fpx

# Example: logistic regression output
df = pd.DataFrame({
    "predictor": ["Age", "Sex", "BMI", "Smoking"],
    "outcome":   ["Mortality"] * 4,
    "Estimate":  [-0.12, 0.85, 0.30, 0.55],   # log-odds (pre-exponentiation)
    "CI_low":    [-0.35, 0.42, 0.05, 0.20],
    "CI_high":   [ 0.11, 1.28, 0.55, 0.90],
    "p_value":   [0.300, 0.001, 0.020, 0.003],
})

fig, axes = fpx.forest_plot(df, model_type="binom")
Supported Model Types
forestplotx supports multiple regression model families.
Effect interpretation and axis scaling are determined by the model family and link function.
model_type |
Example models | Link | Effect label (table) | X-axis label | Reference line |
|---|---|---|---|---|---|
"binom" |
Logistic regression (glm, glmer) |
logit | OR | Odds Ratio (log scale) | 1.0 |
"gamma" |
Gamma GLM / GLMM | log | Ratio | Ratio (log scale) | 1.0 |
"linear" |
Linear regression (lm, Gaussian GLM) |
identity | β | β (coefficient) | 0.0 |
"ordinal" |
Ordinal regression (clm, clmm, polr) |
logit | OR | Odds Ratio (log scale) | 1.0 |
The link parameter can override the default — for example, model_type="binom", link="identity" will skip exponentiation and plot on a linear scale.
Interpretation Notes
- Binomial (logit) -> Odds Ratios (OR)
- Gamma (log link) -> Multiplicative mean ratios
- Linear (identity) -> Additive regression coefficients (β)
- Ordinal (logit) -> Cumulative Odds Ratios (OR)
Exponentiation is automatically applied for models using log or logit links.
Input DataFrame
Required columns
| Column | Description |
|---|---|
predictor |
Row labels (predictor names) |
outcome |
Outcome name (used for column headers and filtering) |
| Effect column | One of: OR, Ratio, Estimate, beta, Coef, effect |
CI_low / ci_low |
Lower bound of 95% CI |
CI_high / ci_high |
Upper bound of 95% CI |
Optional columns
| Column | Description |
|---|---|
p_value |
P-value (bold formatting applied when < 0.05) |
category |
Group predictors under category headers |
n |
Event count |
N |
Total count |
Note: For logit/log links, exponentiate=None applies model-based exponentiation with a warning; set exponentiate=False if your data is already on effect scale.
Displayed CI values in the table use bracket notation: [low,high].
API Reference
forest_plot()
fig, axes = fpx.forest_plot(
    df,                              # DataFrame with model output
    outcomes=None,                   # list[str], max 2; auto-detected if None
    save=None,                       # File path to save (e.g. "plot.png")
    model_type="binom",              # "binom" | "gamma" | "linear" | "ordinal"
    link=None,                       # Override default link function
    exponentiate=None,               # None=auto by link, True=force, False=disable
    table_only=False,                # Render table without forest panel
    legend_labels=None,              # list[str] override for legend entries
    point_colors=None,               # list[str], up to 2 hex codes for outcome markers
    footer_text=None,                # Italic footer (wrapped/capped internally)
    tick_style="decimal",            # "decimal" or "power10" (readable log10 exponents)
    clip_outliers=False,             # Clip axis limits by quantiles (opt-in)
    clip_quantiles=(0.02, 0.98),     # Low/high quantiles used when clipping
    base_decimals=2,                 # Decimal places for effect / CI values
    show=True,                       # Call plt.show(); set False for programmatic use
    show_general_stats=True,         # Show n / N / Freq columns
    bold_override=None,              # Manual bold control per predictor/outcome
)
Returns: (fig, axes) — matplotlib Figure and axes tuple. When show=False, the figure is returned without displaying, allowing further customization before calling plt.show() manually.
When exponentiate=None, auto exponentiation for log/logit links emits a warning so users can verify input scale.
Layout Behavior (v1)
forest_plot() uses fixed internal layout presets (including internal font size) for:
show_general_stats=True+ two outcomesshow_general_stats=True+ one outcomeshow_general_stats=False+ two outcomesshow_general_stats=False+ one outcome
This is intentional to keep output stable and publication-ready across common use cases.
base_decimals is capped at 3 internally to prevent table collisions in dense layouts.
For small row counts, figure height uses a tighter internal heuristic to reduce excessive whitespace.
Long footer text is wrapped and capped to 3 lines with ellipsis for overflow protection.
Predictor labels are truncated (with warning) when they exceed layout-specific caps:
show_general_stats=True+ two outcomes: 21 charsshow_general_stats=True+ one outcome: 24 charsshow_general_stats=False+ two outcomes: 26 charsshow_general_stats=False+ one outcome: 25 chars When general stats are shown, largen/Nvalues are compacted (e.g.,78,6k) to preserve column readability. Compaction activates only when counts reach>= 10.000and uses a shared unit across bothnandN(k,M,B,T) for consistent within-row formatting. Very large values beyond display range are capped as>999Twith a warning. Rows are fully grayed only when all displayed outcomes are missing; if at least one outcome is valid, only the missing outcome triplet (effect,95% CI,p) is blanked and gray-marked.
Title Handling
forest_plot() intentionally does not include a title parameter in v1.
This is by design for publication workflows where figure titles/captions are managed in the manuscript rather than embedded inside the plot image.
If needed for slides or reports, add a title externally on the returned matplotlib figure object.
Exponentiation Safety
- Use
exponentiate=None(default) for model/link-based automatic handling. - Use
exponentiate=Falseif your input is already on effect scale (e.g., OR/Ratio, not log-coefficients). - Use
exponentiate=Trueonly when input is definitely on log scale and needs transformation. - Read warnings: they include auto-exponentiation context and column mapping (effect column +
CI_low/CI_highcombined into95% CI).
normalize_model_output()
clean_df, config = fpx.normalize_model_output(
    df, model_type="binom", link=None, exponentiate=None
)
Standardizes columns, applies exponentiation policy, and returns axis metadata.
config includes exponentiated and renamed_columns for transparency.
Examples
Category grouping
df["category"] = ["Demographics", "Demographics", "Clinical", "Clinical"]

fig, axes = fpx.forest_plot(df, model_type="binom")
Dual outcomes
# DataFrame with two outcomes per predictor
fig, axes = fpx.forest_plot(
    df_two_outcomes,
    model_type="binom",
    outcomes=["Mortality", "Readmission"],
    legend_labels=["30-day mortality", "90-day readmission"],
)
Custom marker colors
fig, axes = fpx.forest_plot(
    df_two_outcomes,
    model_type="binom",
    outcomes=["Mortality", "Readmission"],
    point_colors=["#2C5F8A", "#D4763A"],
)
Linear model
fig, axes = fpx.forest_plot(df_linear, model_type="linear")
Save to file
fig, axes = fpx.forest_plot(df, model_type="binom", save="forest_plot.png")
Programmatic use (no display)
fig, axes = fpx.forest_plot(df, model_type="binom", show=False)
# Further customization...
fig.suptitle("My Forest Plot", fontsize=16)
fig.savefig("custom_plot.pdf", dpi=300)
In notebooks, show=False prevents internal plt.show(), but Jupyter may still auto-render
the returned figure object. Use plt.close(fig) to suppress display.
Testing
The test suite lives in tests/ and covers all internal modules with no image comparisons — structural and behavioral assertions only.
Install dev dependencies first (see Installation), then:
pytest
Test files
| File | Module under test | Tests |
|---|---|---|
tests/test_normalization.py |
_normalize.py |
11 |
tests/test_layout.py |
_layout.py |
33 |
tests/test_axes_config.py |
_axes_config.py |
65 |
tests/test_plot_smoke.py |
plot.py |
7 |
Coverage summary
test_layout.py — build_row_layout()
- Flat layout (no
categorycolumn): sequential y-positions, correct row count, allis_cat=False,"Uncategorized"labels, predictor order preserved, required columns present - NaN predictor rows dropped; empty DataFrame raises
ValueError - Categorized layout: category header rows inserted, total = categories + predictors (parametrized), correct
is_catflags and per-predictor category labels, all-NaN category falls back to flat - Dual-outcome DataFrames:
unique()deduplication keeps one row per predictor regardless of outcome count
test_axes_config.py — configure_forest_axis() and helpers
_nice_linear_step: 8 parametrized input→output pairs, zero, negative, tiny positive values_decimals_from_ticks: empty/single-tick → 2, step-inferred decimals (0/1/2),max_decimalscap- Reference line:
axvlineplaced at correct x for logit (1.0), log (1.0), identity (0.0);#910C07color; dashed style; threshold override - X-scale:
"log"for logit/log links,"linear"for identity; empty data andthresholds=Nonedo not crash - X-label: correct label per link (
"Odds Ratio"/"Ratio"/"β (coefficient)"), threshold override, font size propagated - Y-ticks cleared; y-limits applied from
thresholds["y_limits"] - Spine visibility: top/right/left hidden, bottom visible
- X-limits contain full data range for log and linear axes; negative reference raises
ValueError; span=0 edge case handled - End-to-end parametrized across all four model types: binom, gamma, linear, ordinal
show_general_stats=True/Falseboth produce consistent output (documents no-op behaviour on axis)- Tick count heuristic:
num_ticksin {3, 5, 7} for log and linear axes tick_style="power10"uses readable rounded log10 exponents; single vs dual outcomelo_all/hi_allarrays both handled
Scope
forestplotx v1.0 is intentionally focused. It produces static, publication-quality forest plots for common regression model types.
Not included: interactive plots, Cox/Poisson models, theming engine, or GUI.
Versioning
forestplotx follows semantic versioning (SemVer).
MAJOR– breaking API changesMINOR– backward-compatible feature additionsPATCH– bug fixes and internal improvements
Current version: 1.0.2
License
MIT


Download files
Download the file for your platform. If you're not sure which to choose, learn more about installing packages.
Source Distribution
Built Distribution
Filter files by name, interpreter, ABI, and platform.
If you're not sure about the file name format, learn more about wheel file names.
Copy a direct link to the current filters
File details
Details for the file forestplotx-1.0.2.tar.gz.
File metadata
- Download URL: forestplotx-1.0.2.tar.gz
- Upload date:
- Size: 31.7 kB
- Tags: Source
- Uploaded using Trusted Publishing? No
- Uploaded via: twine/6.2.0 CPython/3.12.3
File hashes
| Algorithm | Hash digest | |
|---|---|---|
| SHA256 |
5c6399121c37d59032889b4a3f245b7443c1e159bf4f9b4db1c6c210ef7a1aa5
|
|
| MD5 |
d0cc6e603adc205eb9cd632d95a2c105
|
|
| BLAKE2b-256 |
893b0ff5b2972d094fb300915f9dac77ec47f33d8969b0ba939a9a13050e40da
|
File details
Details for the file forestplotx-1.0.2-py3-none-any.whl.
File metadata
- Download URL: forestplotx-1.0.2-py3-none-any.whl
- Upload date:
- Size: 20.7 kB
- Tags: Python 3
- Uploaded using Trusted Publishing? No
- Uploaded via: twine/6.2.0 CPython/3.12.3
File hashes
| Algorithm | Hash digest | |
|---|---|---|
| SHA256 |
075c0c6f4d1cab4f3637a1a10fd88399a0c80a8786cd86b5f59d2d8f6cb6d8f9
|
|
| MD5 |
f7525bef2bfabb5179314ba375a63f70
|
|
| BLAKE2b-256 |
8d903cc6ec7c39e8967ae83c8143380ce3b8e35dad744465abdd8eb39381094c
|


