Fortune's algorithm for fast Voronoi diagram construction with extras.

Project description
Foronoi
Fortune's algorithm for Voronoi diagrams.


Foronoi is a Python implementation of the Fortune’s algorithm based on the description of “Computational Geometry: Algorithms and Applications” by de Berg et al.
This algorithm is a sweep line algorithm that scans top down over the cell points and traces out the lines via breakpoints in between parabola’s (arcs). When lines converge, a circle event happens which inserts a new vertex.
Documentation can be found here.
Pip Installation
pip install foronoi
Manual Installation
First, clone the repository and then install the package.
git clone https://github.com/Yatoom/voronoi.git
cd foronoi
python setup.py install
Note: you need to use sudo python3 setup.py install on most Linux distributions.
Example usage
Example that uses a polygon as a bounding box.
from foronoi import Voronoi, Polygon, Visualizer, VoronoiObserver

# Define some points (a.k.a sites or cell points)
points = [
    (2.5, 2.5),
    (4, 7.5),
    (7.5, 2.5),
    (6, 7.5),
    (4, 4),
    (3, 3),
    (6, 3),
]

# Define a bounding box / polygon
polygon = Polygon([
    (2.5, 10),
    (5, 10),
    (10, 5),
    (10, 2.5),
    (5, 0),
    (2.5, 0),
    (0, 2.5),
    (0, 5),
])

# Initialize the algorithm
v = Voronoi(polygon)

# Attach a Voronoi Observer that monitors and visualizes the construction of
# the Voronoi Diagram step-by-step. See for more information
# examples/quickstart.py or examples/observers.py.
v.attach_observer(VoronoiObserver())

# Create the diagram
v.create_diagram(points=points)

# Get properties. See more examples in examples/quickstart.py
edges = v.edges
vertices = v.vertices
arcs = v.arcs
points = v.points

# Plotting
# Note: plot_border_to_site() indicates with dashed line to which site a border
# belongs. The site's first edge is colored green.
Visualizer(v, canvas_offset=1)\
    .plot_sites(show_labels=True)\
    .plot_edges(show_labels=False)\
    .plot_vertices()\
    .plot_border_to_site()\
    .show()
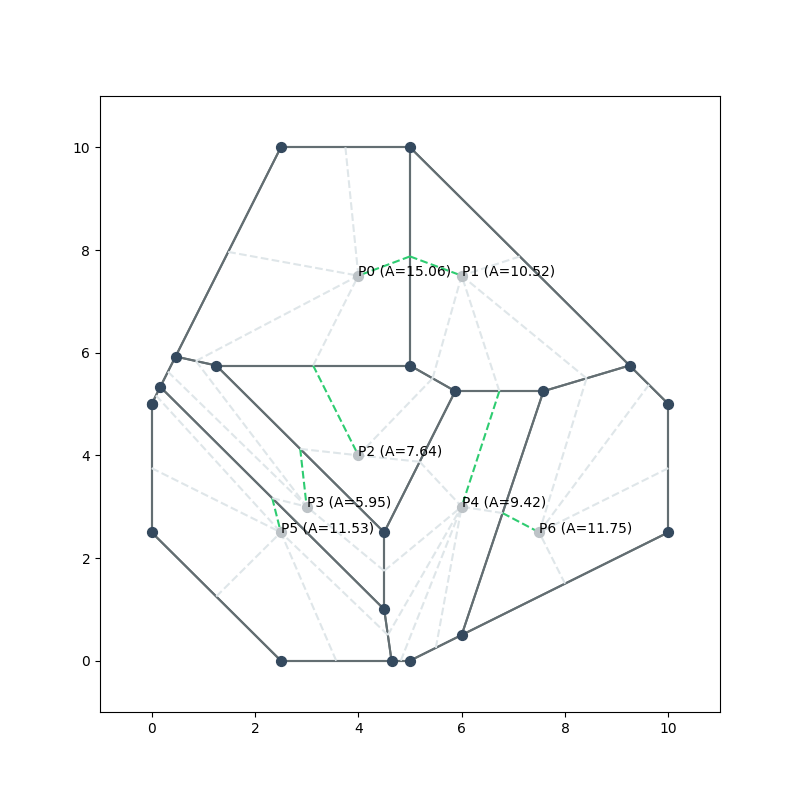
Calculate the shell size for each point
for point in v.sites:
    print(f"{point.xy} \t {point.area()}")
Output:
(2.5, 2.5) 	 11.529761904761905
(4, 7.5) 	 15.064062500000006
(7.5, 2.5) 	 11.75
(6, 7.5) 	 10.520833333333329
(4, 4) 	     7.640625
(3, 3) 	     5.946354166666666
(6, 3) 	     9.423363095238095
More examples can be found in the voronoi/examples folder.
Get coordinates of the cell borders for a point
vertices = v.sites[0].get_vertices()
coords = [(vertex.x, vertex.y) for vertex in vertices]
print(coords)
Output:
[(0.167, 5.333), (4.5, 1.0), (4.643, 0.0), (2.5, 0), (0, 2.5), (0, 5)]
Testing
To run unit tests, run the following comand.
python3 -m "nose" foronoi/tests/unit.py


Download files
Download the file for your platform. If you're not sure which to choose, learn more about installing packages.
Source Distribution
Built Distribution
Filter files by name, interpreter, ABI, and platform.
If you're not sure about the file name format, learn more about wheel file names.
Copy a direct link to the current filters
File details
Details for the file foronoi-1.0.3.tar.gz.
File metadata
- Download URL: foronoi-1.0.3.tar.gz
- Upload date:
- Size: 34.8 kB
- Tags: Source
- Uploaded using Trusted Publishing? No
- Uploaded via: twine/3.4.1 importlib_metadata/3.10.0 pkginfo/1.7.0 requests/2.25.1 requests-toolbelt/0.9.1 tqdm/4.60.0 CPython/3.8.5
File hashes
| Algorithm | Hash digest | |
|---|---|---|
| SHA256 |
c70c2a6689375fd93fadadd2b84eda1f32b320ac9c2fa12b2b557ed301c2d76d
|
|
| MD5 |
d3b054f1ddbd7275cb3ffdc727fbe862
|
|
| BLAKE2b-256 |
18897163de683df0f2905e7c8660594cead449c363b93592a0638411077c6e76
|
File details
Details for the file foronoi-1.0.3-py3-none-any.whl.
File metadata
- Download URL: foronoi-1.0.3-py3-none-any.whl
- Upload date:
- Size: 42.6 kB
- Tags: Python 3
- Uploaded using Trusted Publishing? No
- Uploaded via: twine/3.4.1 importlib_metadata/3.10.0 pkginfo/1.7.0 requests/2.25.1 requests-toolbelt/0.9.1 tqdm/4.60.0 CPython/3.8.5
File hashes
| Algorithm | Hash digest | |
|---|---|---|
| SHA256 |
61abc687faf3d8b81df080d1f8651e269ffc2d1c2788a3f323ffa2b5bb51c8b9
|
|
| MD5 |
6c0ffcff855751b7802d6c2aef0930d3
|
|
| BLAKE2b-256 |
f749d481d1745cdcde9a074483fd1489ed5ce31e3e9b192b7ae91a00a3e4fbd2
|


