A lightweight gradient boosting implementation in Rust.
Project description

Forust
A lightweight gradient boosting package
Forust, is a lightweight package for building gradient boosted decision tree ensembles. All of the algorithm code is written in Rust, with a python wrapper. The rust package can be used directly, however, most examples shown here will be for the python wrapper. For a self contained rust example, see here. It implements the same algorithm as the XGBoost package, and in many cases will give nearly identical results.
I developed this package for a few reasons, mainly to better understand the XGBoost algorithm, additionally to have a fun project to work on in rust, and because I wanted to be able to experiment with adding new features to the algorithm in a smaller simpler codebase.
All of the rust code for the package can be found in the src directory, while all of the python wrapper code is in the py-forust directory.
Installation
The package can be installed directly from pypi.
pip install forust
To use in a rust project add the following to your Cargo.toml file.
forust-ml = "0.2.5"
Usage
The GradientBooster class is currently the only public facing class in the package, and can be used to train gradient boosted decision tree ensembles with multiple objective functions.
It can be initialized with the following arguments.
objective_type(str, optional): The name of objective function used to optimize. Valid options include "LogLoss" to use logistic loss as the objective function (binary classification), or "SquaredLoss" to use Squared Error as the objective function (continuous regression). Defaults to "LogLoss".iterations(int, optional): Total number of trees to train in the ensemble. Defaults to 100.learning_rate(float, optional): Step size to use at each iteration. Each leaf weight is multiplied by this number. The smaller the value, the more conservative the weights will be. Defaults to 0.3.max_depth(int, optional): Maximum depth of an individual tree. Valid values are 0 to infinity. Defaults to 5.max_leaves(int, optional): Maximum number of leaves allowed on a tree. Valid values are 0 to infinity. This is the total number of final nodes. Defaults to sys.maxsize.l2(float, optional): L2 regularization term applied to the weights of the tree. Valid values are 0 to infinity. Defaults to 1.0.gamma(float, optional): The minimum amount of loss required to further split a node. Valid values are 0 to infinity. Defaults to 0.0.min_leaf_weight(float, optional): Minimum sum of the hessian values of the loss function required to be in a node. Defaults to 1.0.base_score(float, optional): The initial prediction value of the model. Defaults to 0.5.nbins(int, optional): Number of bins to calculate to partition the data. Setting this to a smaller number, will result in faster training time, while potentially sacrificing accuracy. If there are more bins, than unique values in a column, all unique values will be used. Defaults to 256.parallel(bool, optional): Should multiple cores be used when training and predicting with this model? Defaults toTrue.allow_missing_splits(bool, optional): Allow for splits to be made such that all missing values go down one branch, and all non-missing values go down the other, if this results in the greatest reduction of loss. If this is false, splits will only be made on non missing values. Ifcreate_missing_branchis set toTruehaving this parameter be set toTruewill result in the missing branch further split, if this parameter isFalsethen in that case the missing branch will always be a terminal node. Defaults toTrue.monotone_constraints(dict[Any, int], optional): Constraints that are used to enforce a specific relationship between the training features and the target variable. A dictionary should be provided where the keys are the feature index value if the model will be fit on a numpy array, or a feature name if it will be fit on a pandas Dataframe. The values of the dictionary should be an integer value of -1, 1, or 0 to specify the relationship that should be estimated between the respective feature and the target variable. Use a value of -1 to enforce a negative relationship, 1 a positive relationship, and 0 will enforce no specific relationship at all. Features not included in the mapping will not have any constraint applied. IfNoneis passed no constraints will be enforced on any variable. Defaults toNone.subsample(float, optional): Percent of records to randomly sample at each iteration when training a tree. Defaults to 1.0, meaning all data is used for training.seed(integer, optional): Integer value used to seed any randomness used in the algorithm. Defaults to 0.missing(float, optional): Value to consider missing, when training and predicting with the booster. Defaults tonp.nan.create_missing_branch(bool, optional): An experimental parameter, that ifTrue, will create a separate branch for missing, creating a ternary tree, the missing node will be given the same weight value as the parent node. If this parameter isFalse, missing will be sent down either the left or right branch, creating a binary tree. Defaults toFalse.
Training and Predicting
Once, the booster has been initialized, it can be fit on a provided dataset, and performance field. After fitting, the model can be used to predict on a dataset. In the case of this example, the predictions are the log odds of a given record being 1.
# Small example dataset
from seaborn import load_dataset

df = load_dataset("titanic")
X = df.select_dtypes("number").drop(columns=["survived"])
y = df["survived"]

# Initialize a booster with defaults.
from forust import GradientBooster
model = GradientBooster(objective_type="LogLoss")
model.fit(X, y)

# Predict on data
model.predict(X.head())
# array([-1.94919663,  2.25863229,  0.32963671,  2.48732194, -3.00371813])

# predict contributions
model.predict_contributions(X.head())
# array([[-0.63014213,  0.33880048, -0.16520798, -0.07798772, -0.85083578,
#        -1.07720813],
#       [ 1.05406709,  0.08825999,  0.21662544, -0.12083538,  0.35209258,
#        -1.07720813],
The fit method accepts the following arguments.
X(FrameLike): Either a pandas DataFrame, or a 2 dimensional numpy array, with numeric data.y(ArrayLike): Either a pandas Series, or a 1 dimensional numpy array. If "LogLoss" was the objective type specified, then this should only contain 1 or 0 values, where 1 is the positive class being predicted. If "SquaredLoss" is the objective type, then any continuous variable can be provided.sample_weight(Optional[ArrayLike], optional): Instance weights to use when training the model. If None is passed, a weight of 1 will be used for every record. Defaults to None.
The predict method accepts the following arguments.
X(FrameLike): Either a pandas DataFrame, or a 2 dimensional numpy array, with numeric data.parallel(Optional[bool], optional): Optionally specify if the predict function should run in parallel on multiple threads. IfNoneis passed, theparallelattribute of the booster will be used. Defaults toNone.
The predict_contributions method will predict with the fitted booster on new data, returning the feature contribution matrix. The last column is the bias term.
X(FrameLike): Either a pandas DataFrame, or a 2 dimensional numpy array, with numeric data.method(str, optional): Method to calculate the contributions, if "average" is specified, the average internal node values are calculated, this is equivalent to theapprox_contribsparameter in XGBoost. The other supported method is "weight", this will use the internal leaf weights, to calculate the contributions. This is the same as what is described by Saabas here.parallel(Optional[bool], optional): Optionally specify if the predict function should run in parallel on multiple threads. IfNoneis passed, theparallelattribute of the booster will be used. Defaults toNone.
Inspecting the Model
Once the booster has been fit, each individual tree structure can be retrieved in text form, using the text_dump method. This method returns a list, the same length as the number of trees in the model.
model.text_dump()[0]
# 0:[0 < 3] yes=1,no=2,missing=2,gain=91.50833,cover=209.388307
#       1:[4 < 13.7917] yes=3,no=4,missing=4,gain=28.185467,cover=94.00148
#             3:[1 < 18] yes=7,no=8,missing=8,gain=1.4576768,cover=22.090348
#                   7:[1 < 17] yes=15,no=16,missing=16,gain=0.691266,cover=0.705011
#                         15:leaf=-0.15120,cover=0.23500
#                         16:leaf=0.154097,cover=0.470007
The json_dump method performs the same action, but returns the model as a json representation rather than a text string.
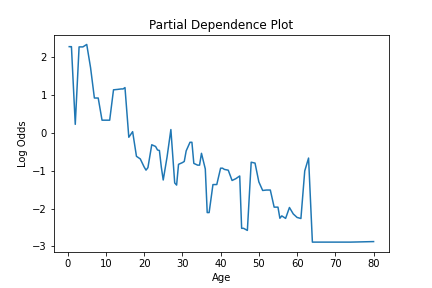
To see an estimate for how a given feature is used in the model, the partial_dependence method is provided. This method calculates the partial dependence values of a feature. For each unique value of the feature, this gives the estimate of the predicted value for that feature, with the effects of all features averaged out. This information gives an estimate of how a given feature impacts the model.
The partial_dependence method takes the following parameters...
X(FrameLike): Either a pandas DataFrame, or a 2 dimensional numpy array. This should be the same data passed into the models fit, or predict, with the columns in the same order.feature(Union[str, int]): The feature for which to calculate the partial dependence values. This can be the name of a column, if the provided X is a pandas DataFrame, or the index of the feature.
This method returns a 2 dimensional numpy array, where the first column is the sorted unique values of the feature, and then the second column is the partial dependence values for each feature value.
This information can be plotted to visualize how a feature is used in the model, like so.
from seaborn import lineplot
import matplotlib.pyplot as plt

pd_values = model.partial_dependence(X=X, feature="age")

fig = lineplot(x=pd_values[:,0], y=pd_values[:,1],)
plt.title("Partial Dependence Plot")
plt.xlabel("Age")
plt.ylabel("Log Odds")

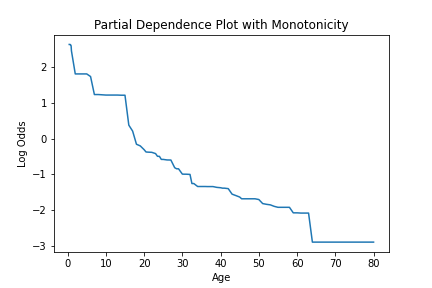
We can see how this is impacted if a model is created, where a specific constraint is applied to the feature using the monotone_constraint parameter.
model = GradientBooster(
    objective_type="LogLoss",
    monotone_constraints={"age": -1},
)
model.fit(X, y)

pd_values = model.partial_dependence(X=X, feature="age")
fig = lineplot(
    x=pd_values[:, 0],
    y=pd_values[:, 1],
)
plt.title("Partial Dependence Plot with Monotonicity")
plt.xlabel("Age")
plt.ylabel("Log Odds")

Saving the model
To save and subsequently load a trained booster, the save_booster and load_booster methods can be used. Each accepts a path, which is used to write the model to. The model is saved and loaded as a json object.
trained_model.save_booster("model_path.json")

# To load a model from a json path.
loaded_model = GradientBooster.load_model("model_path.json")
Project details
Release history Release notifications | RSS feed
Download files
Download the file for your platform. If you're not sure which to choose, learn more about installing packages.
Source Distribution
Built Distributions
Hashes for forust-0.2.5-cp311-none-win_amd64.whl
| Algorithm | Hash digest | |
|---|---|---|
| SHA256 | 5cc3271a4e575cfcde424d5c35d7bfb2b8b7667b233c5eee3fd3c73e020f4c5a |
|
| MD5 | 31c5bb3776222be9c139045dce01f0ef |
|
| BLAKE2b-256 | c96ce428d6e3f1ba2b8074d02ab968694249934f0e14554a0e7ae0b68f1eaca9 |
Hashes for forust-0.2.5-cp311-cp311-manylinux_2_17_x86_64.manylinux2014_x86_64.whl
| Algorithm | Hash digest | |
|---|---|---|
| SHA256 | b16fa79e3a8bf7c533de1cdb5ae2dad4692107ab72d02776e2e168d8f3147070 |
|
| MD5 | 0513759ffb05f16e22f58117f90479b9 |
|
| BLAKE2b-256 | 4cc276687bd94ed66ae3d04617d2139941959dd7538e96379ed4c7be4dcb5038 |
Hashes for forust-0.2.5-cp311-cp311-macosx_10_7_x86_64.whl
| Algorithm | Hash digest | |
|---|---|---|
| SHA256 | 932034539ab299465b46d8c03654b2b8955c244eb121e655cee3eb42918189b3 |
|
| MD5 | 28ef947db27c027cc95b9db00d5eb89b |
|
| BLAKE2b-256 | a530f6a33b41429795344ec2e8c88eeaaece86bd8fc704b67da722825bf2dbbe |
Hashes for forust-0.2.5-cp310-none-win_amd64.whl
| Algorithm | Hash digest | |
|---|---|---|
| SHA256 | 38152d3c6cea70f0a034021dbf1730744a36fc144b2078b30aa7776ecf956b58 |
|
| MD5 | 6bf1d7f41104c6e38367aa590d9f90e7 |
|
| BLAKE2b-256 | bcbb278a0016e6a9ff8cab91e46e39d7a189d2325735c76bcf46e43b6df88889 |
Hashes for forust-0.2.5-cp310-cp310-manylinux_2_17_x86_64.manylinux2014_x86_64.whl
| Algorithm | Hash digest | |
|---|---|---|
| SHA256 | c57c4b74b349379c7b8ef1a4295269639dd003af7cde7e1dd297a00c3cbea7c6 |
|
| MD5 | 164e9e18ec9a94ae7a1a3fccf928078e |
|
| BLAKE2b-256 | 9fcd343e8a5daa672910870d9765325008d6e283b3b311dadd58b961bd08a86d |
Hashes for forust-0.2.5-cp310-cp310-macosx_10_7_x86_64.whl
| Algorithm | Hash digest | |
|---|---|---|
| SHA256 | abdec4b189d7b248aeab51afcd0ad29de58df22e69e69e70822d201da9cbf963 |
|
| MD5 | 342bb83b097fd0e6706671ef00626c20 |
|
| BLAKE2b-256 | 885383d8010b7f2cdb449e910f907b616aaeb98ce0d4a3a5e2e1e6c8aeda4385 |
Hashes for forust-0.2.5-cp39-none-win_amd64.whl
| Algorithm | Hash digest | |
|---|---|---|
| SHA256 | a555782f90f36f9b661156ce7de1c9ebabfc0bb7d85592e44515505c3831ad15 |
|
| MD5 | 333d013a5118bd467d20462408f1b84e |
|
| BLAKE2b-256 | 28a584780c1c568be96278be97d79f2628beb40094d48c1574a3e9ea5934325d |
Hashes for forust-0.2.5-cp39-cp39-manylinux_2_17_x86_64.manylinux2014_x86_64.whl
| Algorithm | Hash digest | |
|---|---|---|
| SHA256 | e9556c15fc8c687ec19a33deeb58b87d3d0e393a6dc076f543a3485869edd409 |
|
| MD5 | a49769db51c015a7d88dbcf2fd1d9266 |
|
| BLAKE2b-256 | dad0124239fb91a9a49f189fa5e9ef0073d44d7d8891414d6b1f276438fe00cc |
Hashes for forust-0.2.5-cp39-cp39-macosx_10_7_x86_64.whl
| Algorithm | Hash digest | |
|---|---|---|
| SHA256 | 20fcf5683ea20033e1af75d49d1eacbc4be2a961f5ba4942ccff4654ef4b2738 |
|
| MD5 | f3186a533374fcee57eeb017a7149f0f |
|
| BLAKE2b-256 | b19cc94fed545f40dd48798c0e741931cda32ebeb6e2b6de18f95e71c21230e6 |
Hashes for forust-0.2.5-cp38-none-win_amd64.whl
| Algorithm | Hash digest | |
|---|---|---|
| SHA256 | b4d5a0a8b55ba9c12d5decb06711f056dbdbb5428c43d08899967a1d735ec5a9 |
|
| MD5 | e42c481d09dd58821f6f8bb88433270d |
|
| BLAKE2b-256 | 9cd8ff75577e3d69f1c7c2d8305eddf461bb2ffce8da10e8a5c43c05d0b3c6c7 |
Hashes for forust-0.2.5-cp38-cp38-manylinux_2_17_x86_64.manylinux2014_x86_64.whl
| Algorithm | Hash digest | |
|---|---|---|
| SHA256 | e6a869540bb6b299d5c8ab7a65dfb11307f9896224f7c05d815a625890461352 |
|
| MD5 | 8f05034bfcf35ce84e8031c2bd22c7ad |
|
| BLAKE2b-256 | 787ea079fb7b6f9c704ac5f2c589e1f0c68510b10552ebff676834fb8f85eacd |
Hashes for forust-0.2.5-cp38-cp38-macosx_10_7_x86_64.whl
| Algorithm | Hash digest | |
|---|---|---|
| SHA256 | 68ed080b19a900d10e92ee29b11e971d6cfa776e560ccf022b6af30a86f8b462 |
|
| MD5 | 10d9c7afb1571f17e46e626b4748e4b8 |
|
| BLAKE2b-256 | 4064dfa637e372f42c9c6636797dd9d7bd015dd1aa89f42ec25d79153a152607 |


