A tool for visualizing fosmid DNA sequences.

Project description
Author: Tylo Roberts
Contact: tylojroberts@gmail.com
FosVis Overview
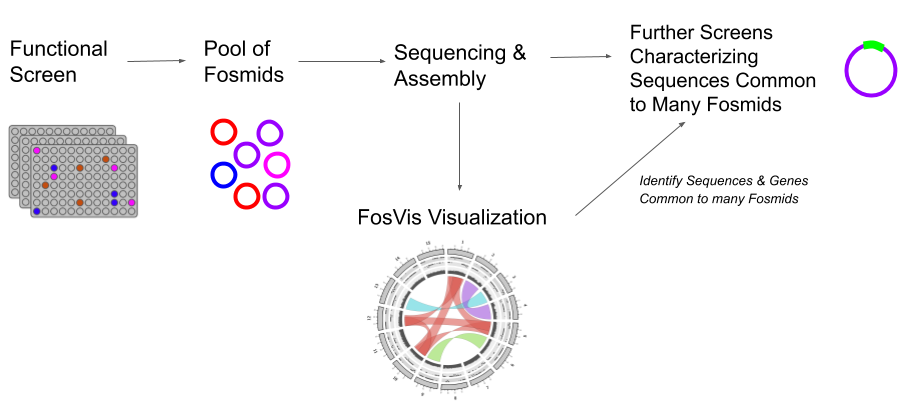
A pip-installable python package designed for visualization of fosmids from functional screens. The inputs are contigs from an assembly (representing fosmids) and the output is a circos diagram.
A circos diagram allows relationships between genomic data to be easily visualized, as well as providing a way to include many different types of data in one diagram through different layers within the circle.
The user selects what types of data they would like to include in the layers of the diagram and FosVis generates that data and creates a final output image. Users can select from the following types of data:
- Custom Data
- Open Reading Frames (ORFs)
- GC Content
- Protein Domains
- Protein or Sequence Homology
FosVis is also set up to allow manual modifications to the final image through adjustments of the data or circos software configuration files. This way, all of the features of the circos software (http://circos.ca/) can be fully exploited.
The package can be used for many applications but is designed for the following fosmid functional screening workflow:
Requirements
-
Python3 (must be run with python3)
-
Pip-installable packages: BioPython, Pandas, Numpy, Matplotlib, seaborn, tqdm
-
External Software (all need to be appended to PATH - newer versions will also likely work)
- circos (v0.69-8)
- prodigal (v2.6.3)
- blastn (v2.9.0)
- bl2seq (includes tblastx)
- hmmscan (HMMER 3.3)
-
To install circos using conda:
conda install circos- You will need to have already set up the bioconda channel:
conda config --add channels bioconda - See more at https://bioconda.github.io/recipes/circos/README.html
- You will need to have already set up the bioconda channel:
Getting Started
The package has two main methods that control the functionality. To create the data for the image run create_circos_data(). Then run make_diagram() using the created data to output the circos diagram.
The diagram is set up with the following structure of layers from the outside to the center of the circle respectively:
- Karyotype (shows length of fosmids - includes protein domain data if selected in the parameters)
- ORFs
- GC Content
- Custom Histogram (see custom histogram section)
- Homology Links
Using the parameters described in the Parameters section you can control which of layers 2-4 to include as you see fit as well as many parameters involved in the creation of the data for all layers.
The following provides the most basic use of the package, more detailed use can be seen in the Parameters section:
- Ensure all requirements are met
pip install fosvis- Run the following example script with
python3
from fosvis import fosvis

# fasta contigs file (all contigs in one file)
contigs = '<path_to_contigs_fasta_file>'

# File path to a directory where the project folder will be created
output_dir = '<path_to_an_output_directory>'

# A Project Name (no spaces - output directory will be created with this name)
proj_name = 'test_project'

print("Running...")
fosvis.create_circos_data(contigs, output_dir, proj_name)
fosvis.make_diagram(output_dir + "/" + proj_name + "/circos_diagram_input_data")
print("Finished Running...")
Within the specified output directory, there will be a folder created with the same name as the proj_name. Within this directory, the visualization will be in a file called circos_diagram.png
If you wanted to make a manual modification (see 'Manual Image Modifications' section), simply make the modification, comment out the fosvis.create_circos_data(...) line and re-run the scripts to have your modifications take effect.
Parameters
create_circos_data()
def create_circos_data(contigs, output_dir, project_title, orfs=True, gc=True, custom_histogram=False,
custom_histogram_file='', hmm_db='', e_value=0.01, min_contig_length=10000, min_blast_similarity_percentage=90,
min_blast_similarity_length=300, link_transperacny='0.60', percent_link_overlap_tolerance=50,
include_domains=False, gc_interval_len=400, blast_type='blastn', keep_blast_data=False)
Required Parameters
contigs(str): File path to a FASTA file containing contigsoutput_dir(str): File path to a directory where the project folder will be createdproject_title(str): Name of the project directory that is created in theouput_dir(and used for some file prefixes), don't use any spaces
Quality Control Parameters
min_contig_length(int): The minimum size of a contig to be used in the diagram (idea is that each contig should represent one fosmid) (default=10000)
Open Reading Frame (ORF) Layer Parameters
orfs(bool): If True will include orfs layers, if False don't (default=True)
GC Content Layer Parameters
gc(bool): If True include GC layer, if False don't (default=True)gc_interval_len(int): The interval over which gc content is calculated for the histogram (default=400)
Custom Histogram Layer Parameters
custom_histogram(bool): If True, include custom histogram layer, if False don't (default=False)- If set to True, you must include data for the histogram in the
custom_histogram_fileparameter
- If set to True, you must include data for the histogram in the
custom_histogram_file(str): File path to a custom histogram data txt file (see 'Adding a Custom Histogram' section) (default='')
Protein Domain Parameters
hmm_db(str): File path to a pressed hmm database (default='')e_value(int): The e-value used for the hmmscan search (default=0.01)include_domains(boolean): If True will create protein domain band data, if False will not (default=False)- If set to True, you must also set the
hmmdbparameter to a valid hmm database
- If set to True, you must also set the
Links Parameters
min_blast_similarity_percentage(int): Min nucleotide percent similarity (blast percent identity) for link data (default=90)min_blast_similarity_length(int): Min nucleotide similarity length (blast align length) for link data (default=300)link_transperacny(str): The transparency of the links in the diagram in range 0 - 1 (0 is transparent) (default='0.60')percent_link_overlap_tolerance(int): The amount of overlap percentage required to classify two links as similar enough to color them with the same color (default=50)blast_type(str): The type of blast to use to create the links (can be 'blastn' OR 'tblastx') (default='blastn')keep_blast_data(bool): If True will keep the raw blast data, won't if False (default=False)
make_diagram()
make_diagram(data_dir, ncol=2)
Required Parameters
data_dir(str): File path to a directory containing the files created bycreate_circos_data()- i.e. The path to the
circos_diagram_input_datadirectory created within the directory created bycreate_circos_data()
- i.e. The path to the
Parameters with Default Values
ncol(int): Number of columns in the protein domain legend if applicable (default=2)
Adding a Custom Histogram
If you want to add a layer with custom data you can do that by setting the custom_histogram parameter to True. You will also need to provide a txt data file through the custom_histogram_file parameter
The histogram data is represented in a txt file with every line representing a bar in a histogram for a specific fosmid for a specific range of base pairs on the fosmid. It should be in the following format:
<fasta_header> <start> <end> <value> [options]
- Fast headers are the fast headers used in the provided contigs files. They are used to identify which fosmid the histogram data is for
- Can leave the '[options]' empty - see the circos website if you want to use any of these options
For example, if my diagram consisted of 2 fosmids named fosmid1 and fosmid2, both of length 10 base pairs (for example), then I could provide the following data in the txt file for a custom histogram:
fosmid1 1 3 25
fosmid1 3 9 50
fosmid1 9 10 75
fosmid2 1 3 25
fosmid2 3 5 50
fosmid2 5 10 75
Notes
- The interval lengths don't have to be the same
- If a section of the fosmid is not covered by the start/end ranges given or if no data is given for a specific fosmid it is assumed to be 0
- The scale of the histogram is from 0 (no bar) to 100 (full bar) so normalize your data to this or see modification 9 in the 'Manual Image Modifications' section
Output Visualization
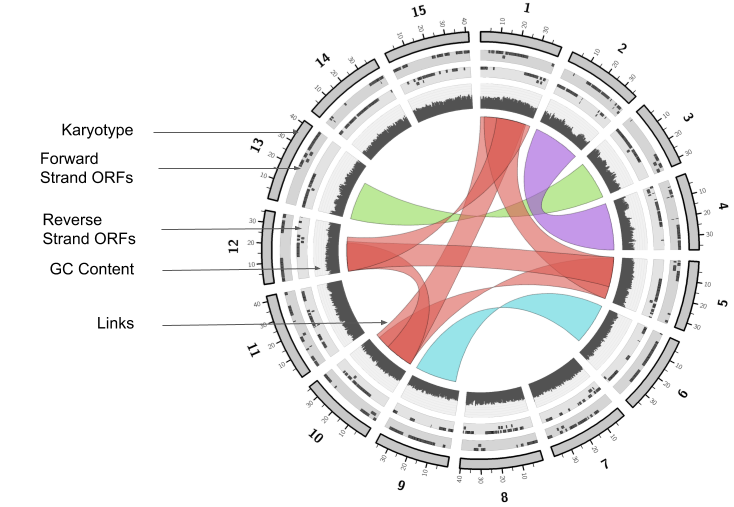
The circos diagram output image has the following main features (depending on the parameters used):
- Karyotype layer: Represents length/position of fosmid sequences (scale bars show fosmid size in kb)
- Colored Bands on the karyotype layer represent protein domains with each unique domain having an associated color (shown in a separate legend) (will only be shown if
inlcude_domains=True)
- Colored Bands on the karyotype layer represent protein domains with each unique domain having an associated color (shown in a separate legend) (will only be shown if
- ORF Layers: Represent positions of open reading frames (outer layer shows forward strand, inner layer shows reverse strand)
- GC Content Layer: GC content (only included if
gc=True) - Links: The ribbons (links) represent nucleotide/protein homology using blastn or tblastx between fosmids
- Links representing the same (or part of the same) sequence are grouped by color
- Custom Histogram Layer (not shown): The innermost layer representing the custom data provided in the same format as the GC data
Output Files
The script outputs the following directories and files after running create_circos_data() and make_diagram(). Some files may be missing if that type of data was not specified to be used in the diagram.
Main Project Directory
circos_diagram.svg- Circos diagram output (svg format)circos_diagram.png- Circos diagram output (png format)protein_domain_legend.png- Legend showing protein domain colors shown on the circos diagram (not made unlessinclude_domains=True)karyotype_legend.png- Legend for fosmid names represented as 1,2,3 etc. on the diagram
intermediate_ouputs/prodigal Directory
prodigal_prtn_seq_output.faa- Protein sequences of prodigal open reading frames identified in the fosmidsprodigal_orf_output- Prodigal open reading frame position data
intermediate_ouputs/hmmscan Directory
<project_title>_tblout.txt- hmmscan tbl format output file<project_title>_out.txt- hmmscan full format output file<project_title>_domtblout.txt- hmmscan domtbl format output file
intermediate_ouputs/correct_length_contigs Directory
<contig_name>.fasta- An individual fasta file for each contig in the input contigs file that is >= to the minimum contig size providedall_correct_size_contigs.fasta- All correct sized contigs in one fasta file
intermediate_ouputs/blastn Directory
- Contains blastn outputs if
keep_blast_data=False
circos_diagram_input_data Directory
ORF.txt- Circos open reading frame (forward strand) input dataORF_reverse.txt- Circos open reading frame (reverse strand) input datalinks.txt- Circos sequence similarity link datakaryotype.txt- Circos outer layer input datacircos.conf- Configuration file for circos softwaregc_content.txt- circos GC content histogram data
Manual Image Modifications
Manual modifications can be done to customize some aspects of the output image.
How to Make Modifications
Each modification involves making an edit to one of the circos input files and rerunning make_diagram():
- Open one of the circos input txt files with a text editor
- Make the modification (details of common modifications described below)
- Save the changes to the same file
- Run the
make_diagram()function with thecircos_diagram_input_datadirectory (containing the modified file) - don't runcreate_circos_data()again or it will erase your changes - The
circos_diagram.pngfile and legends will be overwritten with the changes made to the input files
Details on Common Modifications (What to do in step 2 above)
-
Removing irrelevant protein domain annotations
- Initially, the protein domain legend/diagram is likely filled with irrelevant protein domains that need to be removed
- In the karyotype.txt file the protein domain bands are represented by lines that start with ‘band’
- In karyotype.txt the second column (of lines that start with band) is the fosmid the band is on, the third is a brief name of the domain and the fourth column is a more verbose name of the protein domain (Note: spaces from database name are replaced with underscores)
- For any protein domain that is irrelevant to your diagram, delete the line and when make_diagram() is run again the circos diagram and legend will reflect the changes
-
Removal of links and ORFs
- Open the
links.txtorORF.txtfile - Delete the row containing the link or ORF that you want to remove
- Open the
-
Changing colors of links
- In the links.txt file the color of each link is denoted in the final column after the ‘color=’ tag and is surrounded in brackets
- Color is denoted in the format
(r,g,b,luminosity)
- Color is denoted in the format
- Modify the rgb/luminosity values for each link that you would like to change the color of
- Keep in mind that some links are already grouped so be sure to change all the colors in the group to maintain those groups
- If you search the file for the color that is currently entered it will show you all the occurrences of that color and hence all the links that are grouped with that link
- In the links.txt file the color of each link is denoted in the final column after the ‘color=’ tag and is surrounded in brackets
-
Changing colors of protein domains
- Lines that start with 'band' represent protein domains
- Do the same process as changing the colors of links except the format for the color of a band is ‘rgb(r,g,b)’ and have no luminosity value
- Similar to links, recurrent domains already have the same color so if you change one change all to that color otherwise the legend won’t be accurate
-
Changing Fosmid Labels from 1,2,3 etc.
- Open the
karyotype.txtfile and the chromosomes are represented by lines starting with ‘chr’ - The label for the fosmid shown on the diagram is in the fourth column (including the ‘-’ as a column)
- Change that value to the desired label and re-run make_diagram()
- Open the
-
Changing color of karyotype bars from grey
- If you are not displaying protein domains, the karyotype bars will be grey by default. These bars can can be set to any color to represent things such as fosmid environment, library etc.
- Open the
karyotype.txtfile- It has an entry for each fosmid e.g.
chr - fosmids_7233 1 1 43702 rgb(120,120,120,0.4)
- It has an entry for each fosmid e.g.
- Simply replace the rgb(...) part with an appropriate rgb color in the form rgb(r,g,b,l) where l is luminosity (basically transparency)
-
Changing color of custom histogram, gc histogram or ORF bars
- Open the
circos.conffile - Scroll to bottom 'Defining custom colors' section
- Change any of the color labels with a color being represented in the format
r,g,b,luminosity- e.g. If I wanted to change the color of the gc histogram to green I would replace the current line
gc_histogram_color = vdgreyto the new linegc_histogram_color = 0,250,0,1
- e.g. If I wanted to change the color of the gc histogram to green I would replace the current line
- Open the
-
Changing Diagram Layout/Features
- To change the fundamental layout of the image (layer size/positions, adding additional layers) you need to edit the
circos.conffile - See the circos documentation for more information: http://circos.ca/documentation/
- To change the fundamental layout of the image (layer size/positions, adding additional layers) you need to edit the
-
Changing custom histogram scale
- Open
circos.conf - Go to the 'Custom Histogram Layer' section
- Insert your histogram min/max range into the
minandmaxvariables
- Open
A large number of other features, layers and attributes can be added by modifying the circos.conf file to make full use of the circos software, see the circos website for more information.
Implementation Details
The script uses a variety of tools to create the various data inputs that the circos software can use to create an image. The main tools are shown in the diagram below and some additional details are provided about notable configurations of those tools.
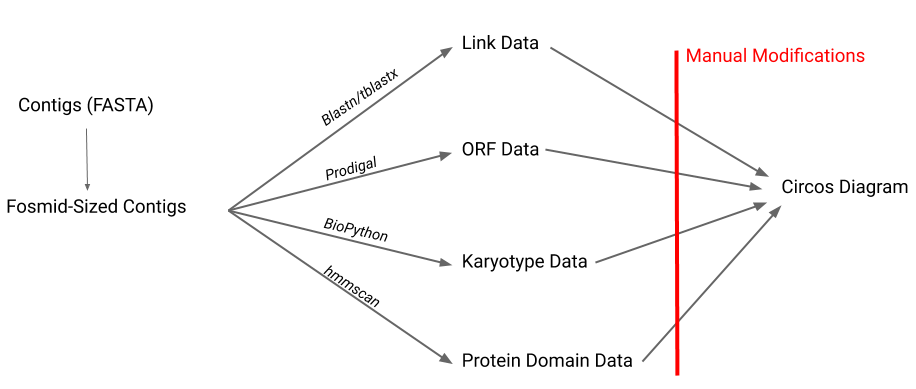
Links
- Every combination of pairs of fosmids are blasted against each other (using blastn or tblastx)
- The outputs are parsed and blast alignments are only kept if the sequences have a percent similarity >= the parameter
min_blast_similarity_percentageand a length >= the parametermin_blast_similarity_lengthgiven increate_circos_data() - An algorithm is then run that looks for sets of links that are potentially representing the same (or some of the same) sequences and groups them by assigning them all with the same color
prodigal
- Some prodigal settings worth noting are:
- The -c flag was not used so genes were allowed to run off the edge of the fosmid
- Prodigal also uses GTG as a start codon
Small Details Worth Noting
- For the ORF layer, if more than 3 ORFs overlap, then any more past the first 3 are not shown in the image
- Whether the link pinches in the middle or not is as a result of link position data having the orign_start > or < the origin_end and the terminus_start > or < the terminus_end
- The chromosome name used will be the sequence ID from the fasta file up to (not including) the first space if there is a space in the fasta sequence ID. Thus, make sure for every sequence every header is unique up to the first space or ideally have no spaces in the fasts headers.
- Circos indexing:
- The circos software takes each bp position to be a range
- If your karyotype starts at 1 (as in fosvis) the first position would be the range from 1 - 2, the 2nd would be the range from 2 - 3
Troubleshooting
-
If everything works except no png is actually created for the diagram it is likely an error that occurred with circos as a result of something to do with the data. If this were to occur, look in the
circos_stdout_and_stderr_log.txtto get a description of the error.- e.g. The circos histogram maxes out at 25000 data points, thus setting the
gc_interval_lentoo low with a large amount of fosmids would result in a circos error. - Note: Within
circos_stdout_and_stderr_log.txtlines starting with 'debug' are supposed to be there and summarize the normal execution
- e.g. The circos histogram maxes out at 25000 data points, thus setting the
-
There are also stdout and stderr files for many of the software tools used in the subdirectories of the
intermediate_outputsdirectory that can give information of any errors
References
Software
Hyatt, D., Chen, G., LoCascio, P.F. et al. Prodigal: prokaryotic gene recognition and translation initiation site identification. BMC Bioinformatics 11, 119 (2010). https://doi.org/10.1186/1471-2105-11-119
Altschul SF, Gish W, Miller W, Myers EW, Lipman DJ. Basic local alignment search tool. J Mol Biol. 1990;215(3):403-410. doi:10.1016/S0022-2836(05)80360-2
HMMER. (2020). http://hmmer.org/.
Krzywinski, M., Schein, J., Birol, I., Connors, J., Gascoyne, R., & Horsman, D. et al. (2009). Circos: An information aesthetic for comparative genomics. Genome Research, 19(9), 1639-1645. doi: 10.1101/gr.092759.109
Sample Image Data
Mewis K, Armstrong Z, Song YC, Baldwin SA, Withers SG, Hallam SJ. Biomining active cellulases from a mining bioremediation system. J Biotechnol. 2013;167(4):462-471. doi:10.1016/j.jbiotec.2013.07.015
Acknowledgements
UBC Hallam Lab
Avery Noonan
Connor Morgan-Lang
Release history Release notifications | RSS feed


Download files
Download the file for your platform. If you're not sure which to choose, learn more about installing packages.
Source Distribution
Built Distribution
Filter files by name, interpreter, ABI, and platform.
If you're not sure about the file name format, learn more about wheel file names.
Copy a direct link to the current filters
File details
Details for the file fosvis-1.0.0.tar.gz.
File metadata
- Download URL: fosvis-1.0.0.tar.gz
- Upload date:
- Size: 35.7 kB
- Tags: Source
- Uploaded using Trusted Publishing? No
- Uploaded via: twine/3.2.0 pkginfo/1.6.1 requests/2.22.0 setuptools/45.2.0.post20200210 requests-toolbelt/0.9.1 tqdm/4.42.1 CPython/3.7.6
File hashes
| Algorithm | Hash digest | |
|---|---|---|
| SHA256 |
f910ec26a87b80ca4d4064c5efe27e0b3da3924fac48183193847b8ac34b4354
|
|
| MD5 |
5bd8c923f922f1af747746c8d37bd988
|
|
| BLAKE2b-256 |
e708bce5a4801e7747a424877b1e984278bd7478bab1bd9a2a8339d2fd5fb2da
|
File details
Details for the file fosvis-1.0.0-py3-none-any.whl.
File metadata
- Download URL: fosvis-1.0.0-py3-none-any.whl
- Upload date:
- Size: 34.7 kB
- Tags: Python 3
- Uploaded using Trusted Publishing? No
- Uploaded via: twine/3.2.0 pkginfo/1.6.1 requests/2.22.0 setuptools/45.2.0.post20200210 requests-toolbelt/0.9.1 tqdm/4.42.1 CPython/3.7.6
File hashes
| Algorithm | Hash digest | |
|---|---|---|
| SHA256 |
6494fa474d76f4bda4924c6ceb598a521b41e7e06863ef635a425b468ceacb09
|
|
| MD5 |
5c0e256b1af23d1a48bf4581eb460fd8
|
|
| BLAKE2b-256 |
e38cdc994d090f21dc481c2df57370b8e8cdce822ebc75b3746523c03877a247
|


