
Enhanced DataFrame Display

Project description
FrameDisplay: Enhanced DataFrame Display





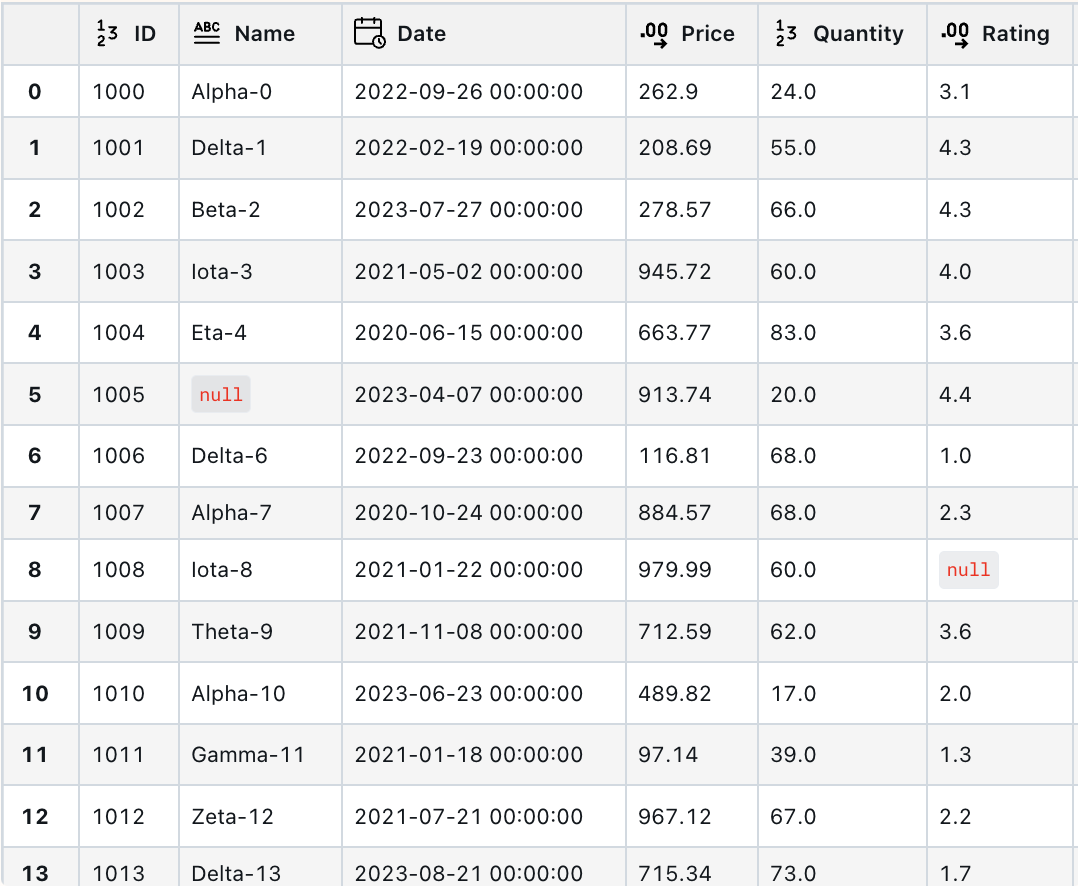
FrameDisplay is a lightweight Python package for rendering Pandas DataFrames as interactive HTML tables within Jupyter Notebooks and JupyterLab. It improves the default DataFrame display by adding features such as resizable columns, client-side sorting, sticky headers and index for improved navigation, data type indicators in column headers, distinct styling for null values, and tooltips for viewing complete cell content.
I work extensively with Pandas in my personal projects and have always wanted something similar to Databricks' display function, but for Jupyter. The existing open-source alternatives were either too heavyweight, lacked the visual appeal or didn't check all the boxes I needed. So I built this package to bridge that gap. It's not perfect yet, but I like it more than the alternatives :)
Live demo: CodePen
Features
- Resizable Columns: Drag column dividers to resize them.
- Sortable Columns: Click on column headers to sort the data.
- Sticky Header & Index: The header and index rows remain visible during vertical and horizontal scrolling.
- Column Type Icons: Icons in headers indicate data types (numeric, string, etc.).
- Null Value Styling:
nullvalues are visually distinct. - Tooltips: Hover over cell content to see the full value.
- No Size Limit: Display DataFrames of any size (be mindful of browser performance with very large tables).
- Customizable Themes: Choose from several built-in themes or add your own CSS.
Roadmap
- Virtual scrolling for improved performance with very large DataFrames.
- Additional customization options (e.g., theming).
Installation
pip install framedisplay
Usage
To display a DataFrame, simply import framedisplay and use the frame_display function:
import pandas as pd
import numpy as np
import framedisplay as fd

df = pd.DataFrame({
    'Name': ['Alice', 'Bob', np.nan],
    'Age': [25, np.nan, 35],
    'Score': [95.5, 87.2, np.nan]
})

fd.frame_display(df)
You can also enable FrameDisplay globally for all DataFrames in Jupyter by calling fd.integrate_with_pandas():
import pandas as pd
import framedisplay as fd

# Enable FrameDisplay for all DataFrames
fd.integrate_with_pandas()

# This will now display using FrameDisplay
df
How it Works
FrameDisplay renders your Pandas DataFrame into an HTML table and injects custom CSS and JavaScript to enable interactive features directly in your Jupyter Notebook or browser.
Configuration Options
FrameDisplay uses global configuration (window.FrameDisplayConfig) that applies to all future table renderings in the notebook/browser session. Once you set a configuration option, it persists until you explicitly reset it or change it.
import framedisplay as fd

fd.configure({
    'theme': 'dark',
    'enableSorting': False
})

# All subsequent calls use this config
fd.frame_display(df1)
fd.frame_display(df2)
You can also pass configuration options directly to frame_display():
fd.frame_display(df1, config={
    'theme': 'ocean',
    'enableSorting': False
})
To reset the global configuration to defaults, call configure() with reset=True:
fd.configure(reset=True)
Themes
| Option | Type | Default | Description |
|---|---|---|---|
theme |
string | '' |
Built-in theme: 'dark', 'ocean', 'sunset', 'neon', 'minimal', 'contrast' |
customCSS |
string | '' |
Additional CSS rules to append after base styles |
Behavior Options
| Option | Type | Default | Description |
|---|---|---|---|
autoInit |
boolean | true |
Automatically initialize on page load |
ReInitialize |
boolean | false |
Force reprocessing of all existing tables with new config |
tableSelector |
string | '.frame-display-table' |
CSS selector for tables to process |
minColumnWidth |
number | 30 |
Minimum column width in pixels |
Feature Toggles
| Option | Type | Default | Description |
|---|---|---|---|
enableResizing |
boolean | true |
Enable column resizing by dragging column dividers |
enableSorting |
boolean | true |
Enable sorting by clicking column headers |
enableTooltips |
boolean | true |
Show full cell content on hover |
enableStickyHeader |
boolean | true |
Keep header row visible when scrolling vertically |
enableStickyIndex |
boolean | true |
Keep index column visible when scrolling horizontally |
Offline Mode
If you are working in an environment without internet access, you can inject the necessary JavaScript and CSS locally by calling initialize() at the start of your notebook. This bundles the required assets into the notebook itself.
import framedisplay as fd
fd.initialize()

# Now you can use fd.frame_display(df) without needing an internet connection
License
MIT


Download files
Download the file for your platform. If you're not sure which to choose, learn more about installing packages.
Source Distribution
Built Distribution
Filter files by name, interpreter, ABI, and platform.
If you're not sure about the file name format, learn more about wheel file names.
Copy a direct link to the current filters
File details
Details for the file framedisplay-1.2.1.tar.gz.
File metadata
- Download URL: framedisplay-1.2.1.tar.gz
- Upload date:
- Size: 37.4 kB
- Tags: Source
- Uploaded using Trusted Publishing? No
- Uploaded via: twine/6.2.0 CPython/3.12.12
File hashes
| Algorithm | Hash digest | |
|---|---|---|
| SHA256 |
477f971aa4d85fa199238e82fe5ab9533be4ed36a29357e1547b3680164ceb46
|
|
| MD5 |
82d4e0d82fd34d378a34804f016933f9
|
|
| BLAKE2b-256 |
509de2fab987dfd9eea8e5903a349ecb4cbb770ac6fcfe59eb4ceaf65185a9a9
|
File details
Details for the file framedisplay-1.2.1-py3-none-any.whl.
File metadata
- Download URL: framedisplay-1.2.1-py3-none-any.whl
- Upload date:
- Size: 40.6 kB
- Tags: Python 3
- Uploaded using Trusted Publishing? No
- Uploaded via: twine/6.2.0 CPython/3.12.12
File hashes
| Algorithm | Hash digest | |
|---|---|---|
| SHA256 |
8a8b2234fc30c8e3204fcb4b2a0d9aab0d842b1b5289d977eec97531b061b1ff
|
|
| MD5 |
349473e017c177752ee56d535b2281e4
|
|
| BLAKE2b-256 |
16d15bd7d862834ff89fdcc5b209f2aa0782ea2de45083dd2a1f37bace604e42
|






