




Website | Docs | Research | Live network
Fuel Gauge is open-source computer vision that tells a camera exactly where it is looking. It solves a camera's pose from the skyline alone, holds decades of footage on one fixed view, maps every pixel to a spot on the ground, and measures how the land changes. No survey, no ground control points, no hand-drawn masks, and it runs on a laptop.
Thousands of cameras already watch wildland for fire. California alone runs 1,309 of them, each posting a frame a minute. To the software behind them a pixel is only a colour, with no distance and no place on a map. Fuel Gauge turns that colour into a measurement.
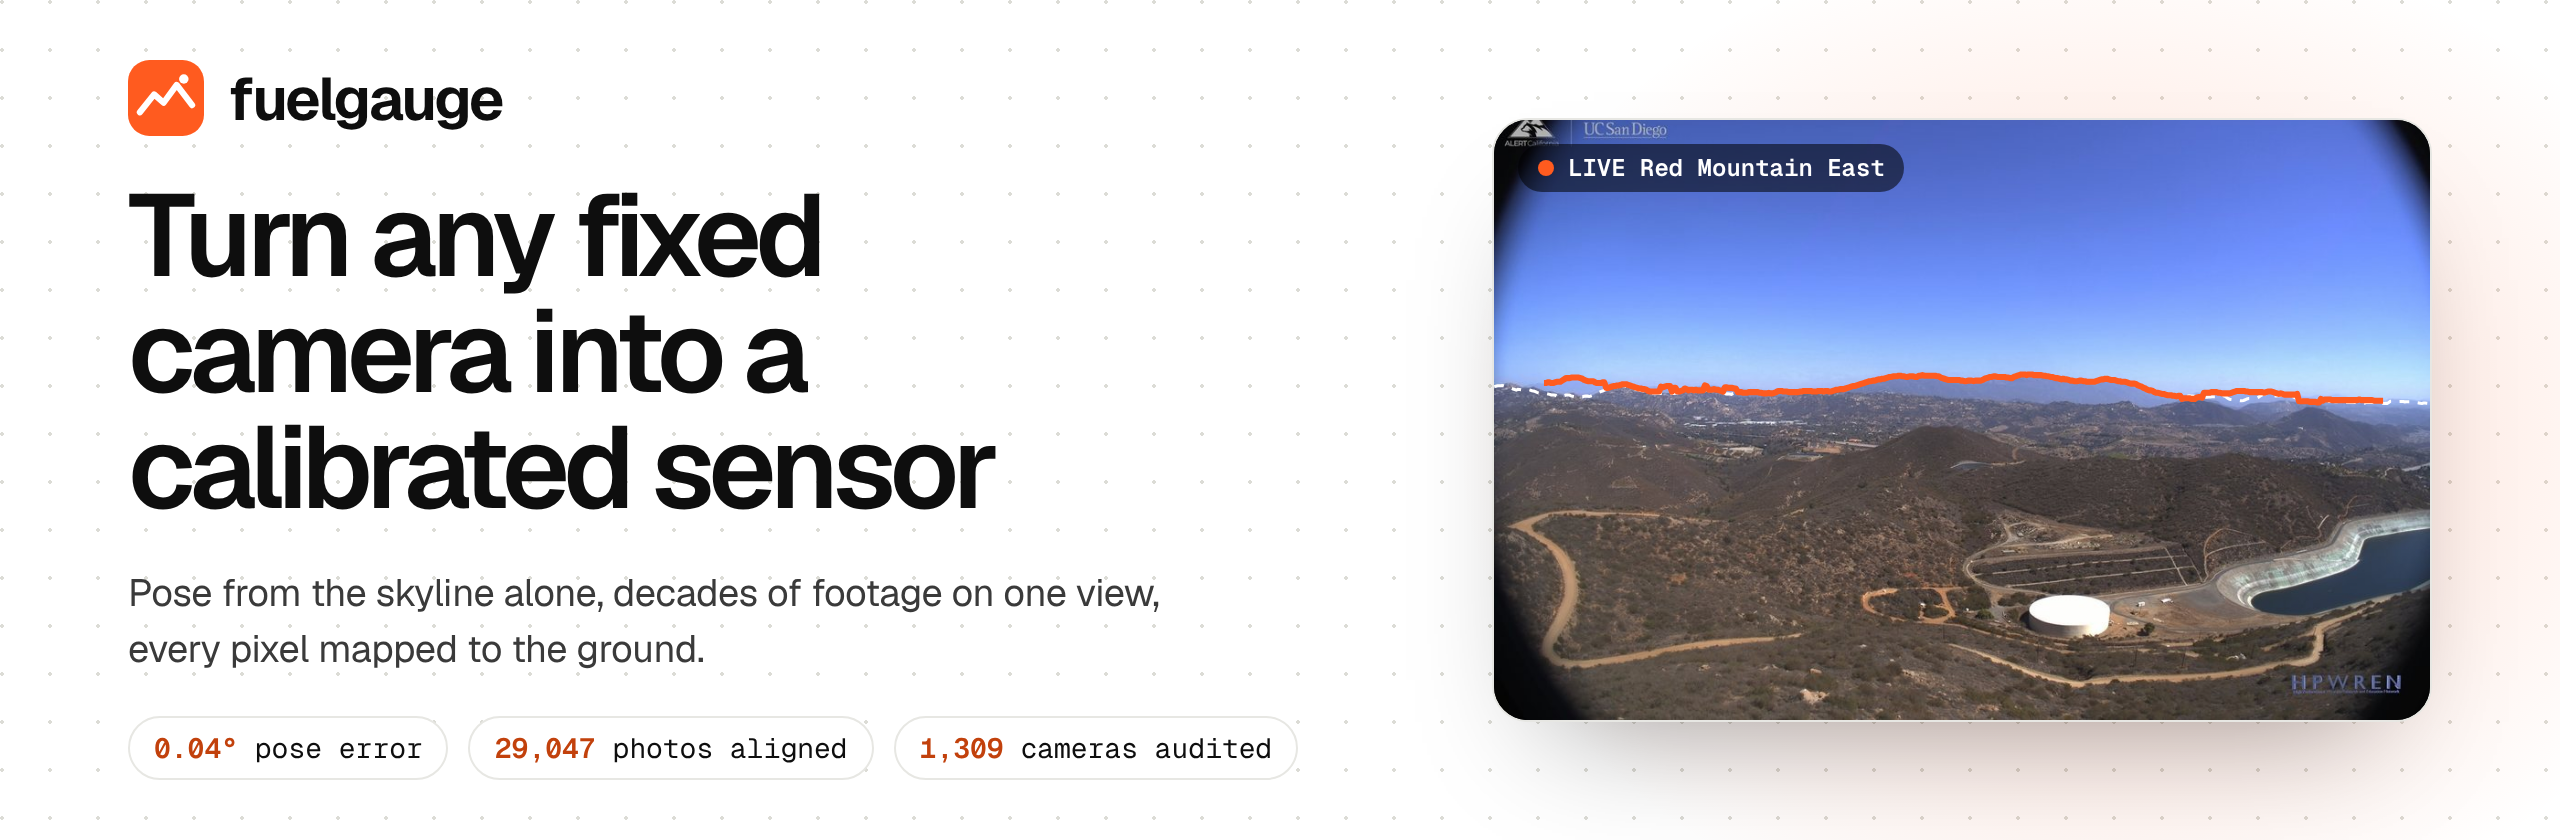
A live HPWREN fire camera after calibration. Orange: the skyline Fuel Gauge found in the photo. Dashed: the skyline a 30 m terrain model predicts from the solved pose, 0.04° apart.
Highlights
0.04°median skyline error after solving a fire camera's pose from one photo |
29,047photos from 21 cameras and 20 years locked onto fixed views |
1,309California fire cameras audited for line of sight in one run |
1.4M acresburned since 2020 by fires that started where no camera could see the smoke |
88%of all burn area out of every camera's view that ten new cameras from the siting search would have seen |
8 camerascalibrated, live, and measured every morning by GitHub Actions |
Quickstart
pip install "fuelgauge[geo,seg]"

# years of photos from one camera -> aligned views -> daily vegetation record
fuelgauge run photos/ out/ridge

# one frame + a location -> camera pose + pixel-to-ground lookup
fuelgauge calibrate ridge frame.jpg --lat 33.4008 --lon -117.1905 --elev 483 --yaw 90

# a list of camera sites -> what they can see, and where to add the next ones
fuelgauge viewshed cameras.csv coverage.tif
fuelgauge site cameras.csv --k 10 > new_sites.csv
Photo times are read from file names (ISO dates, PhenoCam and HPWREN naming) or EXIF, so most archives work as they are. Every step is also a Python function:
from fuelgauge.archive import process
from fuelgauge.measure import measure
from fuelgauge import terrain, viewshed

blocks = process(paths, times, "out/ridge")                  # align
daily, regions, info = measure(blocks, "out/ridge")          # measure
dem = terrain.load_planetary("cop-dem-glo-90", "data", 33.4, -117.2, 40000)
picks = viewshed.site(dem, existing=[(33.40, -117.19)], k=5)  # site new cameras
Out come a daily GRVI/GCC record per view (_daily.csv), an image of the regions it measured (_regions.png), per-photo QA (_qa.json), a pixel-to-ground lookup (_lookup.npz) and a coverage GeoTIFF any GIS opens. Full guide and API reference: docs.
How it works
Five steps from raw footage to a calibrated sensor.
| Step | What it solves | Under the hood |
|---|---|---|
1. Align track, archive |
Cameras drift, get bumped, re-aimed and moved over the years | Frame screening (brightness, Laplacian sharpness, contrast, clipping); SIFT on CLAHE-equalised greyscale with Lowe's ratio test; 4-DOF similarity by RANSAC; keyframe tracking with relocalisation; loop closure through a maximum-inlier spanning tree; relocated cameras kept as second views; bump and re-aim detection |
2. Calibrate terrain, camera |
Public cameras come with a location and nothing else | SegFormer-B2 sky segmentation (ONNX Runtime, CPU) to an edge-snapped skyline; terrain panorama ray-marched from Copernicus 30 m elevation with earth curvature and refraction; equidistant fisheye with one radial term; heading, tilt and roll by bounded Powell search on a trimmed loss; one lens fitted jointly across a network |
3. Map terrain.backproject |
A measurement needs a place on the ground | Every pixel block's ray traced to its first terrain hit: distance, latitude, longitude, slope, aspect and ESA WorldCover land cover |
4. Measure measure, quality, rois, colour |
Raw colour is mostly haze, weather and sensor drift | Haze scoring by Sobel edge correlation against a trailing norm; automatic regions from segmentation plus seasonal amplitude; drift-tracking von Kries white balance; GRVI, GCC and camera NDVI from near-infrared twins; causal smoothing that is safe to nowcast with |
5. Scale viewshed |
Which ground a whole network can see, and where one more camera helps most | Radial viewsheds with curvature and refraction; smoke-column line of sight; greedy maximum-coverage siting over hilltop candidates |
Evaluate evaluate |
Whether a camera signal knows anything the calendar does not | Leave-one-year-out ridge regression on a per-site, per-species seasonal baseline; held-out predictors clipped to the training range; RMSE, anomaly correlation and years beating season |
27 tests run in CI on Python 3.10 and 3.12, covering synthetic drift, re-aims, relocations, terrain, viewsheds, siting, colour drift and leakage in the evaluation.
What we found with it
Every result below was produced end to end by the pipeline on public data, and each has an interactive page on the research site.
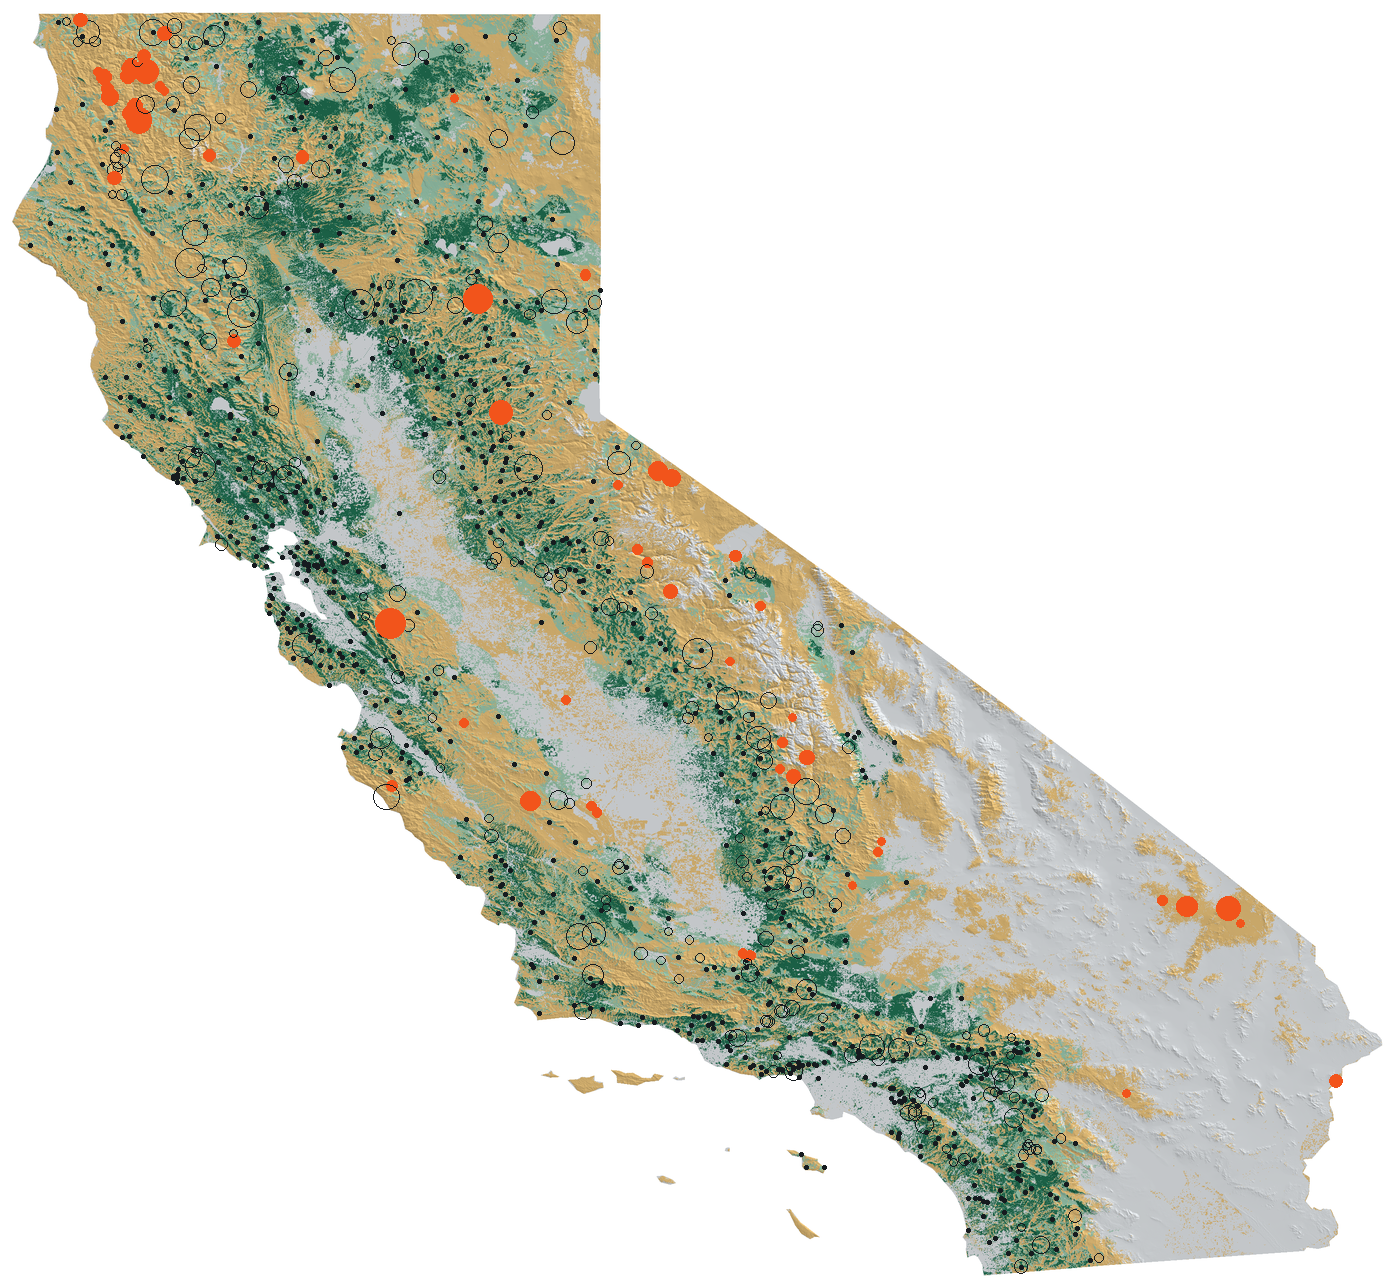
A line-of-sight audit of California's fire cameras. Fuel Gauge traced terrain line of sight from all 1,309 ALERTCalifornia cameras across the state and checked it against every wildfire from 2020 to 2025.
- 46% of California's wildland is in view of at least one camera, and 20% of two, the overlap needed to triangulate smoke.
- 21% of the 277 fires over 1,000 acres started where no camera could see even a 300 m smoke column. Those fires, including the SCU Lightning Complex and the Claremont Fire, burned 1.4 million acres.
- A siting search over 11,847 hilltops finds ten new sites that add 9,332 km² of watched wildland. Looking back, a different ten would have seen 1.31 million of the 1.48 million acres that burned out of view.
- The biggest blind spots: the Klamath Mountains, Yosemite's high country, the Modoc Plateau and the Diablo Range.
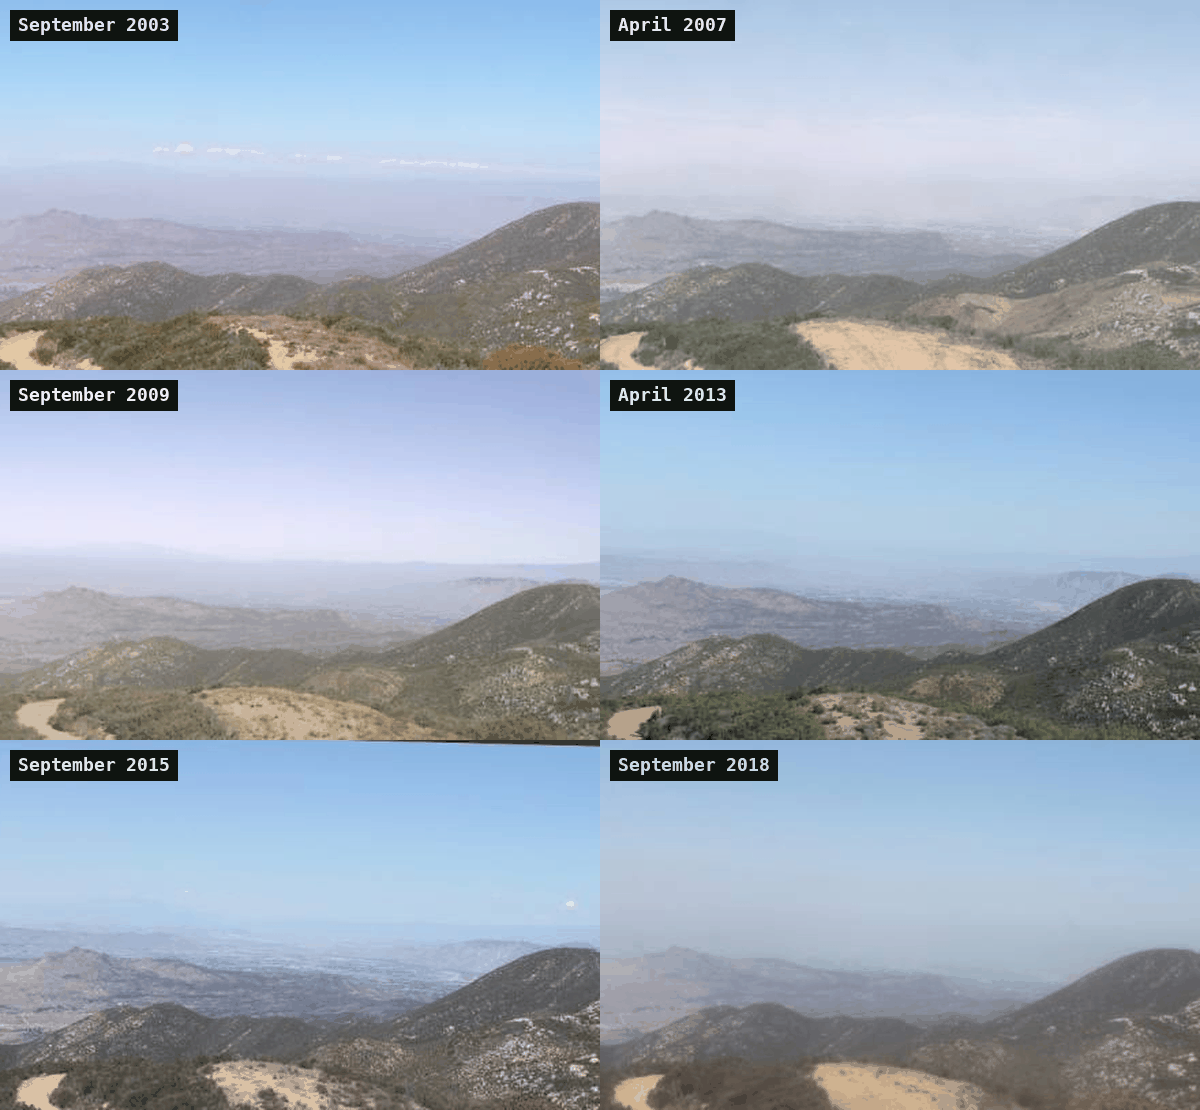
Twenty years of footage on one view. 29,047 daily photos from 21 PhenoCam cameras in 6 states were locked onto fixed views, including six cameras that were moved to a new mast mid-record. Automatic regions beat the network's own hand-drawn masks at 12 of 20 cameras, and drift-tracking white balance lifts the year-to-year signal by 68%.
A benchmark for camera fuel moisture. The cameras were scored against 3,832 field samples of live fuel moisture, one held-out year at a time. Satellite shortwave infrared leads (anomaly correlation 0.31, ahead of season at 15 of 21 cameras), camera colour matches the seasonal baseline, and near-infrared camera NDVI adds little. That gives the field a clear target, and the harness ships with the package so the next signal can be scored the same way.
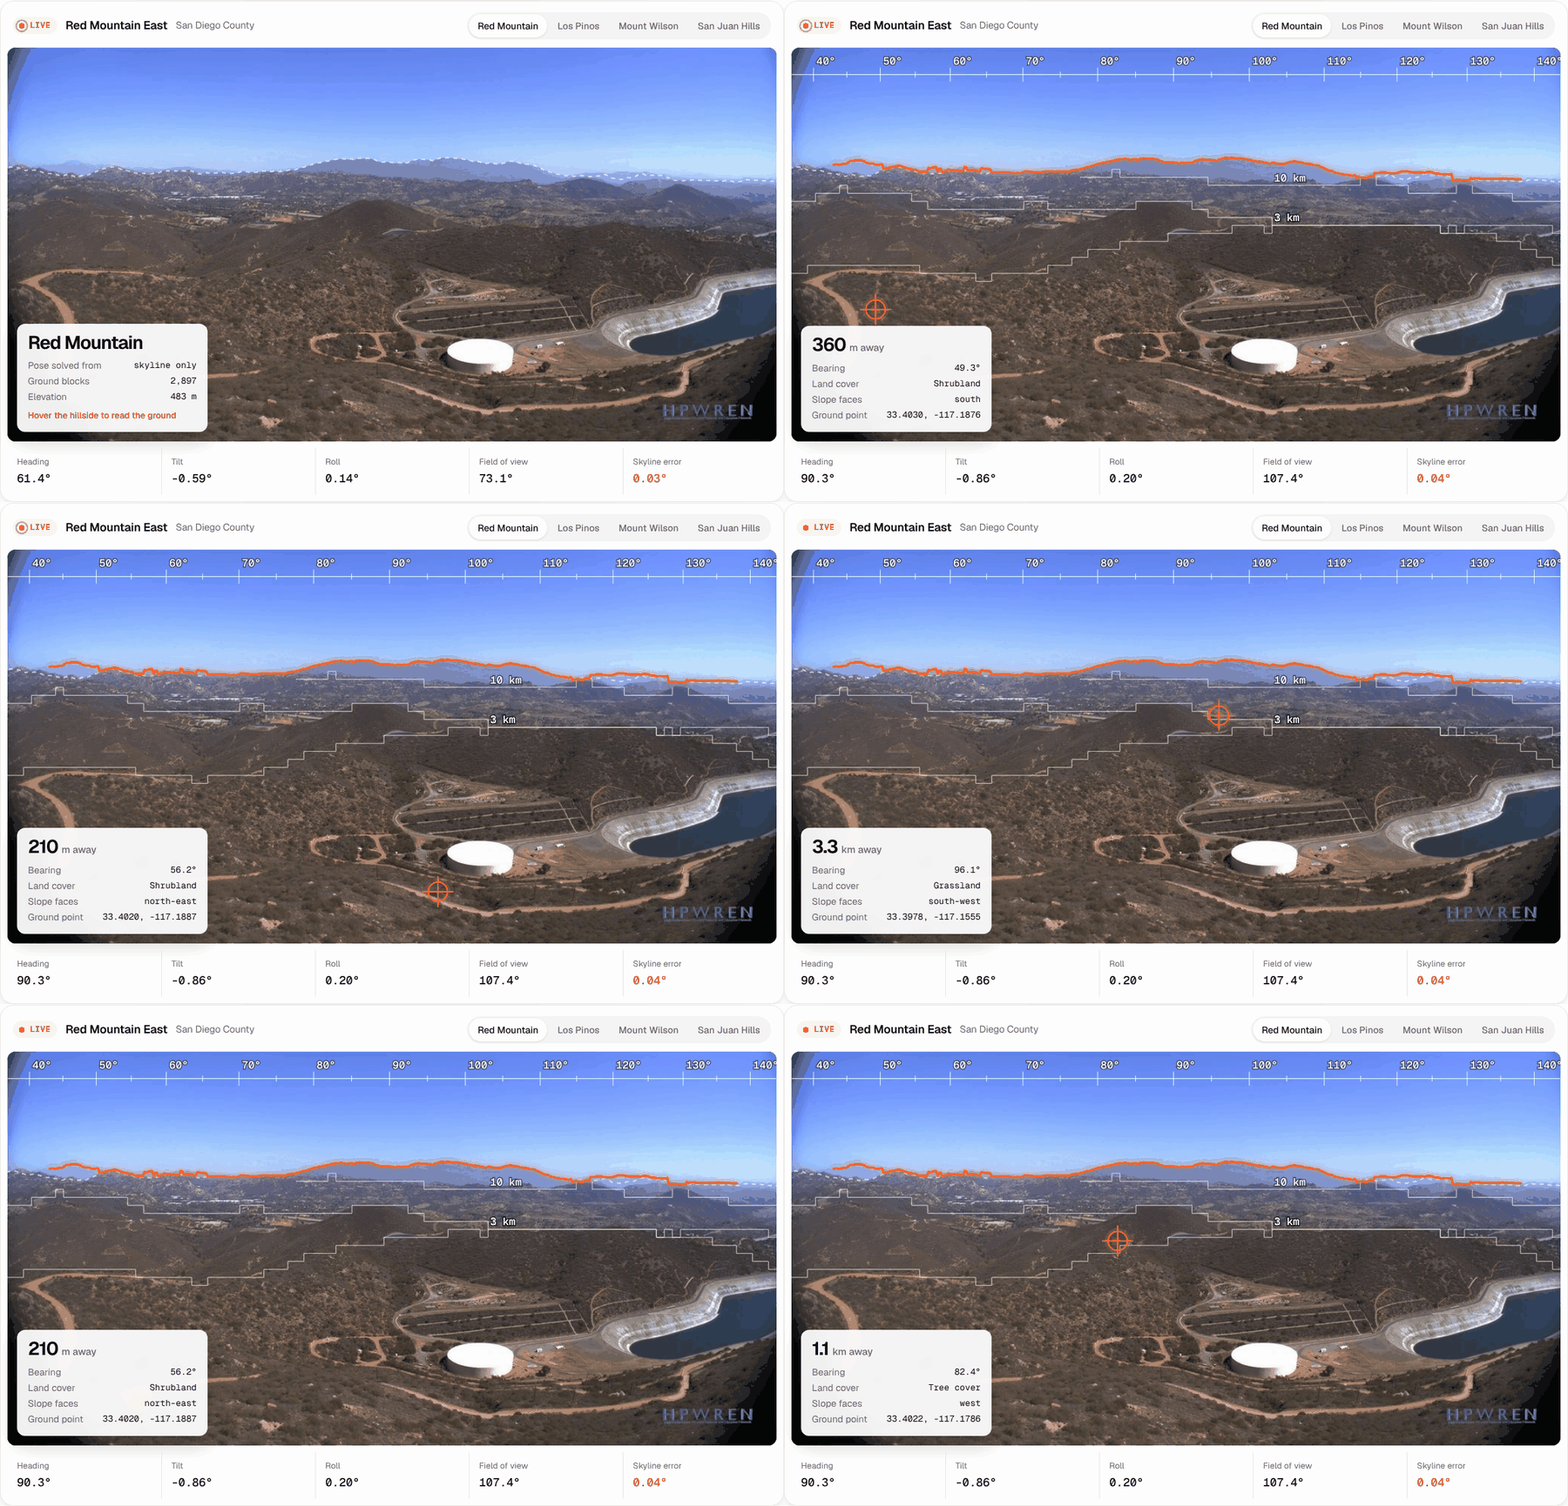
A live, calibrated fire-camera network. Eight HPWREN cameras in Southern California, calibrated from their skylines with one shared lens (median error 0.04° to 0.17°). Every morning a GitHub Action pulls the latest frames, measures every ground block and publishes which slopes are drying fastest.
Scope and what's next
- The coverage audit shows the network at full reach. Each site is treated as panning a full circle out to 30 km, so the gaps it finds are the floor: haze, night and where a camera happens to point only widen them. Next, per-camera aim from the live calibration.
- The fuel moisture benchmark is scored the hard way. Field plots sit up to 25 km from each camera, often on another slope, and are sampled every two to four weeks. Any signal that holds up here is robust.
- Colour cameras see greenness; leaf water shows in shortwave infrared. That is why satellite infrared leads, and why pairing camera timing with satellite infrared is the next step. The harness already scores combinations.
- The live network reports relative drying today and is ready to score fuel moisture as soon as field plots sit close enough to its cameras.
Repository
| Path | What it is |
|---|---|
fuelgauge/ |
The package and the fuelgauge command |
docs/ |
The website: product page, docs (generated by scripts/build_docs.py), research pages and live data |
scripts/ |
The studies end to end: download, align, score, map, siting and site data |
live/ |
The daily updater for the calibrated HPWREN cameras, run by GitHub Actions |
study/ |
Camera list, per-camera results and coverage statistics |
tests/ |
Synthetic cameras and terrain |
Reproduce the studies
pip install -e ".[geo,seg,eval,dev]"
export DATA=data
python scripts/fetch_lfmc.py                  # Globe-LFMC 2.0 field samples
python scripts/fetch_phenocam.py              # midday photos for the cameras in study/cameras.json
python scripts/fetch_modis.py                 # MODIS MCD43A4 at each camera view and sampling site
python scripts/register_phenocam.py <camera>  # once per camera (STRIDE=2 keeps every other day)
python scripts/fetch_nir.py <cam,cam,...>     # near-infrared twins + exposures for IR-capable cameras
python scripts/nir.py <cam> ...               # camera NDVI on the registered regions
python scripts/study.py && python scripts/timing.py && python scripts/summary.py
python scripts/fetch_fires.py                 # NIFC WFIGS California wildfire ignitions
python scripts/coverage.py && python scripts/siting.py && python scripts/coverage_report.py   # viewsheds, siting, stats, maps
python scripts/build_site_data.py             # docs/data/ for the site
The full run downloads about 60,000 photos and takes a few hours on two CPU cores.
Data and credits
- PhenoCam Network (phenocam.nau.edu). Richardson et al. (2018), Tracking vegetation phenology across diverse North American biomes using PhenoCam imagery, Scientific Data 5:180028. Per-camera acknowledgements are in study/ACKNOWLEDGEMENTS.md.
- HPWREN camera network, University of California San Diego (hpwren.ucsd.edu). Images courtesy of HPWREN.
- ALERTCalifornia camera network (UC San Diego, with CAL FIRE): camera positions from the public camera map.
- Globe-LFMC 2.0. Yebra et al. (2024), Scientific Data 11:332, compiled in part from the US National Fuel Moisture Database.
- MODIS MCD43A4 v6.1 (NASA LP DAAC), Copernicus DEM GLO-30 (ESA) and ESA WorldCover 2021, through Microsoft Planetary Computer.
- SegFormer-B2 fine-tuned on ADE20K (NVIDIA), ONNX export by Xenova on Hugging Face.
- NIFC WFIGS wildland fire incident locations (National Interagency Fire Center).
- Camera NDVI method: Petach et al. (2014), Monitoring vegetation phenology using an infrared-enabled security camera, Agricultural and Forest Meteorology 195-196:143-151.
Built by Shourya Mehta. To cite, see CITATION.cff.
1 maintainer

Metadata
1 maintainer
Release files for fuelgauge 0.3.0
For a detailed explanation of source distributions (sdists) and built distributions (wheels), please see the package formats documentation.
Source distribution (sdist)
| File | Size | Uploaded | |
|---|---|---|---|
| fuelgauge-0.3.0.tar.gz | 49.0 kB | Details |
Built distribution (wheel)
| File | Interpreter | ABI | Platform | Reset |
|---|---|---|---|---|
| fuelgauge-0.3.0-py3-none-any.whl | Python 3 | none | any | Details |
Total release size: 91.6 kB
Release files / fuelgauge-0.3.0.tar.gz
| Download URL | fuelgauge-0.3.0.tar.gz |
|---|---|
| Size | 49.0 kB |
| Tags | Source |
|
SHA-256 checksum How to use checksums |
4674519386bf4d063c7b188f6e1c815c745fe18e6ab49fbb0e008b751bb4bf93
|
|
BLAKE2b-256 checksum How to use checksums |
bc3924bbfd876f78c8826390d5ce3328d91a1e18a54d06c65a0866f1fa6b8717
|
| Upload date | |
|
Uploaded using Trusted Publishing? What is trusted publishing? |
Yes |
| Uploaded via |
twine/7.0.0 CPython/3.13.14
|
Provenance
Provenance describes where a file came from. On PyPI, provenance is shared via attestations, which provide a verifiable record of the build or publishing details. View details, limitations and caveats.


PyPI Publish Attestation
PyPI verified that this artifact, at this checksum, originated from the publisher listed below.
Signed by GitHub Actions, verified by PyPI on Oct 9, 2026.
Transparency logRelease files / fuelgauge-0.3.0-py3-none-any.whl
| Download URL | fuelgauge-0.3.0-py3-none-any.whl |
|---|---|
| Size | 42.6 kB |
| Tags | Python 3 |
|
SHA-256 checksum How to use checksums |
382b63725491a51cf02feacff0560f0164ba2d074acf44699eee7b2679f60eae
|
|
BLAKE2b-256 checksum How to use checksums |
b1340139b9c16419c6ef8ddcd4d738dba228fd9205c4e5d3bb0644929f0ca4f0
|
| Upload date | |
|
Uploaded using Trusted Publishing? What is trusted publishing? |
Yes |
| Uploaded via |
twine/7.0.0 CPython/3.13.14
|
Provenance
Provenance describes where a file came from. On PyPI, provenance is shared via attestations, which provide a verifiable record of the build or publishing details. View details, limitations and caveats.
PyPI Publish Attestation
PyPI verified that this artifact, at this checksum, originated from the publisher listed below.
Signed by GitHub Actions, verified by PyPI on Oct 9, 2026.
Transparency log












