
A package designed for data scientists and teachers, to speed up their ML projects, focused on exploratory data analysis, data preparation, and model performance.

Project description
funpymodeling

A Python package designed for data scientists and teachers to speed up Exploratory Data Analysis (EDA), Data Preparation, and Model Performance evaluation.
Companion package for the book Data Science Live Book.
Install
pip install funpymodeling
Quick-start
from funpymodeling import *
import pandas as pd
All functions are well documented. Access the documentation via help(function_name).
Some functions have comments in the source code so users can open the black-box and learn how they were developed, or fine-tune/improve any of them.
Exploratory Data Analysis
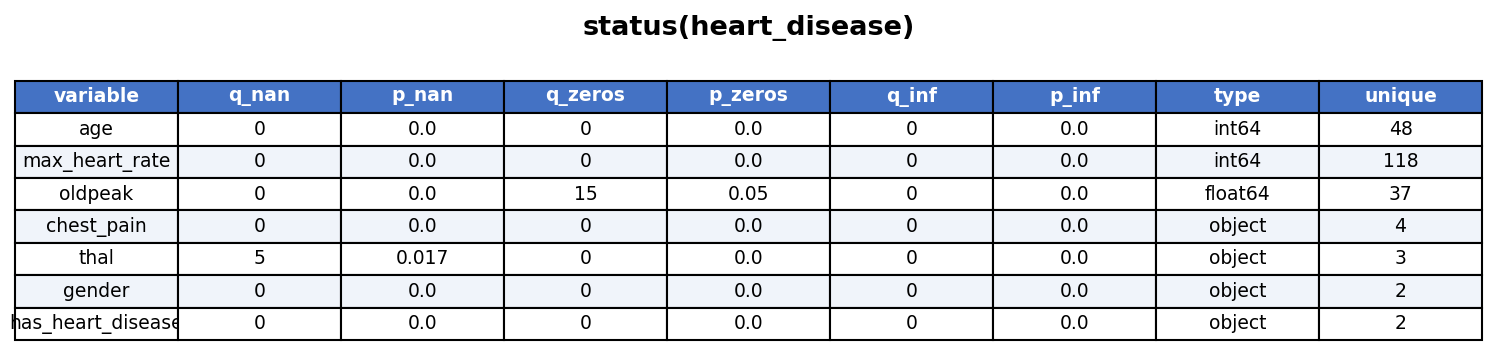
status — Dataset health check
For each variable: quantity and percentage of zeros, NAs, and infinite values. Percentages are rounded to 2 decimal places. Also reports data type and number of unique values.
status(heart_disease)
profiling_num — Numerical variable profiling
Returns mean, std_dev, variation_coef, percentiles (p_01 to p_99), skewness, kurtosis, IQR, range_98 and range_80.
profiling_num(heart_disease)

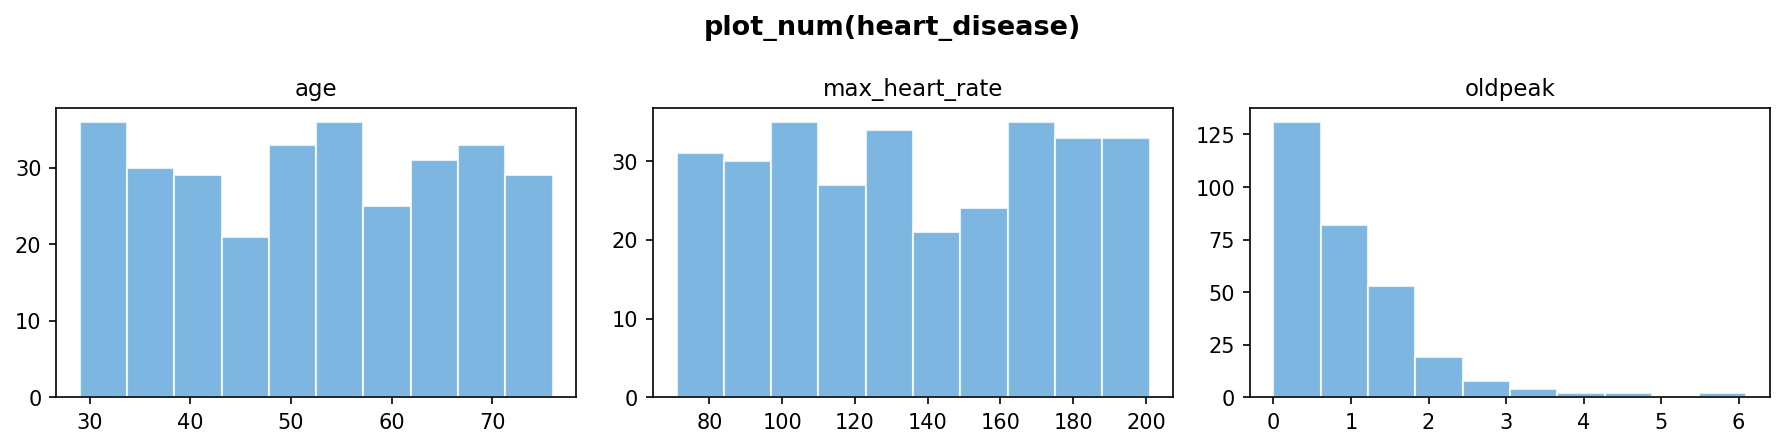
plot_num — Histograms for numerical variables
Plots histograms for all numerical variables in a single figure.
plot_num(heart_disease)
plot_num(heart_disease, bins=20)
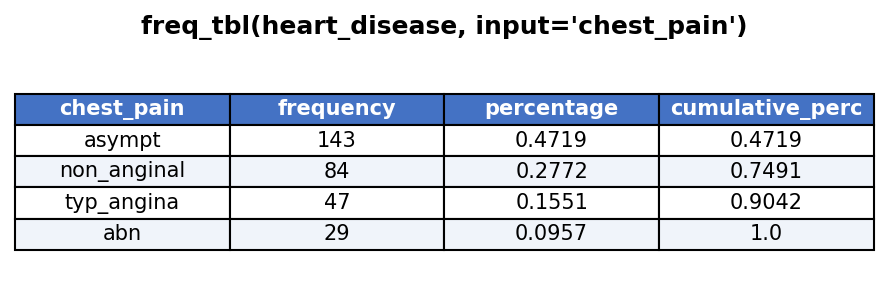
freq_tbl — Frequency table for categorical variables
Returns frequency, percentage (as proportion 0 to 1), and cumulative percentage for each category. Handles category dtype, NaN values, and high-cardinality variables.
freq_tbl(heart_disease, input='chest_pain')

# Multiple variables
freq_tbl(heart_disease, input=['chest_pain', 'gender'])

# All categorical variables at once
freq_tbl(heart_disease)
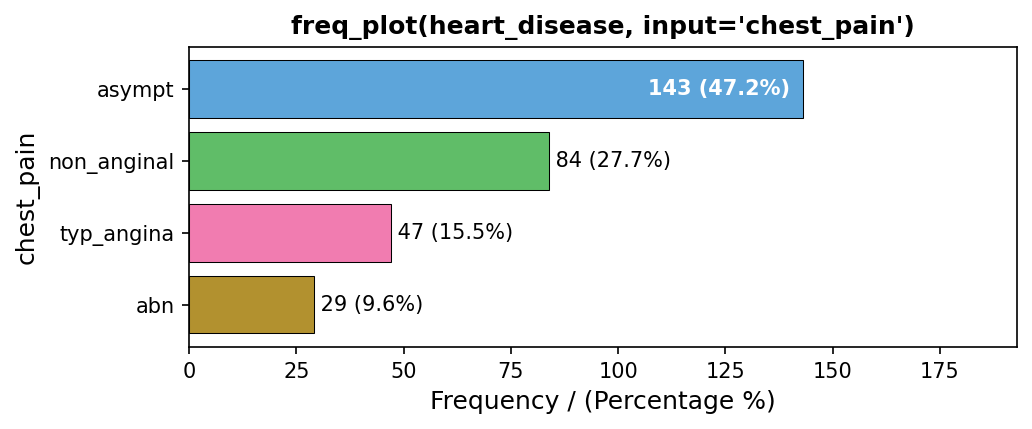
freq_plot — Bar chart for categorical variables
Horizontal bar charts showing frequency and percentage for each category.
freq_plot(heart_disease, input='chest_pain')
Target & Variable Analysis
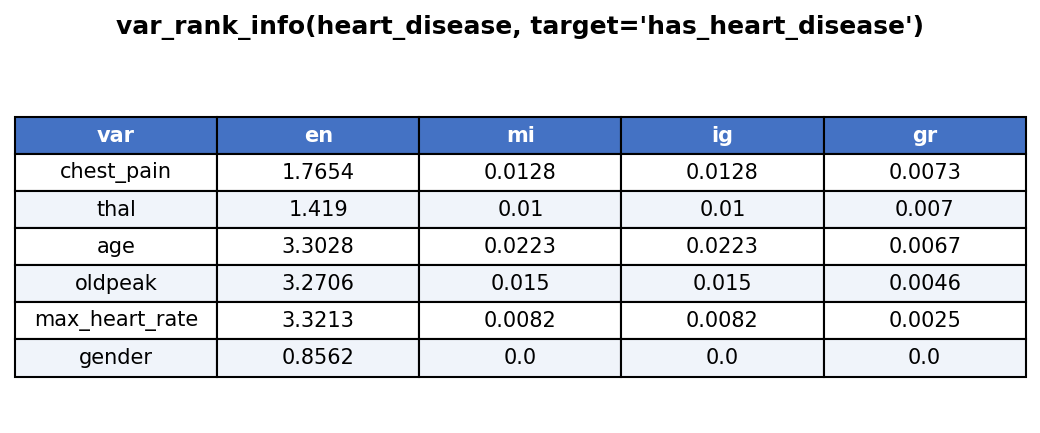
var_rank_info — Variable importance via Information Theory
Computes entropy (en), mutual information (mi), information gain (ig), and gain ratio (gr) for each variable against the target.
var_rank_info(heart_disease, target='has_heart_disease')
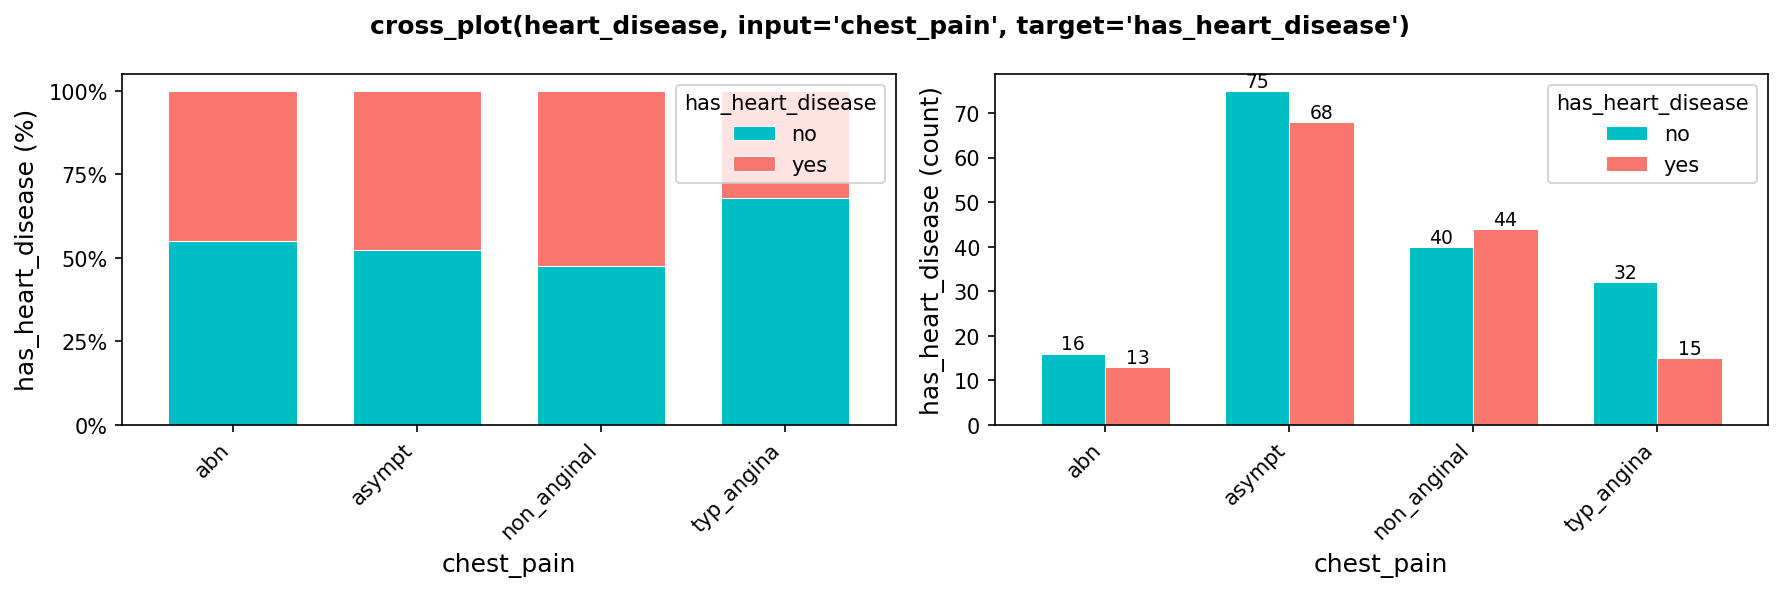
cross_plot — Input vs. target distribution
Shows how the input variable relates to the target variable, with likelihood rates for each bin/bucket. Supports plot_type='both' (default), 'percentual', or 'quantity'.
cross_plot(heart_disease, input='chest_pain', target='has_heart_disease')

# Multiple variables at once
cross_plot(heart_disease, input=['age', 'chest_pain'], target='has_heart_disease')
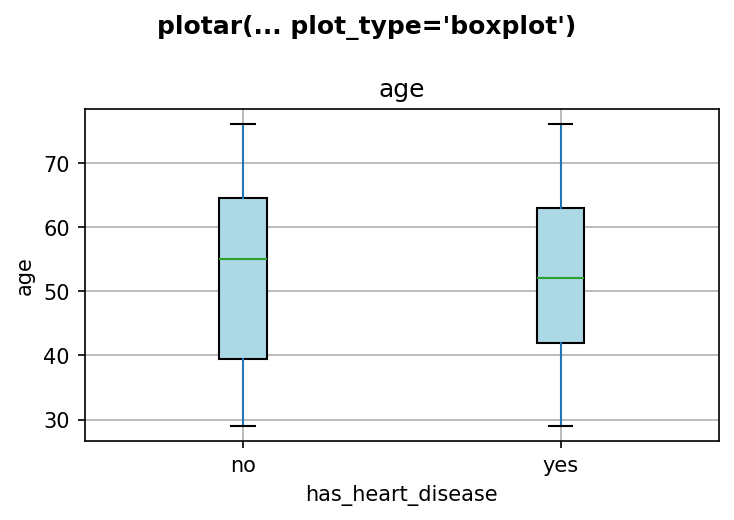
plotar — Boxplot and density histograms by target
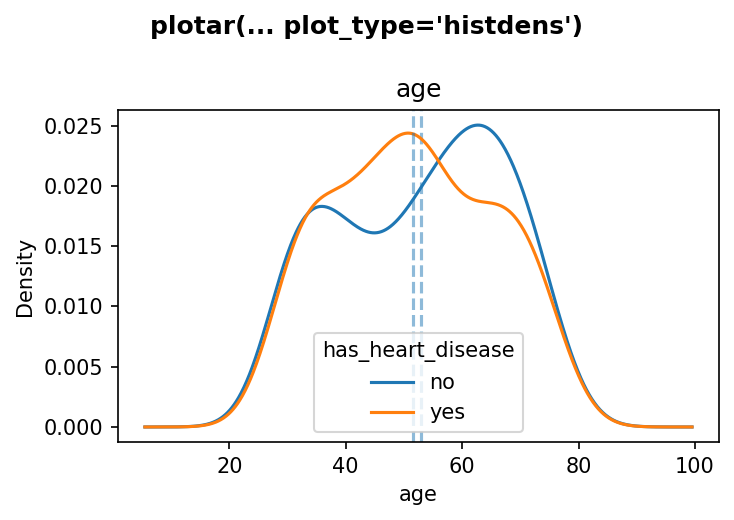
Useful to visually assess whether a variable discriminates between target classes.
# Boxplot
plotar(heart_disease, input='age',
       target='has_heart_disease', plot_type='boxplot')
# Density histogram
plotar(heart_disease, input='age',
       target='has_heart_disease', plot_type='histdens')
Notes:
inputmust be numeric andtargetmust be categorical.targetcan be multi-class (not only binary).
categ_analysis — Categorical variable vs. binary target
Profiling of a categorical input against a binary target: representativeness (perc_rows) and accuracy (perc_target) of each category.
categ_analysis(data, input='country', target='has_flu')
corr_pair — Pairwise correlation
Calculate pairwise correlation (R and R²) among all numeric features.
corr_pair(heart_disease)
Data Preparation
equal_freq — Equal-frequency binning
Splits a numeric variable into n_bins segments of approximately equal size.
equal_freq(heart_disease['age'], n_bins=5)
discretize_get_bins / discretize_df — Two-step discretization
First get the bins, then apply them. Useful for applying the same bins to train and test sets.
d_bins = discretize_get_bins(heart_disease, input=['age', 'oldpeak'], n_bins=5)
heart_disease_disc = discretize_df(heart_disease, d_bins)
convert_df_to_categoric — Convert all columns to categorical
Numeric variables are binned using equal-frequency; other variables are cast to string.
convert_df_to_categoric(heart_disease, n_bins=5)
range01 — Min-max normalization
Scales a numeric vector to the [0, 1] range.
range01(heart_disease['oldpeak'])
auto_grouping — Reduce cardinality via clustering
Groups categories of a high-cardinality variable using KMeans on profiling metrics (perc_rows, perc_target).
res = auto_grouping(data, input='country', target='has_flu', n_groups=3)
res['df_equivalence']   # mapping from original to new categories
res['recateg_results']  # profiling of the new groups
Outlier Treatment
tukey_outlier / hampel_outlier — Outlier thresholds
tukey_outlier(heart_disease['age'])
# {'lower': ..., 'upper': ...}

hampel_outlier(heart_disease['age'])
# {'lower': ..., 'upper': ...}
prep_outliers — Handle outliers in a DataFrame
Two modes:
type='stop'— clips values at the threshold (recommended for predictive modeling)type='set_na'— converts outliers to NaN (recommended for statistical analysis)
Three methods: 'tukey', 'hampel', 'bottom_top'.
# Clip outliers using Tukey method
prep_outliers(heart_disease, input=['age', 'oldpeak'], type='stop', method='tukey')

# Set outliers to NA using Hampel method
prep_outliers(heart_disease, input=['age'], type='set_na', method='hampel')

# Bottom/top percentile
prep_outliers(heart_disease, input=['age'], type='stop',
              method='bottom_top', top_percent=0.01, bottom_percent=0.01)
Predictive Model Performance
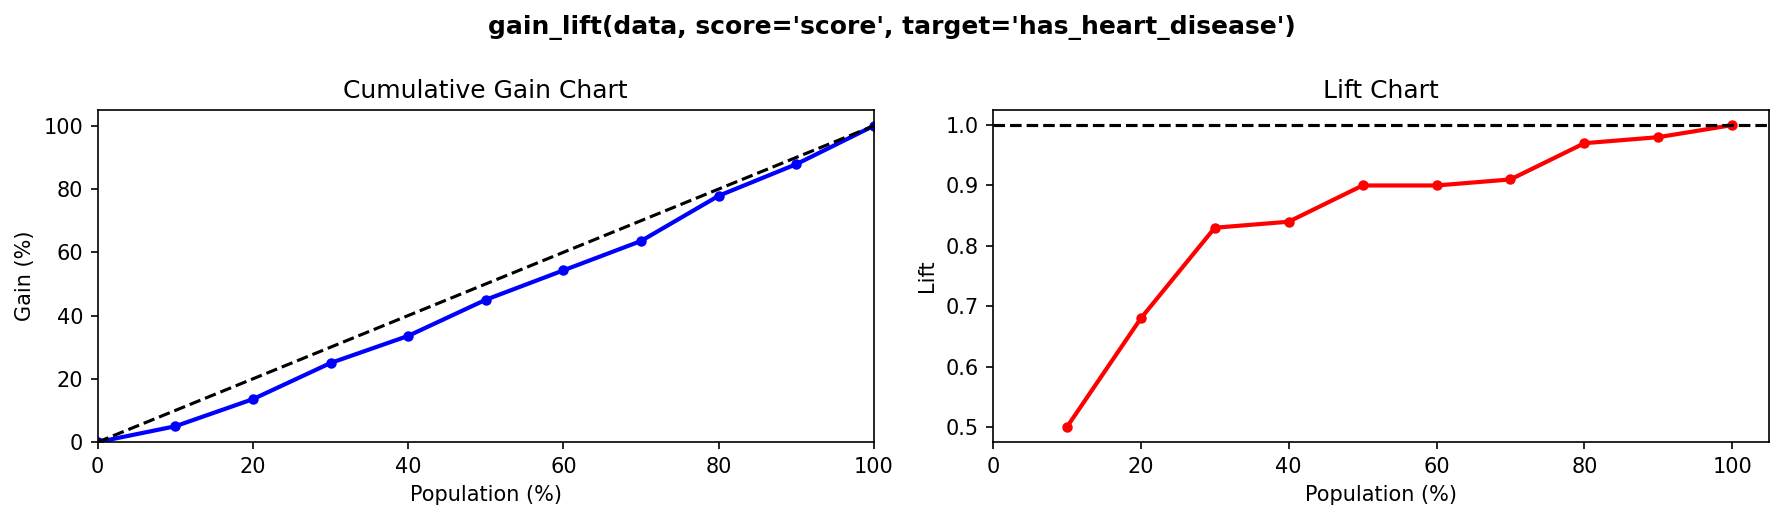
gain_lift — Gain and lift curves
Higher values at the beginning of the population implies a better model. Automatically detects score direction (whether high scores indicate positive or negative class).
gain_lift(data=scored_data, score='score', target='has_heart_disease')
coord_plot — Coordinate plot for clustering
Parallel coordinate plot for cluster profiling. Returns original and min-max normalized tables.
coord_plot(iris, group_var='species')
All Functions
Exploratory Data Analysis
| Function | Description |
|---|---|
status(data) |
Health check: zeros, NAs, infinites, types, unique values (percentages rounded to 2 decimals) |
profiling_num(data) |
Numeric profiling: mean, std, percentiles, skewness, kurtosis |
freq_tbl(data, input) |
Frequency table for categorical variables |
freq_plot(data, input) |
Horizontal bar chart of frequencies |
plot_num(data, bins) |
Histograms for all numerical variables |
corr_pair(data, method) |
Pairwise correlation (R and R²) |
num_vars(data) |
Returns numeric column names |
cat_vars(data) |
Returns categorical column names |
Data Preparation
| Function | Description |
|---|---|
equal_freq(var, n_bins) |
Equal-frequency binning |
tukey_outlier(x) |
Tukey outlier thresholds (IQR × 3) |
hampel_outlier(x, k_mad_value) |
Hampel outlier thresholds (median ± k×MAD) |
prep_outliers(data, input, type, method) |
Handle outliers: set_na or stop (clip) |
categ_analysis(data, input, target) |
Profile categorical variable vs binary target |
auto_grouping(data, input, target, n_groups) |
Reduce cardinality via KMeans clustering |
discretize_get_bins(data, input, n_bins) |
Get bin thresholds for discretization (edges rounded to 2 decimals) |
discretize_df(data, data_bins) |
Apply discretization bins to a DataFrame |
range01(x) |
Min-max normalization to [0, 1] |
convert_df_to_categoric(data, n_bins) |
Convert all columns to categorical |
todf(data) |
Convert lists, arrays, Series to DataFrame |
Target & Variable Analysis
| Function | Description |
|---|---|
cross_plot(data, input, target) |
Stacked bar chart: input vs binary target |
var_rank_info(data, target) |
Variable ranking via Information Theory |
plotar(data, input, target, plot_type) |
Boxplot or density histogram grouped by target |
Model Validation
| Function | Description |
|---|---|
gain_lift(data, score, target) |
Cumulative gain and lift chart + table (auto-detects score direction) |
coord_plot(data, group_var) |
Coordinate (parallel) plot for cluster profiling |
Dependencies
pandas, numpy, matplotlib, scikit-learn, scipy, seaborn
Release history Release notifications | RSS feed


Download files
Download the file for your platform. If you're not sure which to choose, learn more about installing packages.
Source Distribution
Built Distribution
Filter files by name, interpreter, ABI, and platform.
If you're not sure about the file name format, learn more about wheel file names.
Copy a direct link to the current filters
File details
Details for the file funpymodeling-0.2.7.tar.gz.
File metadata
- Download URL: funpymodeling-0.2.7.tar.gz
- Upload date:
- Size: 20.9 kB
- Tags: Source
- Uploaded using Trusted Publishing? No
- Uploaded via: twine/6.2.0 CPython/3.10.0
File hashes
| Algorithm | Hash digest | |
|---|---|---|
| SHA256 |
cb2afa41496ea80d3688dc774925ca2a23318975d21c72a460570f6185c0c91c
|
|
| MD5 |
47b9662fc85f8ed6d8ac77425f9539c3
|
|
| BLAKE2b-256 |
d408b5d7a9db9d056dae602919da6026c4fd36fd87a2fc560600ac4a9411a1ea
|
File details
Details for the file funpymodeling-0.2.7-py3-none-any.whl.
File metadata
- Download URL: funpymodeling-0.2.7-py3-none-any.whl
- Upload date:
- Size: 24.4 kB
- Tags: Python 3
- Uploaded using Trusted Publishing? No
- Uploaded via: twine/6.2.0 CPython/3.10.0
File hashes
| Algorithm | Hash digest | |
|---|---|---|
| SHA256 |
7eb3b9c34c36b5f6f2b93131c82c5cc60369d8bb6d0da37fafb4b718bcb9b4eb
|
|
| MD5 |
c0f59336a18a42fd2bce9398b8ff25a3
|
|
| BLAKE2b-256 |
81578a878bbfaee0b60aab33ea08b53c0840c97a6daffc7146bd9cf7d40095a6
|






