No project description provided

Project description
Forex Dashboard
Project Status
| Testing | Package |
|---|---|
 |
 |
Overview
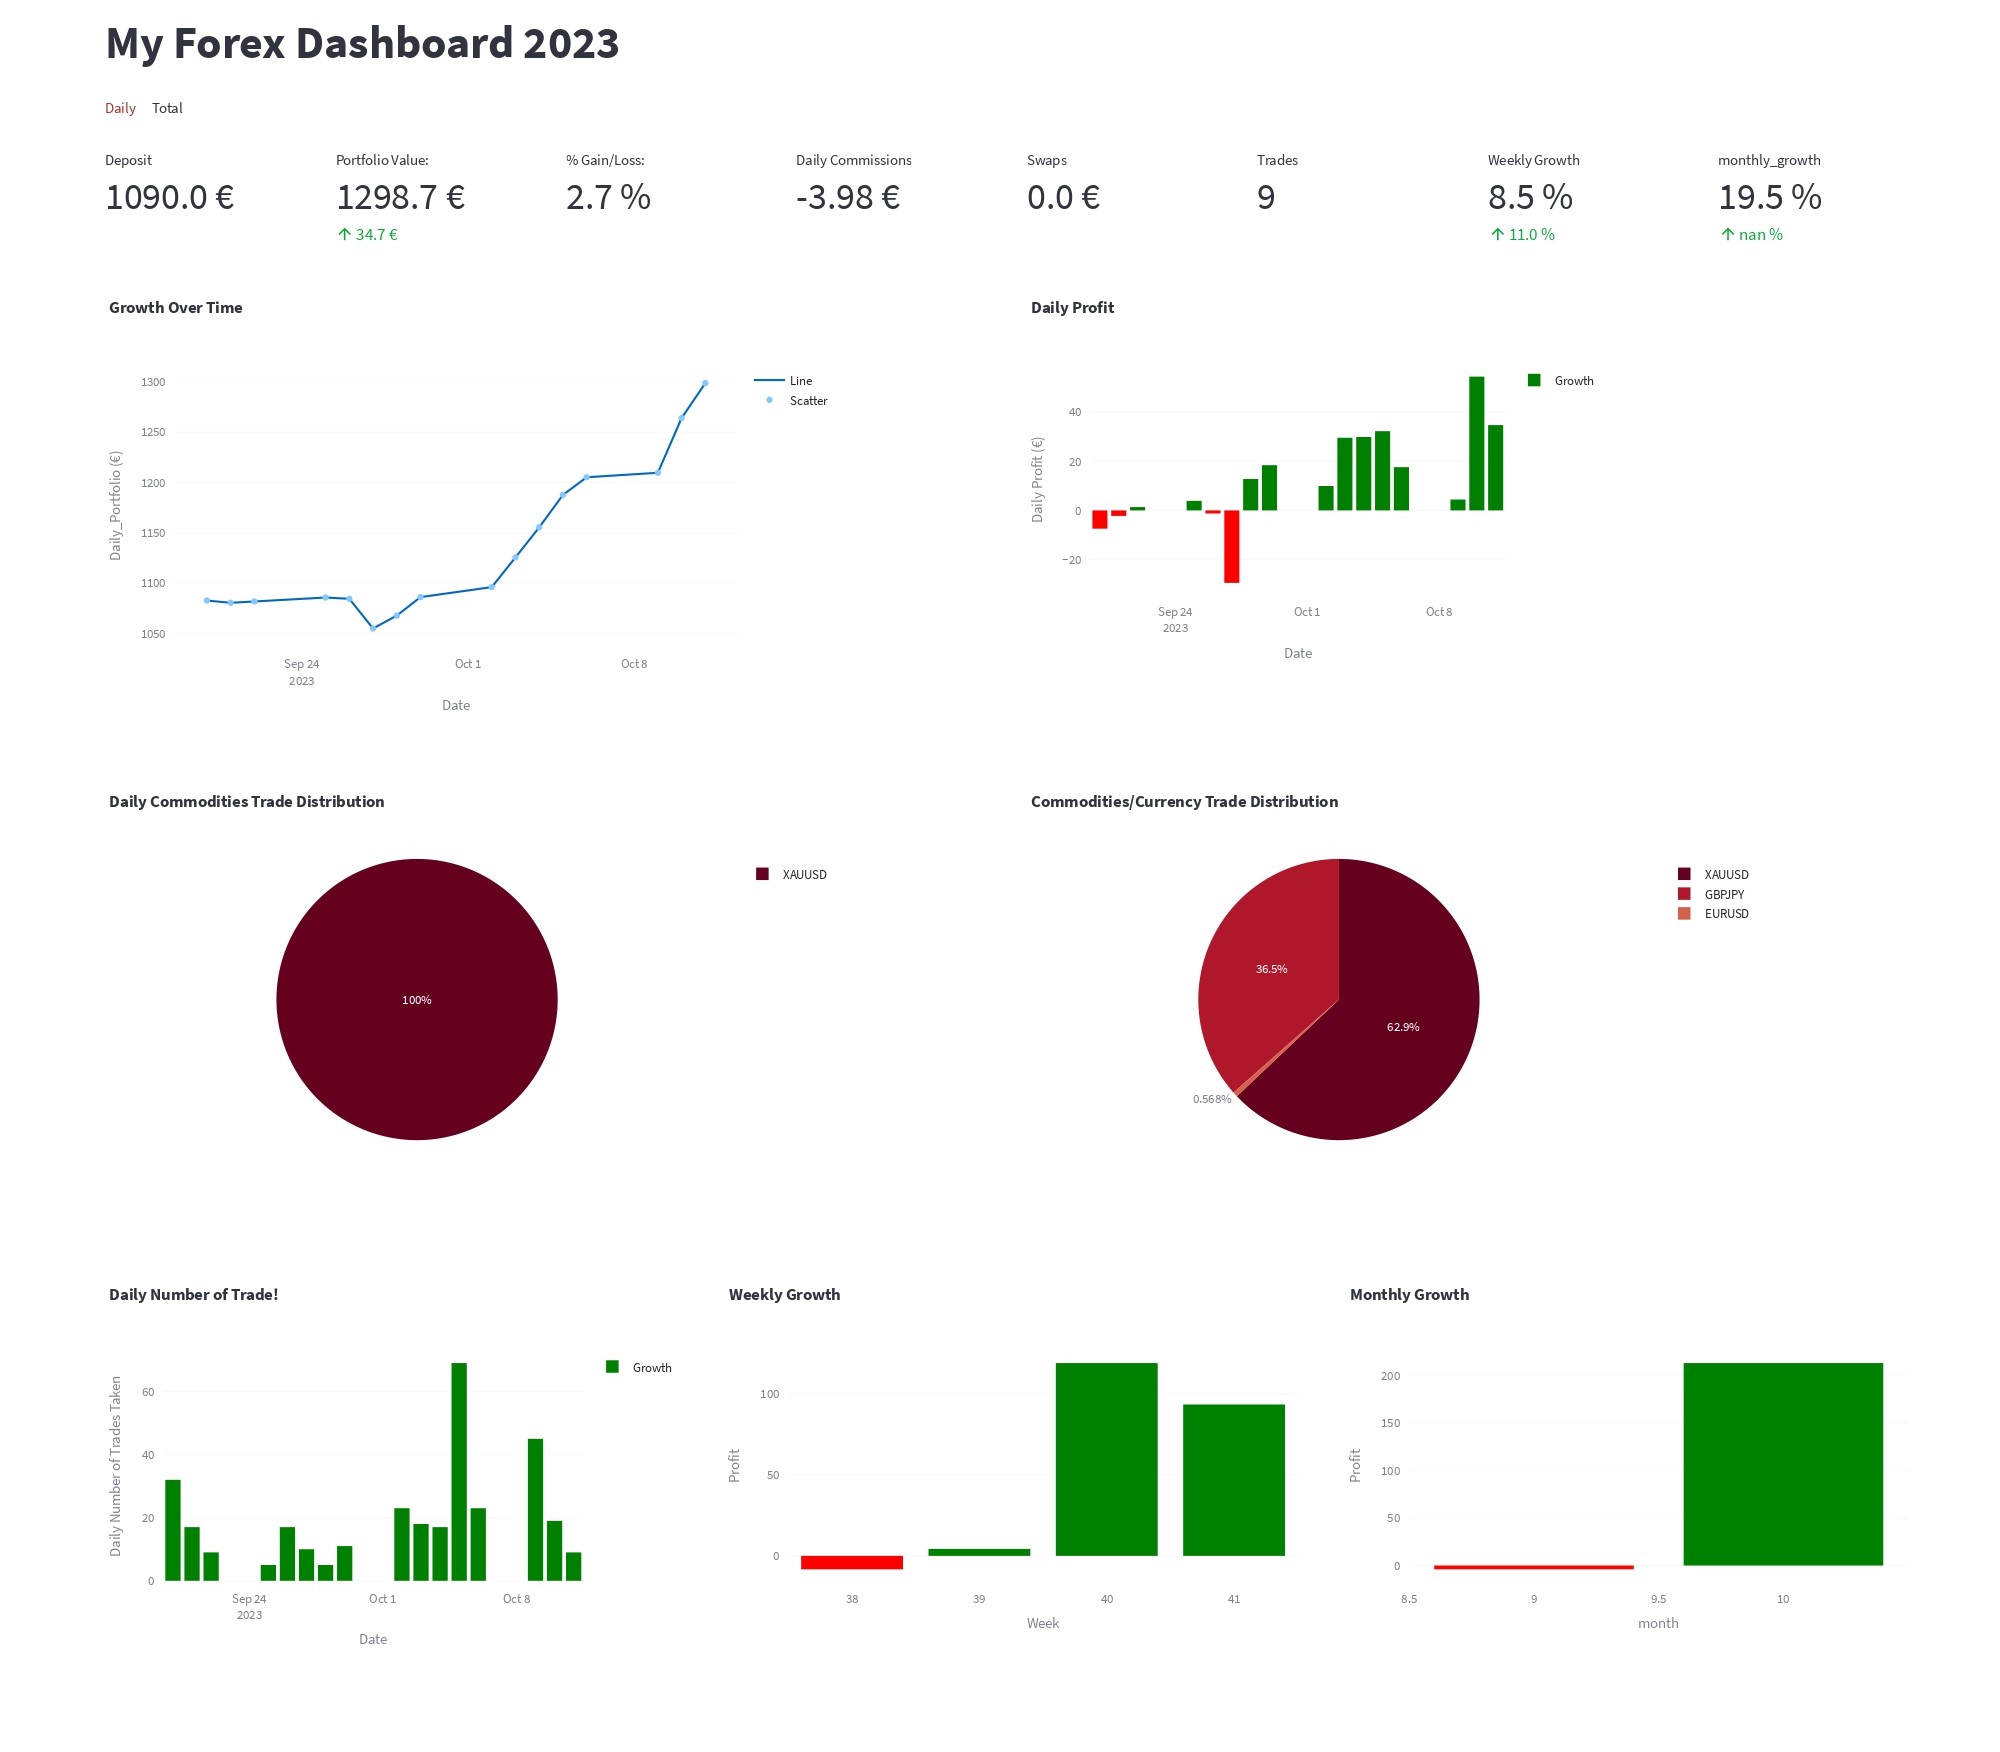
Forex Dashboard is a comprehensive tool designed for Forex traders to monitor and analyze their trading performance metrics. By seamlessly integrating with the MT5 terminal on Windows, the tool extracts trading deals, processes the data, and presents it in a user-friendly dashboard using Streamlit. This dashboard provides traders with insights into their daily wins, traded commodities, profit margins, and overall growth percentages.
Also, you can read on Medium : Introducing Forex Dashboard: A Comprehensive Tool for Forex Traders
Features
- ETL Process: Extracts trading data from the MT5 terminal, transforms it for analysis, and loads it into a CSV file.
- Streamlit Dashboard: Displays key performance metrics, including:
- Daily wins and losses.
- Traded commodities breakdown.
- Profit gains and losses.
- Daily and overall portfolio growth.
- Commissions paid.
- Daily and Total Trades executed.
- Weekly and Monthly gains.
Prerequisites
- Operating System: Windows (Tested on Windows 11)
- MT5 terminal installed on a Windows machine MT5 Downloads.
- Python >= 3.11 environment with necessary packages.
Setup and Usage
-
Create a Conda Environment:
conda create --name <env_name> python=3.11
-
Clone the Repository:
pip install fx_analytics
pip install MetaTrader5 -> required to access MT5 for your historical trade deals!
-
To extract all your historical trades data from MT5 Terminal:
import fx_analytics
from fx_analytics.main_functions import ETL


# replace '****' with your login credential from MT5 terminal!
mt5_credentials = {'login': '******', 'server':'******','password':'******'}
df = ETL(from_date='2023-09-01', mt5_credentials = mt5_credentials)
print(df)
-
To use/test the streamlit app from the package: To test app you can download the example data which was extracted from MT5, download data.
- Copy the below code into .py file
import fx_analytics
from fx_analytics.app import main

main('fx_history.csv')
To Run this file from CLI:
streamlit run {file_name.py}
-
To run both ETL to extract your data from MT5 and view the analytics streamlit dashboard
- create a python script 'app.py' and copy and past the below code, change the 'from_date' with your desired date and 'data_file_path', where you choose to stores the data extracted from ETL function, I prefer to use a data folder eg: 'data/{file_name.csv}'
import fx_analytics
from fx_analytics.app import main
from fx_analytics.main_functions import ETL

# replace '****' with your login credential from MT5 terminal!
mt5_credentials = {'login': '******', 'server':'******','password':'******'}
df = ETL(from_date='2023-09-28', mt5_credentials = mt5_credentials)
df.to_csv('data_file_path')
main('data_file_path')
To Run this file from CLI:
streamlit run app.py
Output
- streamlit app preview:
Feedback and Contribution
- We welcome feedback and contributions! If you encounter any issues or have suggestions, please open an issue. If you'd like to contribute, please create a pull request.
Release history Release notifications | RSS feed


Download files
Download the file for your platform. If you're not sure which to choose, learn more about installing packages.
Source Distribution
Built Distribution
Filter files by name, interpreter, ABI, and platform.
If you're not sure about the file name format, learn more about wheel file names.
Copy a direct link to the current filters
File details
Details for the file fx_analytics-1.6.5.tar.gz.
File metadata
- Download URL: fx_analytics-1.6.5.tar.gz
- Upload date:
- Size: 13.9 kB
- Tags: Source
- Uploaded using Trusted Publishing? No
- Uploaded via: twine/4.0.2 CPython/3.11.7
File hashes
| Algorithm | Hash digest | |
|---|---|---|
| SHA256 |
db0b87363481f35d5b4a69d94c7b1c3f605246709877a608bdf8e290d282484f
|
|
| MD5 |
b4eafaf95d96b4bfce00ff4af2e2793f
|
|
| BLAKE2b-256 |
84cf6ca5ae7b70c2ec73e9af989bfdb55fe7339e611c8240c4eceea505e5c6c8
|
File details
Details for the file fx_analytics-1.6.5-py3-none-any.whl.
File metadata
- Download URL: fx_analytics-1.6.5-py3-none-any.whl
- Upload date:
- Size: 13.8 kB
- Tags: Python 3
- Uploaded using Trusted Publishing? No
- Uploaded via: twine/4.0.2 CPython/3.11.7
File hashes
| Algorithm | Hash digest | |
|---|---|---|
| SHA256 |
aba91645a8b2ae03763a199ce508966f05fe6f79e90e834014f0a8562b8da3a3
|
|
| MD5 |
4ca83b2d336eefe7f74695fbc30b9187
|
|
| BLAKE2b-256 |
e272a862e713a5f114f547fa0c841432b913580becd0e93abd07dd665e629567
|


