
gcmon - zero-overhead GC monitoring for Python







gcmon watches a running Python process's garbage collector from outside the process — no code changes, no callbacks, no in-process overhead. Export to Chrome Trace, Perfetto, or JSONL; query with PerfettoSQL.
Requires CPython 3.15+ for the monitored process and the
gcmonprocess, built from the same source. See Limitations for details.
Why gcmon?
Python's garbage collector can introduce unpredictable pauses in
applications. The standard library provides gc.get_stats() for
aggregate collection counters and gc.callbacks for per-event hooks,
but both run inside the target process: callbacks add execution
overhead that distorts timing, while gc.get_stats() only exposes
cumulative counters with no per-pause resolution. Neither can monitor
a process without modifying its code.
Most monitoring tools report the GC collection count, how often the collector ran. What hurts a latency-sensitive service is GC pause time, how long each collection held it up, and reporting that requires a source inside CPython's own GC bookkeeping. See Alternatives Comparison for what each tool reports.
gcmon reads GC statistics directly from a target process's memory using platform-specific memory access APIs. The target process is never paused (GC statistics are written to a ring buffer and read as a whole), so there is zero in-process overhead and no code changes required.
Use it to profile GC pause times, compare live-object count and RSS trends, or integrate GC metrics into benchmarks.
Features
- Real-time GC monitoring - Track garbage collection events in running Python processes without in-process overhead
- Multiple export formats - Chrome Trace Event, Perfetto binary protobuf, JSONL file, and JSONL to stdout (formats)
- CLI - Monitor processes or run scripts with GC monitoring (usage)
- RSS tracking - Track Resident Set Size of monitored processes in Chrome and Perfetto traces (details)
- Pyperf hook integration - Seamlessly integrate with pyperf benchmarks (pyperf hook)
When to Use
Use gcmon when you want to:
- Profile GC pause times in production or staging without modifying application code
- Measure GC impact on latency-sensitive services (APIs, real-time systems)
- Correlate GC activity with benchmark results via the pyperf hook
- Track live object count trends over time across running processes
- Debug intermittent latency spikes suspected to be GC-related
Use something else when you need to:
- Find which code paths trigger collections — use
profiling.sampling, oraustinwith-gon interpreters older than 3.15 (statistical, no per-pause timing or heap data) - In-process GC callbacks (e.g., triggering actions on collection) — use
gc.callbacks - Cumulative collection counters without per-pause detail — use
gc.get_stats() - Monitor across different Python builds — gcmon requires the exact same binary (see Limitations)
Alternatives Comparison
| Tool | GC Pause Time | Code Changes | Overhead | Best Use Case |
|---|---|---|---|---|
| gcmon¹ | Yes — exact | None | Zero in-process | Production GC monitoring |
profiling.sampling², austin |
Partial³ | None | Near-zero in-process | Which code triggers GC |
gc.callbacks |
Yes — exact | High (custom code) | Moderate (Python call) | Custom metrics pipelines |
gc.get_stats() |
No — cumulative only | Minimal | Minimal | Basic counters |
| APM agents (Datadog, New Relic, Dynatrace) | Varies⁴ | Agent required | Moderate | Distributed tracing |
| OpenTelemetry runtime metrics | No — counts only⁵ | Wrapper or SDK | Low | Fleet-wide GC counters |
¹ Requires CPython 3.15+ on both sides, built from the same source. See Limitations.
² Stdlib from CPython 3.15 on; austin covers older interpreters.
³ Both mark the samples taken during a collection (<GC> frames, austin's
-g), which gives GC as a share of samples and the stacks behind it, but no
per-pause durations and no heap data.
⁴ Datadog and New Relic ship theirs off by default: Datadog reports
per-generation collection counts, New Relic per-generation pause time via
gc.callbacks. Dynatrace collects GC activity per generation.
⁵ Reports collection counts (cpython.gc.collections and friends), not durations.
Platforms that bundle OTel, Odigos among them, forward the same counters.
eBPF sensors such as Groundcover's watch kernel events, not CPython's GC phases.
Exact GC pause time has only two sources:
gc.callbacksinside the process, whether your own or an agent's, and_remote_debugging.get_gc_stats()reading CPython's ring buffer from outside it. Everything else samples or counts. gcmon builds on the latter.
Decision Guide
GC pauses — My service stalls and I suspect the collector. → Run gcmon against the PID for exact per-pause timings.
GC origin — I know collections are costly, but not what triggers them.
→ Sample the process with profiling.sampling and read its <GC> frames.
How It Works
gcmon runs outside the target process. It reads GC statistics directly from the process's memory using platform-specific memory access APIs (available in CPython 3.15+). How gcmon reads a process covers the polling loop, what it misses, and what it recovers.
For the pyperf hook integration, gcmon uses an external process model:
- The hook spawns the
gcmonCLI as a separate process - The external process reads the target process memory directly
- Results are written to a temporary JSON file
- The hook reads the JSON and injects metrics into pyperf metadata
This provides zero in-process overhead during benchmarks, crash isolation (gcmon crashes don't affect the target), and clean separation of concerns.
Limitations
Same Python version and build
The monitoring and monitored processes must use the exact same Python version
and build. gcmon reads GC statistics directly from the target process's
in-memory data structures, and the layout of these structures varies between
Python versions and build configurations (fields, offsets, sizes). Mismatched
binaries are rejected by the Python runtime to prevent undefined behavior or
crashes.
In practice, run both processes from the same virtualenv, container image, or
pyenv/uv environment so they share a single Python binary.
Sub-step breakdown requires a custom build
The per-phase GC breakdown visible in the screenshot below — Mark Alive, Fill increment, Deduce Unreachable, and the fields that accompany it — is only produced when the monitored process runs a CPython build with enhanced GC instrumentation. Standard CPython builds give you the top-level GC Pause slices and counter data only. See Output formats for which fields need which build.
Not every GC run is read
CPython writes one record per finished GC run into a small fixed ring buffer, so a target whose collector runs more often than gcmon polls loses records before any poll reads them. A GC-heavy workload at default settings can sit there for most of a run.
gcmon reconstructs what it missed from CPython's cumulative counters, so Count
and Sum in the --stats table cover every run, read or not, and the Cov
column reports what share gcmon read. Percentiles are not corrected and read
high. The trace draws each blind interval on a GC Loss track. See
How gcmon reads a process
for the mechanism and
Statistics
for how to read a low-coverage table.
No call-stack attribution
gcmon reports when each GC run happened, how long it took, and how large the heap was, plus a per-phase breakdown on a custom CPython build with enhanced GC instrumentation (see above). It cannot tell you which code triggered the run, because the GC records carry no stack information. A sampler answers that question, so the two pair well: see Alternatives Comparison.
No OS-level memory pressure
gcmon reports the collector's view of the heap, plus RSS samples when --rss is
enabled. Neither is a measure of OS-level memory pressure. Use psutil,
Prometheus node exporters, or eBPF tooling for that.
Requirements
- Python: CPython 3.15 or newer is required for both the monitoring and the monitored process.
- Operating systems: Linux, macOS, and Windows are supported (the test
matrix runs on
ubuntu-latest,macos-latest, andwindows-latest). - Process access: gcmon reads another process's memory using platform-specific APIs. On Linux and Windows no extra setup is needed. On macOS, the calling process must be authorized to read the target process memory.
Installation
pip install gcmon

# With optional extras
pip install gcmon[stats]      # High-accuracy statistics (see docs/statistics.md)
pip install gcmon[cmdline]    # Process command line and RSS tracking (see docs/rss.md)
pip install gcmon[stats,cmdline]  # Both extras
[stats] installs DDSketch for
high-accuracy, memory-efficient percentiles — see
Statistics.
[cmdline] installs psutil, which
populates process command lines in Perfetto traces and enables --rss — see
RSS Tracking.
Each extra degrades gracefully when absent; no other trace data is affected.
Quick Start
# Monitor a running process by PID (default Chrome Trace format)
gcmon 12345

# Run a Python script with GC monitoring
gcmon run -s my_script.py

# Monitor with custom output and statistics output
gcmon 12345 -o trace.json --stats

# Perfetto binary output with RSS tracking
gcmon 12345 --format perfetto -o trace.pftrace --rss

# Combine multiple traces (e.g. different runs or builds) into a single file
gcmon combine trace1.json trace2.json -o combined.json -n
Example: Chrome Trace Output
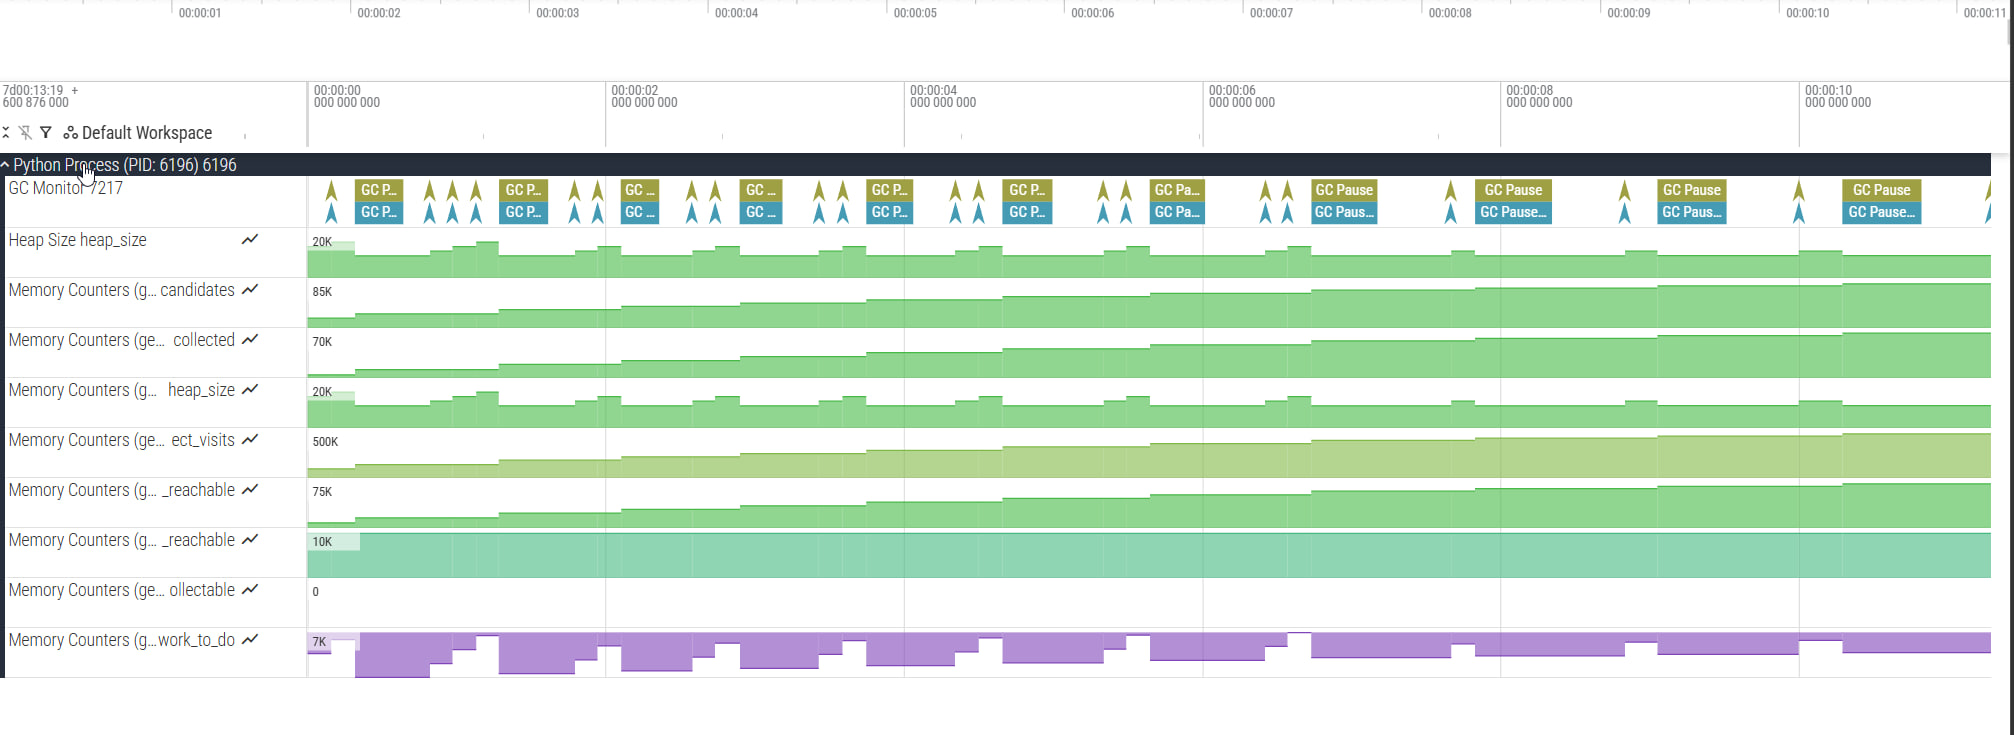
GC monitoring data visualized in Perfetto UI:
- GC Pause slices with sub-step breakdown, and per-gen
G{gen}counter tracks - A shared
heap_sizecounter and aProcesseslifetime track - An
rsscounter track per PID (when--rssis enabled)
See Output formats for the full track inventory and the JSONL event schema.
See Also
The tools weighed in Alternatives Comparison, and the viewer gcmon writes for:
profiling.sampling— stdlib statistical profiler, Tachyon (out-of-process,<GC>frames but no per-pause timing)austin— sampling CPU/memory profiler (out-of-process,-gtags GC samples on interpreters older than 3.15)gc.callbacks— in-process hook, the other exact source of pause timegc.get_stats()— cumulative per-generation counters, no per-pause detail- OpenTelemetry runtime metrics — fleet-wide GC collection counts
- Perfetto UI — the trace viewer used by gcmon's Perfetto exporter
Project documentation
- gcmon documentation — CLI reference, output formats, statistics, RSS tracking, the pyperf hook, programmatic control, Perfetto SQL, architecture decision records, and the release process
License
MIT License - see LICENSE for details.
Contributing
Bug reports and pull requests are welcome at GitHub.
1 maintainer

Download files
Download the file for your platform. If you're not sure which to choose, learn more about installing packages.
Source Distribution
Built Distribution
Filter files by name, interpreter, ABI, and platform.
If you're not sure about the file name format, learn more about wheel file names.
Copy a direct link to the current filters
File details
Details for the file gcmon-0.5.0.tar.gz.
File metadata
- Download URL: gcmon-0.5.0.tar.gz
- Upload date:
- Size: 69.7 kB
- Tags: Source
- Uploaded using Trusted Publishing? Yes
- Uploaded via:
twine/7.0.0 CPython/3.13.14
File hashes
| Algorithm | Hash digest | |
|---|---|---|
| SHA256 |
e5a0ecf5d0ae21e5bc48c0bf28e3b6a6fa8c14ffcbdee775570d578779a8e5e1
|
|
| MD5 |
2b20ac59787a11f99a1a033401bf5371
|
|
| BLAKE2b-256 |
6a7e26c5b86a6cc419662eab47a847130c6dc660d3b0ac74ee24385d59658bee
|
Provenance
The following attestation bundles were made for gcmon-0.5.0.tar.gz:
Publisher:
release.yml on sergey-miryanov/gcmon
-
Statement:
-
Statement type:
https://in-toto.io/Statement/v1 -
Predicate type:
https://docs.pypi.org/attestations/publish/v1 -
Subject name:
gcmon-0.5.0.tar.gz -
Subject digest:
e5a0ecf5d0ae21e5bc48c0bf28e3b6a6fa8c14ffcbdee775570d578779a8e5e1 - Sigstore transparency entry: 2464553279
- Sigstore integration time:
-
Permalink:
sergey-miryanov/gcmon@90f1df28a6faca0b2e80f60cfe350f07a0b41786 -
Branch / Tag:
refs/tags/v0.5.0 - Owner: https://github.com/sergey-miryanov
-
Access:
public
-
Token Issuer:
https://token.actions.githubusercontent.com -
Runner Environment:
github-hosted -
Publication workflow:
release.yml@90f1df28a6faca0b2e80f60cfe350f07a0b41786 -
Trigger Event:
push
-
Statement type:
File details
Details for the file gcmon-0.5.0-py3-none-any.whl.
File metadata
- Download URL: gcmon-0.5.0-py3-none-any.whl
- Upload date:
- Size: 84.8 kB
- Tags: Python 3
- Uploaded using Trusted Publishing? Yes
- Uploaded via:
twine/7.0.0 CPython/3.13.14
File hashes
| Algorithm | Hash digest | |
|---|---|---|
| SHA256 |
195ccf7dfa9898b624eeb8a990b024e257c575c2ac8beb6b1821cbaa2078bee7
|
|
| MD5 |
3128a96f098ebae15ca6bf9f6190320b
|
|
| BLAKE2b-256 |
eb63627bbbf21d5d05d0e107e4ef4c13cfa453e17800bc3e8de1022f76d54f87
|
Provenance
The following attestation bundles were made for gcmon-0.5.0-py3-none-any.whl:
Publisher:
release.yml on sergey-miryanov/gcmon
-
Statement:
-
Statement type:
https://in-toto.io/Statement/v1 -
Predicate type:
https://docs.pypi.org/attestations/publish/v1 -
Subject name:
gcmon-0.5.0-py3-none-any.whl -
Subject digest:
195ccf7dfa9898b624eeb8a990b024e257c575c2ac8beb6b1821cbaa2078bee7 - Sigstore transparency entry: 2464553967
- Sigstore integration time:
-
Permalink:
sergey-miryanov/gcmon@90f1df28a6faca0b2e80f60cfe350f07a0b41786 -
Branch / Tag:
refs/tags/v0.5.0 - Owner: https://github.com/sergey-miryanov
-
Access:
public
-
Token Issuer:
https://token.actions.githubusercontent.com -
Runner Environment:
github-hosted -
Publication workflow:
release.yml@90f1df28a6faca0b2e80f60cfe350f07a0b41786 -
Trigger Event:
push
-
Statement type:














