A Python library for creating 2D plotter art using GCode

Project description


Introduction
G-Code wrapper to generate G-Code for 2D plotter art. Add paths, points, lines, circles, and more and get G-Code instructions to send to your 2D Plotter or converted 3D Printer.
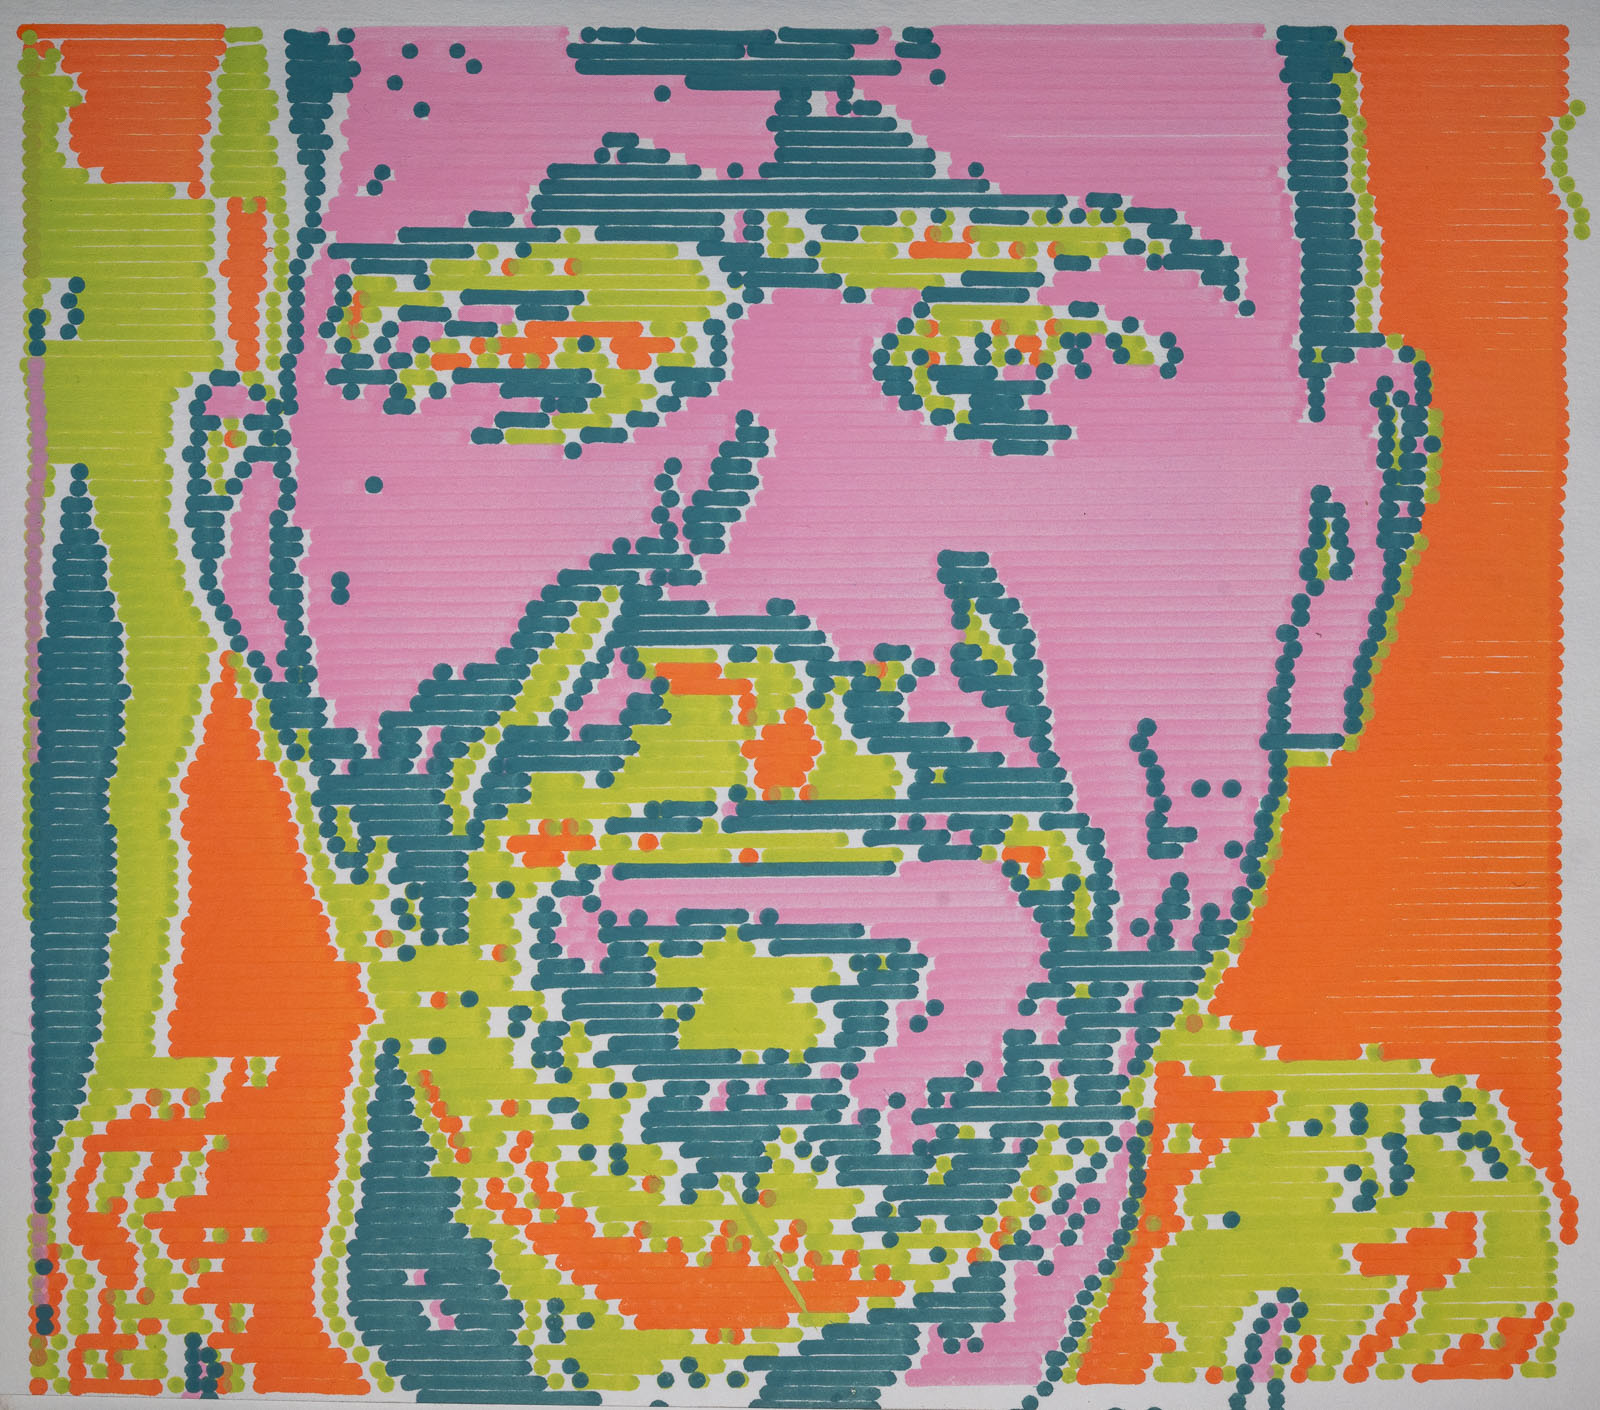
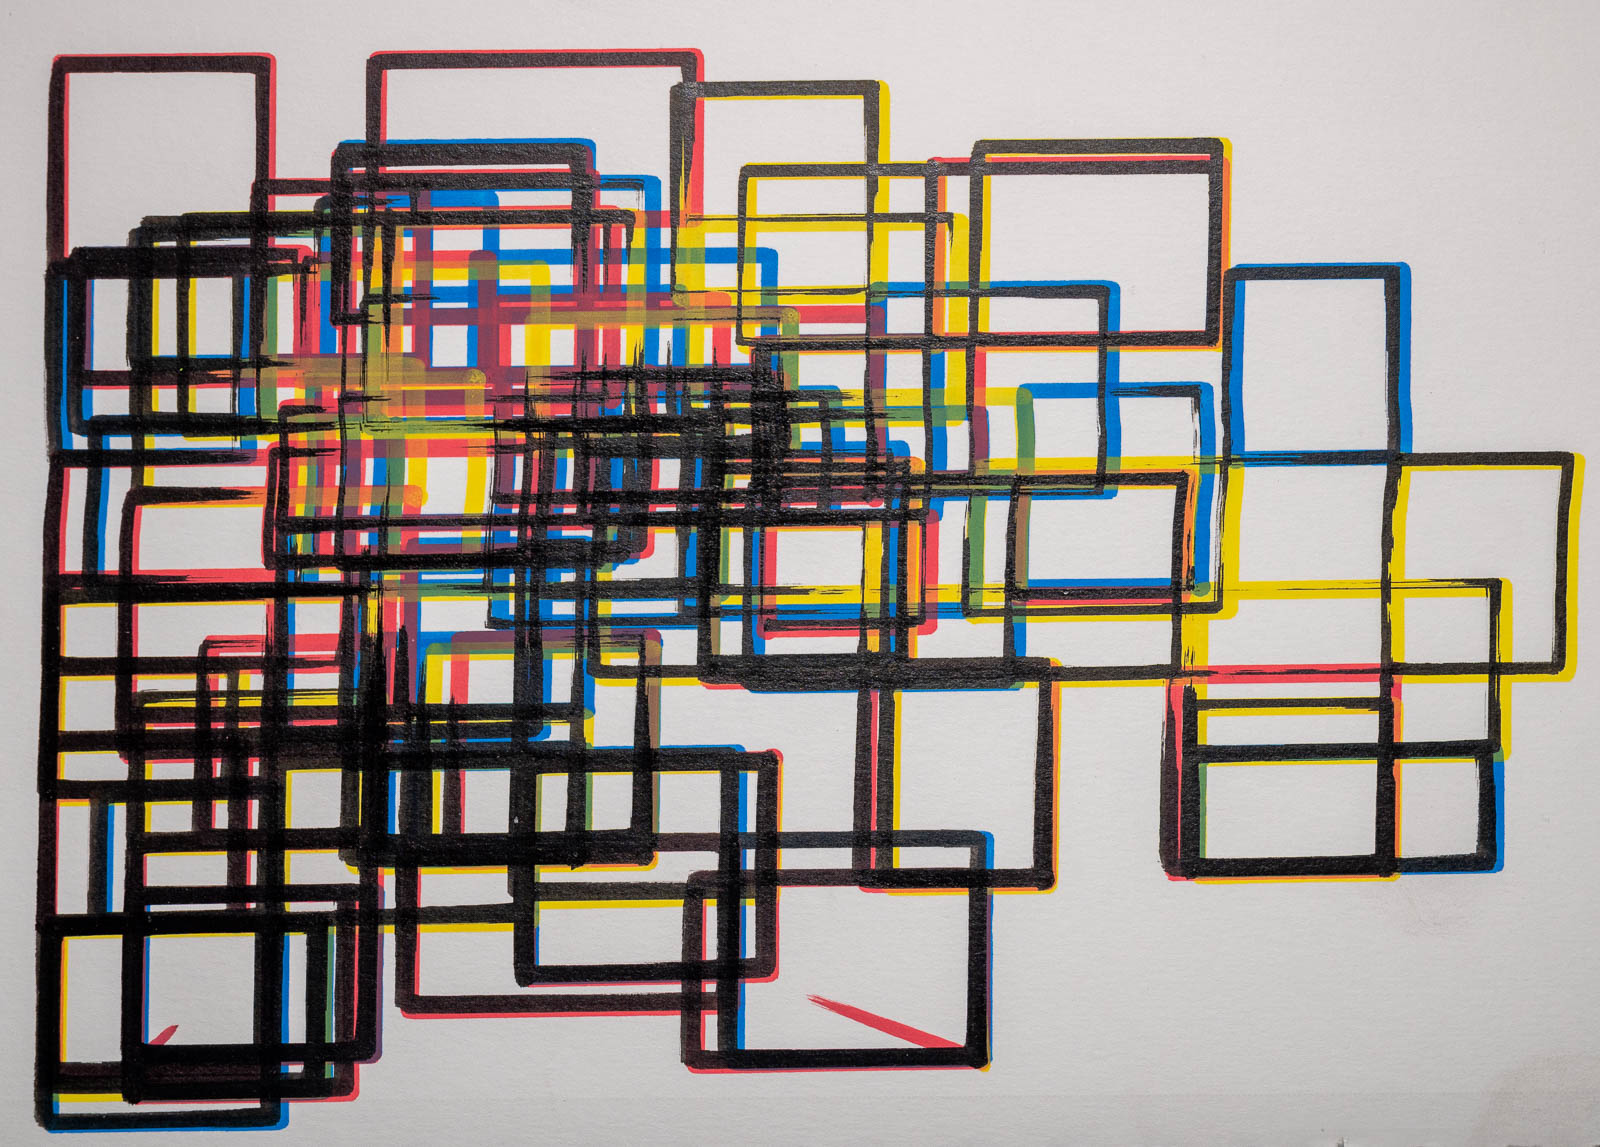
Here are a few examples of what's been made with this library.
Quick Start
Below is a quick start example to get you up and running. For a quick start, gallery, and documentation, . check out the website.
from gcode2dplotterart import Plotter2D # Change to `Plotter3D` if using a converted 3D printer.

plotter = Plotter2D(
    # Specify the dimensions of your plotter
    x_min=0,
    x_max=200,
    y_min=0,
    y_max=200,
    feed_rate=10000,
    # G-Code files are located in `output_directory/title/layer.gcode`
    title="Plotter2D Quickstart",
    output_directory="./output",
    # Give a warning if a plotted point is outside the plotting device's dimensions.
    handle_out_of_bounds="Warning",
)

# Setup a layer per plotting instrument used
black_pen_layer = "black_pen_layer"
blue_marker_layer = "blue_marker_layer"
green_marker_layer = "green_marker_layer"

# Create the layers
plotter.add_layer(black_pen_layer, color="black", line_width=1.0)
plotter.add_layer(blue_marker_layer, color="blue", line_width=4.0)
plotter.add_layer(green_marker_layer, color="#027F00", line_width=4.0)

# Add some dots, lines, shapes, and paths.
plotter.layers[black_pen_layer].add_rectangle(
    x_start=10, y_start=15, x_end=40, y_end=50
)
plotter.layers[black_pen_layer].add_point(x=30, y=40)
plotter.layers[blue_marker_layer].add_circle(x_center=10, y_center=30, radius=10)
plotter.layers[blue_marker_layer].add_rectangle(x_start=50, y_start=50, x_end=75, y_end=75)
plotter.layers[green_marker_layer].add_path([(10, 10), (20, 25), (30, 15), (1, 100)])
plotter.layers[green_marker_layer].add_line(x_start=70, y_start=80, x_end=70, y_end=15)

# Generate a graphical preview to get a rough idea of what will be plotted.
plotter.preview()

# Output creation to G-Code files to be used in plotting.
plotter.save()
Changelog
Release history Release notifications | RSS feed


Download files
Download the file for your platform. If you're not sure which to choose, learn more about installing packages.
Source Distribution
Built Distribution
Filter files by name, interpreter, ABI, and platform.
If you're not sure about the file name format, learn more about wheel file names.
Copy a direct link to the current filters
File details
Details for the file gcode2dplotterart-2.0.3.tar.gz.
File metadata
- Download URL: gcode2dplotterart-2.0.3.tar.gz
- Upload date:
- Size: 16.3 kB
- Tags: Source
- Uploaded using Trusted Publishing? No
- Uploaded via: twine/6.1.0 CPython/3.13.1
File hashes
| Algorithm | Hash digest | |
|---|---|---|
| SHA256 |
34cc6884218778564e9298a4247bf88d6c82813757e803846ac88dda7985404a
|
|
| MD5 |
0d106510b91ddd29e111c5b2b9e367e6
|
|
| BLAKE2b-256 |
fafb55896f6ca23ec66630e3b7c27ea31c8b753f3f1a5df02538ddacc480a704
|
File details
Details for the file gcode2dplotterart-2.0.3-py3-none-any.whl.
File metadata
- Download URL: gcode2dplotterart-2.0.3-py3-none-any.whl
- Upload date:
- Size: 25.2 kB
- Tags: Python 3
- Uploaded using Trusted Publishing? No
- Uploaded via: twine/6.1.0 CPython/3.13.1
File hashes
| Algorithm | Hash digest | |
|---|---|---|
| SHA256 |
27b7572ce633422f26fc6cc2f95b1213dc8154684d00c723c025e682db1b9942
|
|
| MD5 |
96f5efe0a664fe5371228fc1bf39f509
|
|
| BLAKE2b-256 |
560f4e0dc2de8c67753c0dcbd24937509ae96096ad9e8e638e9cedd9120dd1ae
|


