
Metrics for nucleotide-level gene-calling benchmarking

Project description
Gene Calling Benchmark

Diagnostic evaluation toolkit for nucleotide-level gene callers (gene finders like Augustus, Helixer, Tiberius, SegmentNT) against reference annotations (e.g., GENCODE).
Goes beyond standard precision/recall with an 8-type INDEL error taxonomy, boundary bias/reliability landscapes, strict intron chain plus per-transcript exon recovery distributions, transcript match classification, and state transition analysis -- metrics not available in gffcompare, Mikado, or EGASP.
Two ways to use it:
- Live diagnostics while you train — stream the full diagnostic suite to Weights & Biases per epoch: curated scalars, per-transcript histograms, and GIF videos that show each diagnostic evolving across training.
- Compare finished gene-caller outputs — point it at GFF/GTF files and get a head-to-head figure bundle, plus a gffcompare-compatible baseline layer for continuity with existing tooling.
pip install gene-calling-benchmark
Live Training Diagnostics (W&B)
If your model already emits integer label arrays, hand them to benchmark_from_arrays
and log the result to W&B — scalars every epoch, figures and GIF videos whenever you want them.
from gene_calling_benchmark import (
    BEND_LABEL_CONFIG, EvalMetrics, benchmark_from_arrays,
    init_wandb_with_presets, log_benchmark_scalars,
    log_benchmark_histograms, log_benchmark_media, log_benchmark_media_videos,
)

run = init_wandb_with_presets(project="gene-benchmark", run_name="validation")

for epoch in range(n_epochs):
    # ... train ...
    results = benchmark_from_arrays(
        gt_labels=gt_arrays,       # list[np.ndarray]
        pred_labels=pred_arrays,   # list[np.ndarray]
        label_config=BEND_LABEL_CONFIG,
        metrics=[
            EvalMetrics.REGION_DISCOVERY,
            EvalMetrics.BOUNDARY_EXACTNESS,
            EvalMetrics.STRUCTURAL_COHERENCE,
        ],
        infer_introns=True,
    )
    log_benchmark_scalars(results, step=epoch, method_prefix="val")      # curated high-signal subset
    log_benchmark_histograms(results, step=epoch, method_prefix="val")   # per-transcript distributions
    log_benchmark_media(results, BEND_LABEL_CONFIG, step=epoch, method_prefix="val")  # figures

log_benchmark_media_videos()  # flush the buffered figure history as GIF videos
run.finish()
log_benchmark_scalars logs a curated subset; use log_benchmark_all_scalars for every
numeric scalar. See the
online logging guide
for the exact key list and the media/video buffer contract.
Note:
benchmark_from_arraystops out at ~1000 transcript pairs/second, so on a large validation set run it off the critical GPU training thread and let it log asynchronously.
Install the extra with: pip install gene-calling-benchmark[wandb]
Compare Gene-Caller Files (GFF/GTF)
Point the pipeline at a ground-truth annotation and one or more prediction files; it parses,
pairs transcripts, builds the label arrays, runs the metrics, and — via
compare_multiple_predictions — renders a head-to-head figure bundle.
from gene_calling_benchmark import (
    AnnotationMode, LabelConfig, EvalMetrics, benchmark_from_gff, compare_multiple_predictions,
)

label_config = LabelConfig(
    annotation_mode=AnnotationMode.EXON_INTRON,
    background_label=8,
    exon_label=0,
    intron_label=2,
)

results = benchmark_from_gff(
    gt_path="ground_truth.gtf",
    pred_paths={"augustus": "augustus.gff", "helixer": "helixer.gff"},
    label_config=label_config,
    metrics=[EvalMetrics.REGION_DISCOVERY, EvalMetrics.BOUNDARY_EXACTNESS, EvalMetrics.NUCLEOTIDE_CLASSIFICATION],
    exclude_features=["gene"],
)

figures = compare_multiple_predictions(
    per_method_benchmark_res=results,
    label_config=label_config,
    metrics_to_eval=[EvalMetrics.REGION_DISCOVERY, EvalMetrics.BOUNDARY_EXACTNESS, EvalMetrics.NUCLEOTIDE_CLASSIFICATION],
)
For continuity with existing tooling, each predictor's global results also carry a
gffcompare-compatible baseline layer (nucleotide / exon / transcript / gene sensitivity &
precision); the diagnostics above are the value this toolkit adds on top of that baseline.
CLI
gene-benchmark run \
    --gt ground_truth.gtf \
    --pred augustus:predictions.gff \
    --config label_config.yaml \
    --exclude-features gene \
    --output results.json
Generate a starter label_config.yaml with gene-benchmark init-config
(--mode exon_intron or --mode utr_cds_intron).
Metrics
Seven scored metric groups, each answering a distinct question about prediction
quality (plus opt-in STATE_TRANSITIONS, described below):
| Group | Question |
|---|---|
NUCLEOTIDE_CLASSIFICATION |
Per-base, how accurate is it? |
REGION_DISCOVERY |
Did we find the right regions? |
BOUNDARY_EXACTNESS |
How precise are the boundaries? |
INDEL |
What structural errors exist? |
PHASE_DRIFT |
Is the coding-base phase preserved? |
STRUCTURAL_COHERENCE |
Is the overall segment arrangement correct? |
DIAGNOSTIC_DEPTH |
Why is the prediction structurally wrong? |
Nucleotide Classification
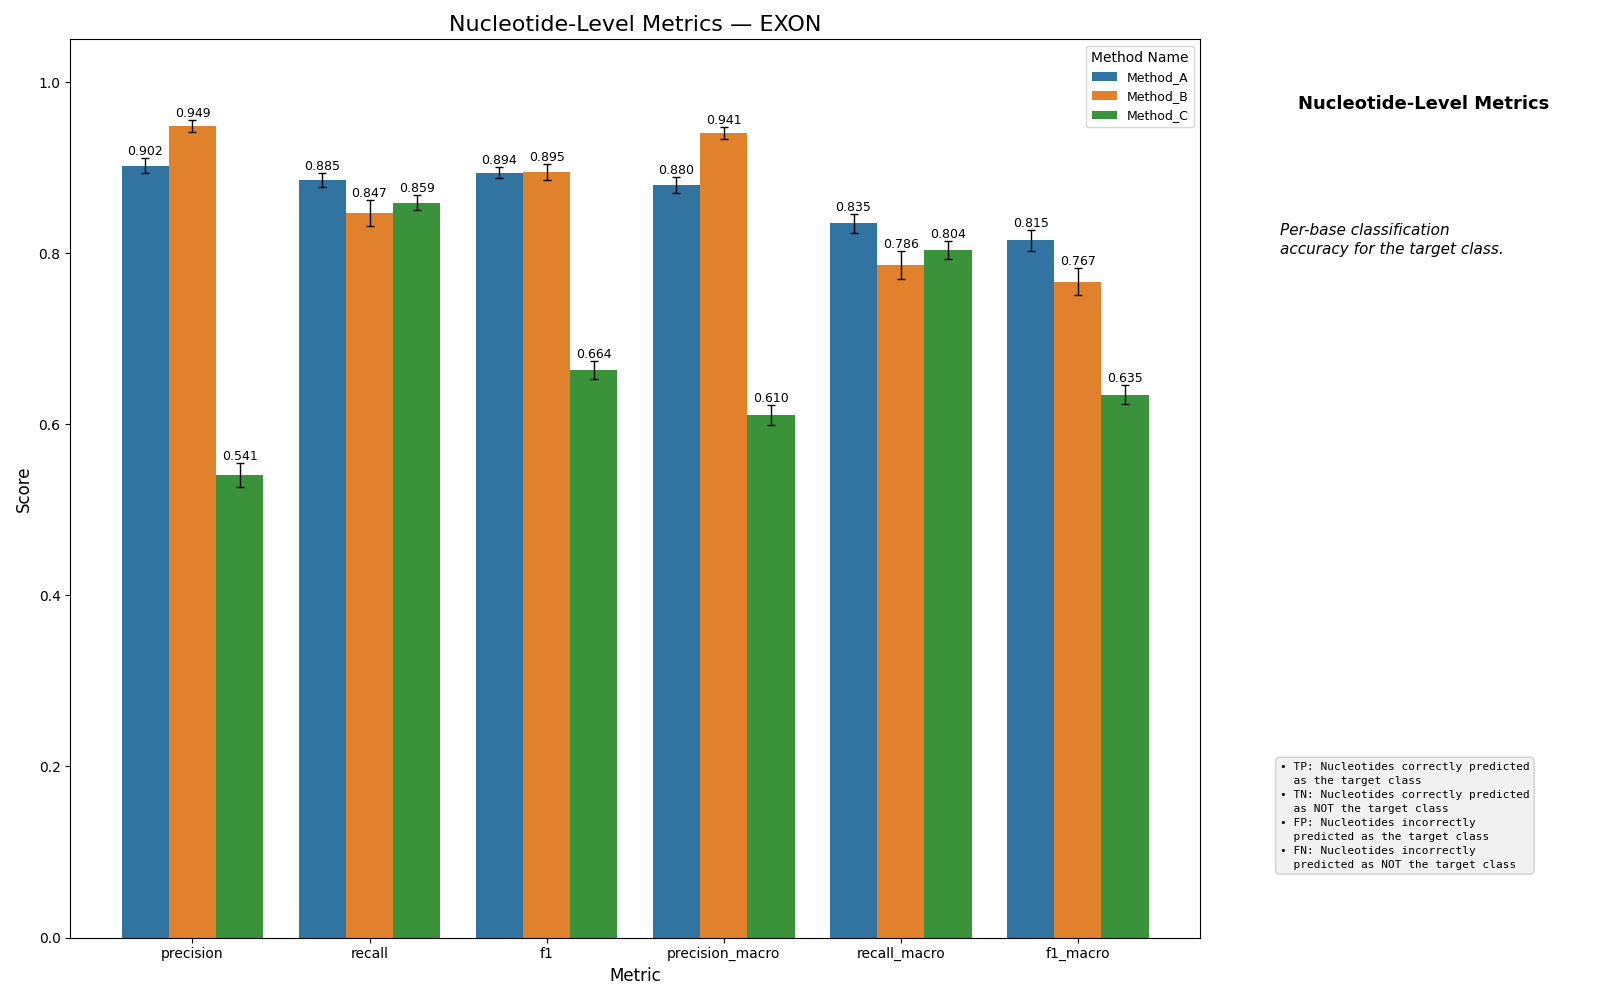
Per-base TP/TN/FP/FN with precision, recall, and F1. The most basic metric -- treats each position independently.
Region Discovery
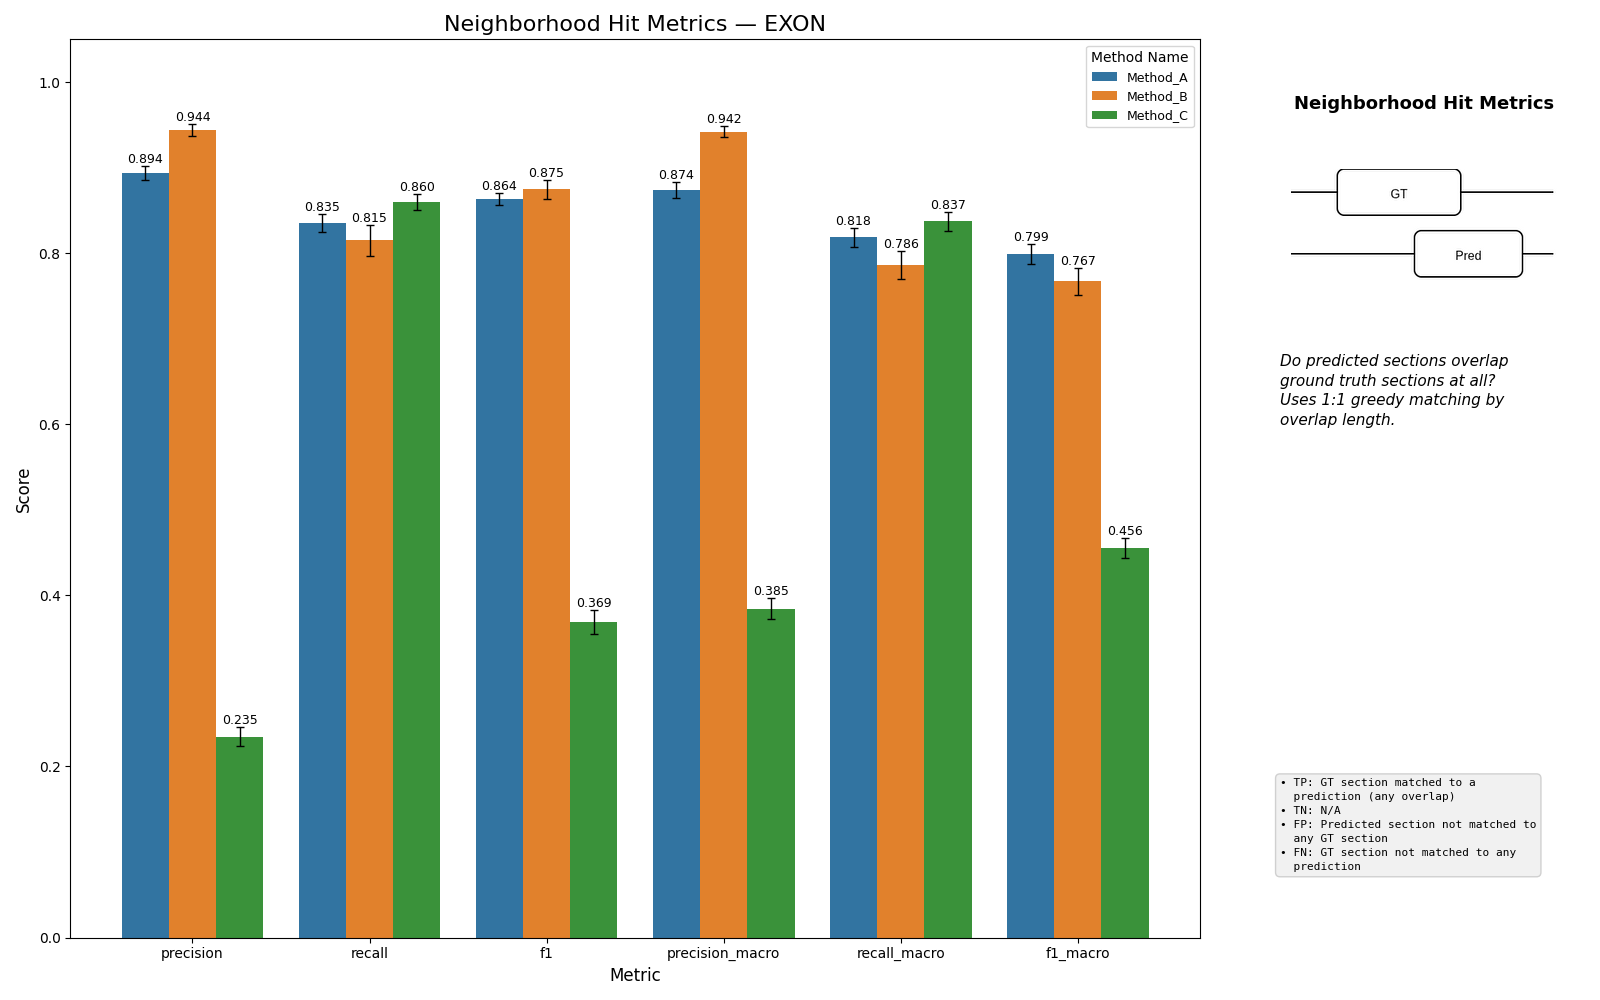
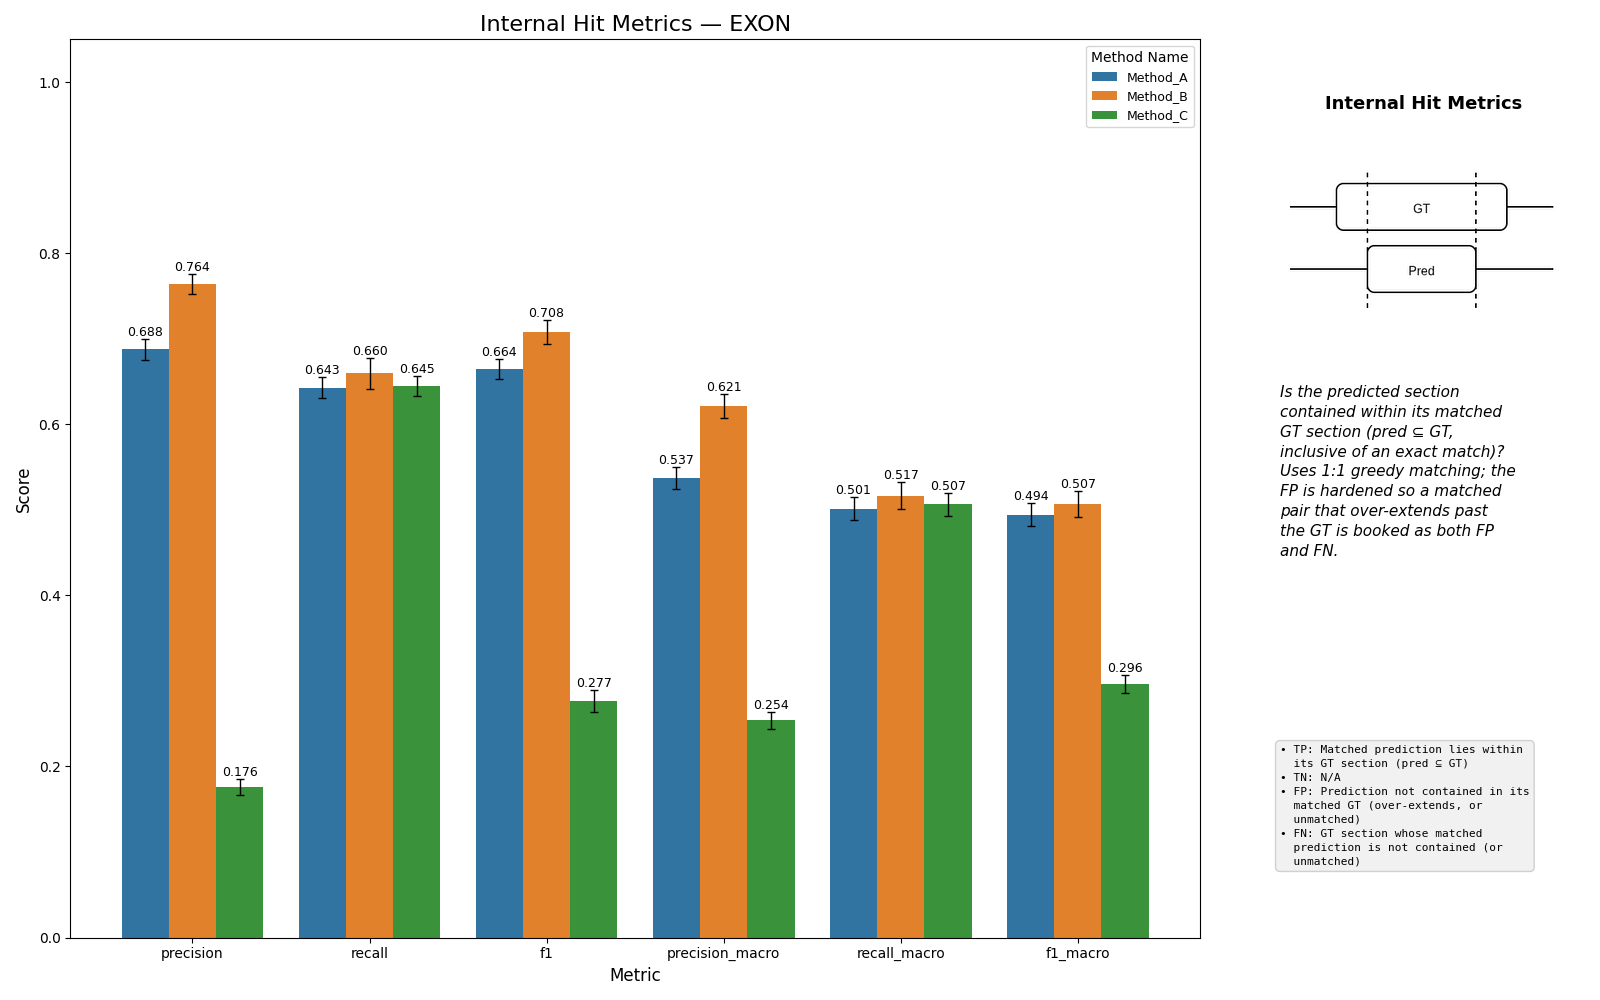
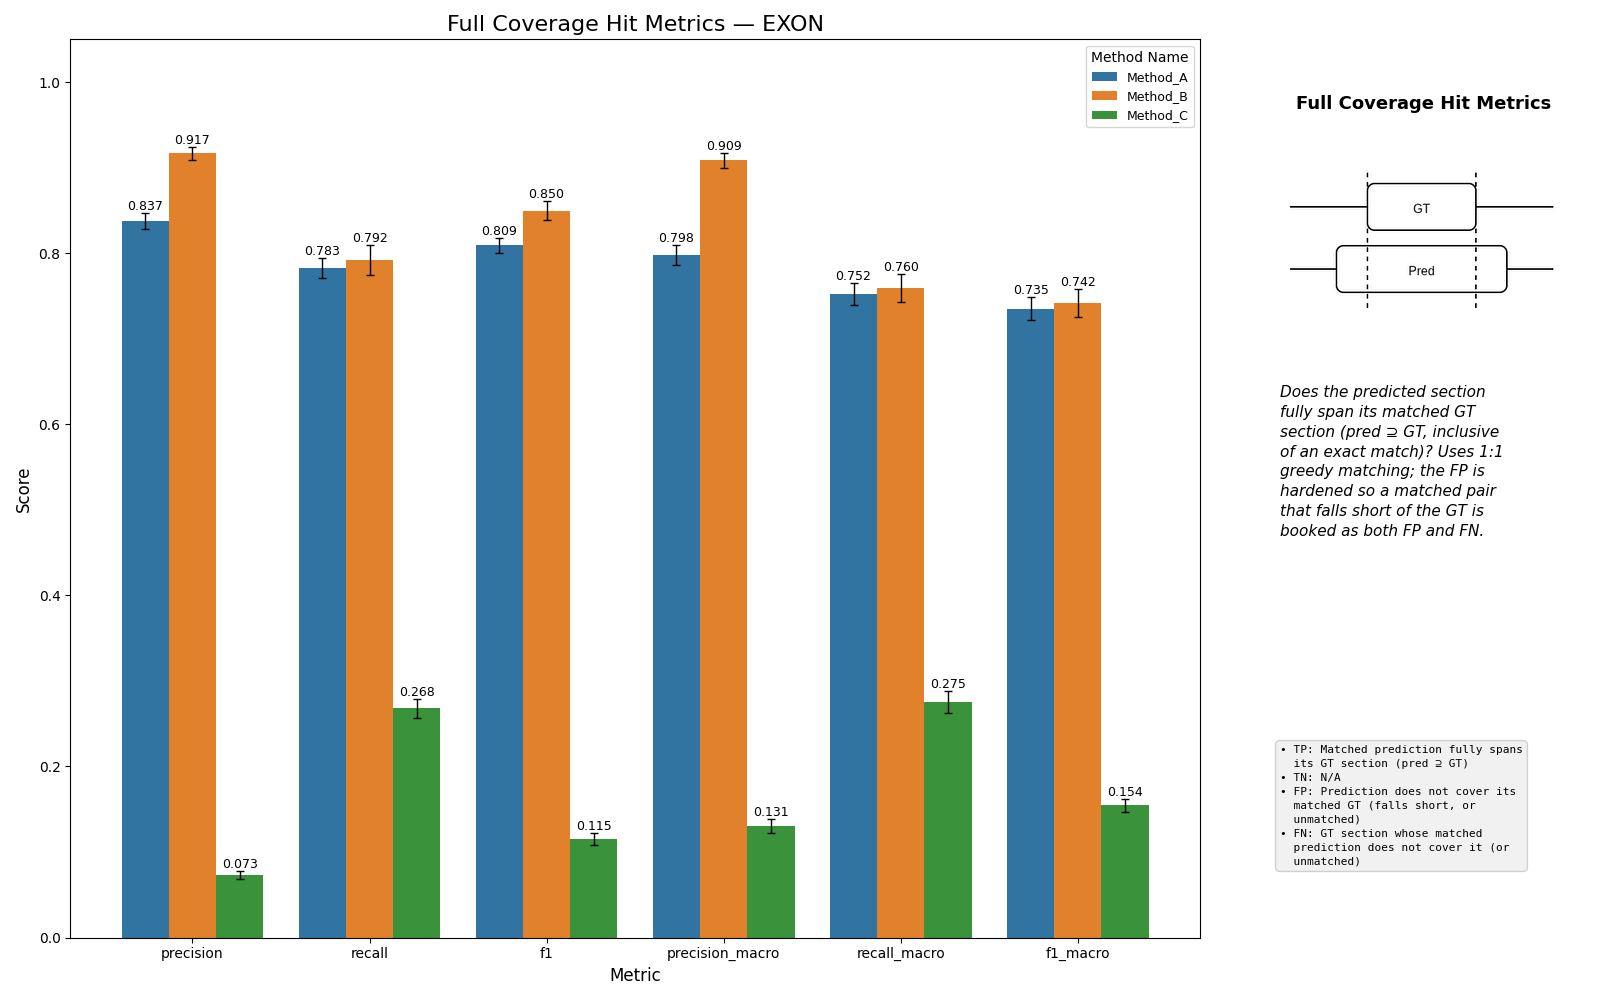
Evaluates section-level detection using greedy 1:1 matching by overlap length. Four coherent precision/recall tiers nested by strictness:
| Tier | Type | Meaning |
|---|---|---|
neighborhood_hit |
precision / recall | Detected the region at all (any overlap) |
internal_hit |
precision / recall | Matched pair where prediction lies inside GT (pred ⊆ GT) |
full_coverage_hit |
precision / recall | Matched pair where prediction spans GT (pred ⊇ GT) |
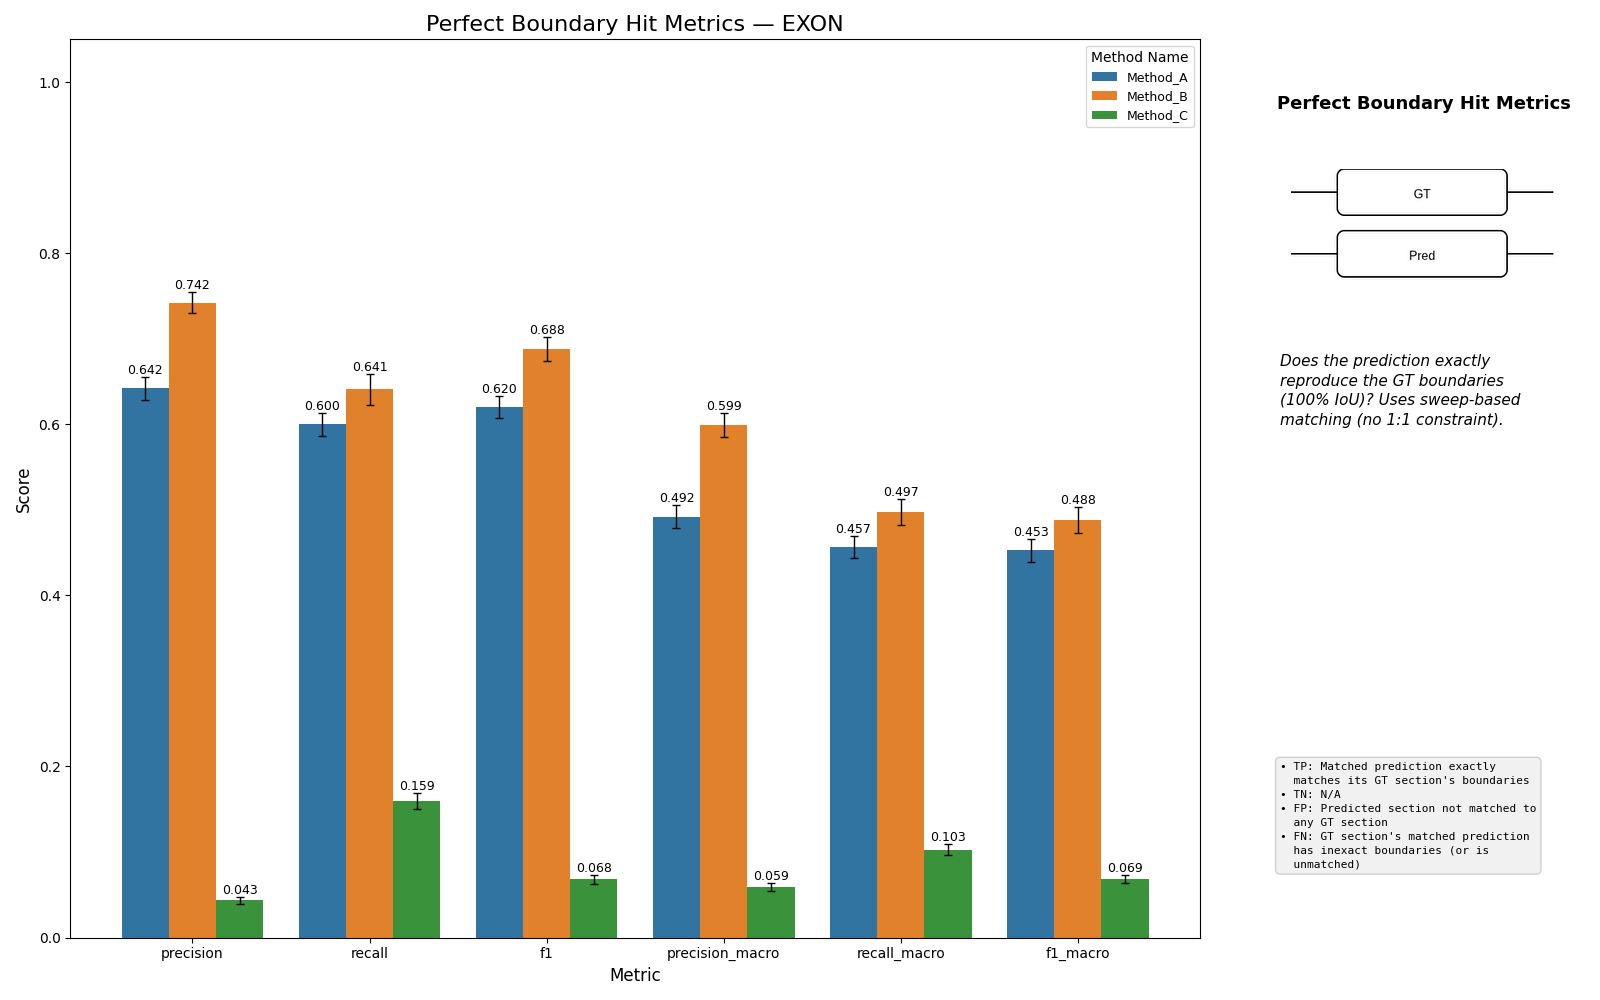
perfect_boundary_hit |
precision / recall | Exact boundary match (sweep-based, no 1:1 constraint) |
The tiers nest: neighborhood_hit ⊇ {internal_hit, full_coverage_hit} ⊇
perfect_boundary_hit. Each is a coherent confusion table — every tier hardens
its FP so TP + FP = total predictions and TP + FN = total GT — so all four are
reported as plain precision/recall. The internal_hit vs full_coverage_hit split
gives the direction of the boundary error (under- vs over-extension).
Boundary Exactness
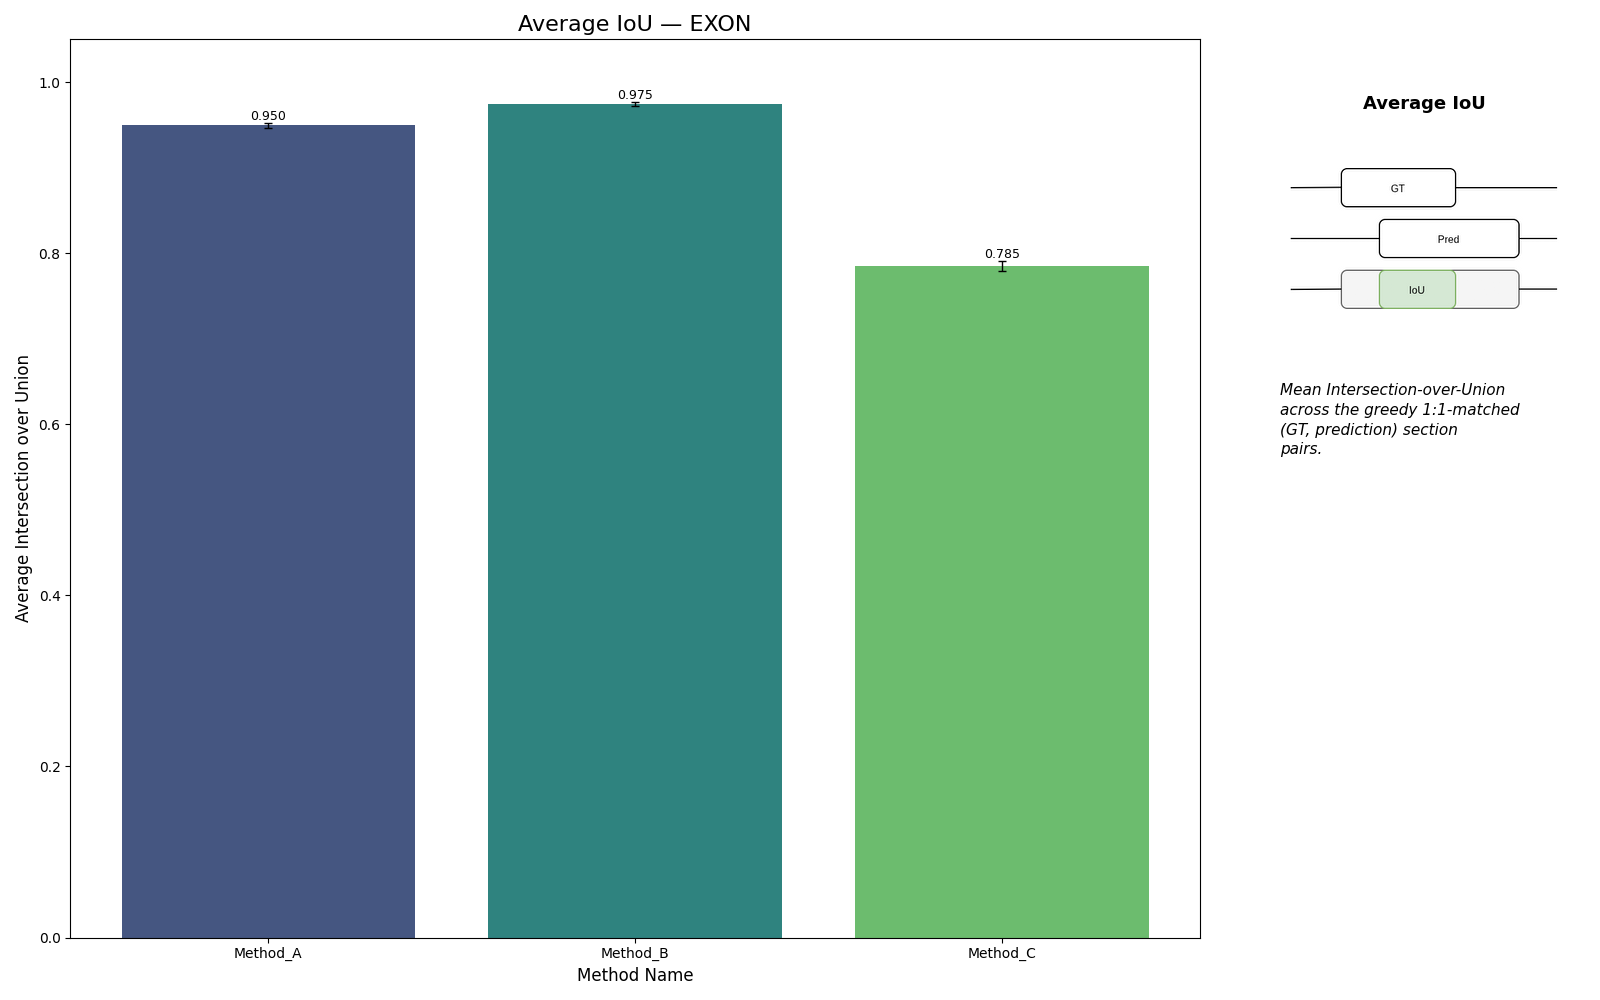
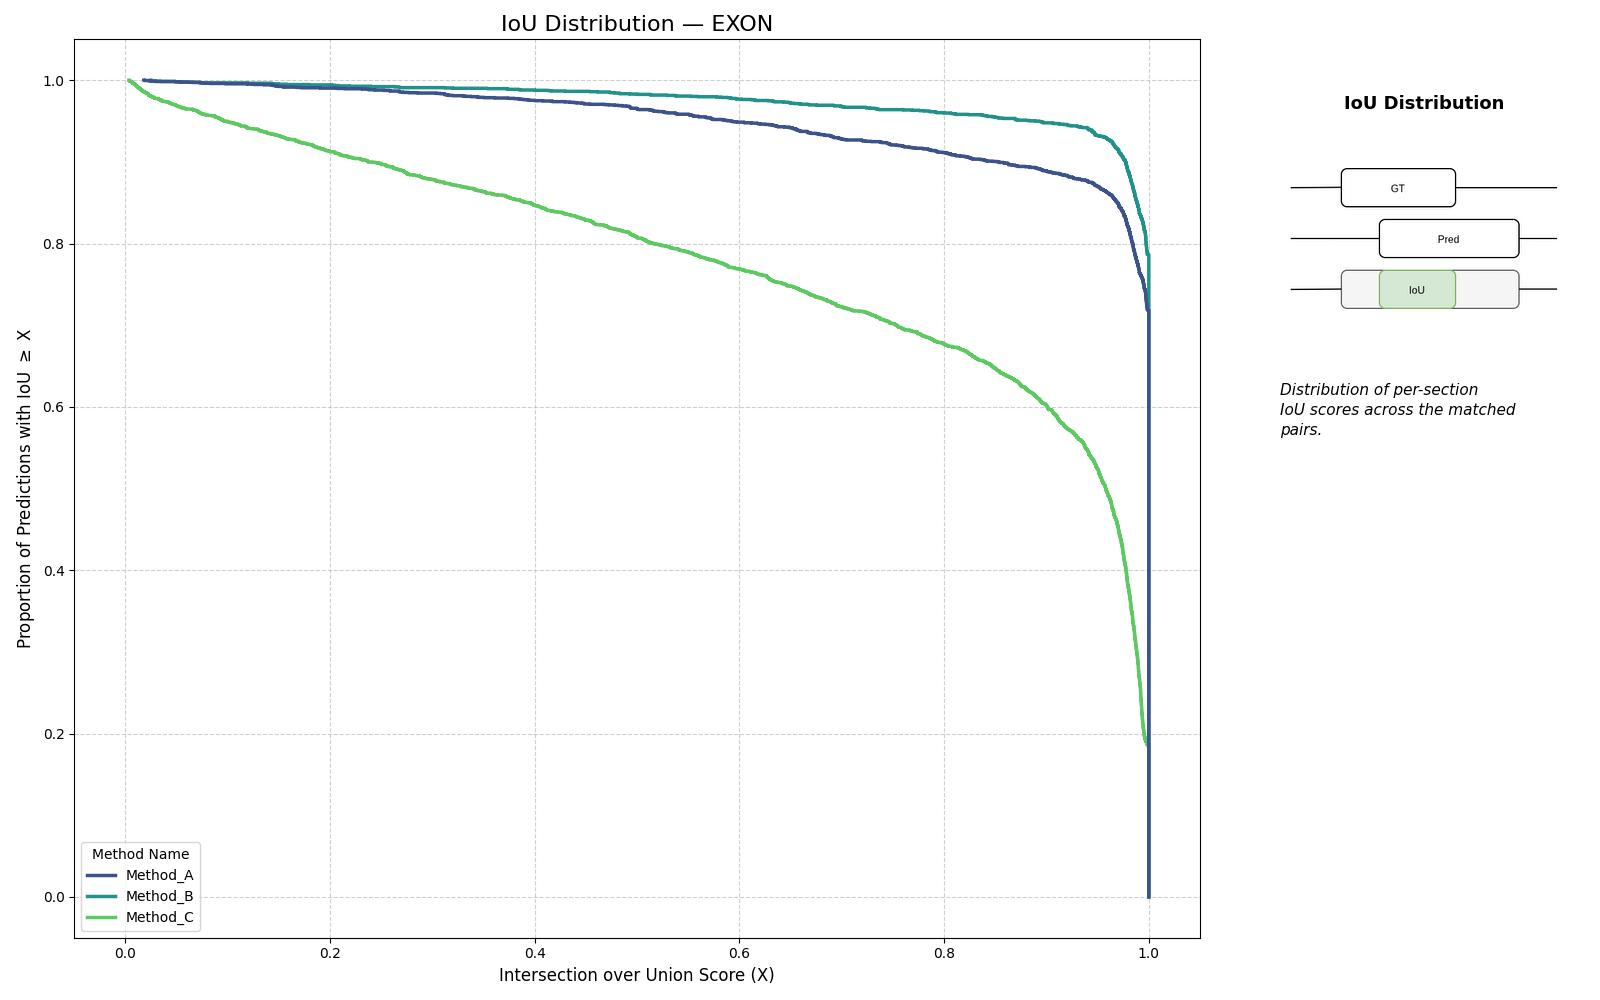
How precise are predicted boundaries? Includes IoU distributions and two diagnostic matrices:
- Bias matrix (21x21): Signed boundary residuals revealing systematic directional errors (e.g., "predictions consistently start 2bp early")
- Reliability matrix (11x11): Cumulative recall at tolerances 0--10 bp, showing how quickly recall degrades as boundary tolerance tightens
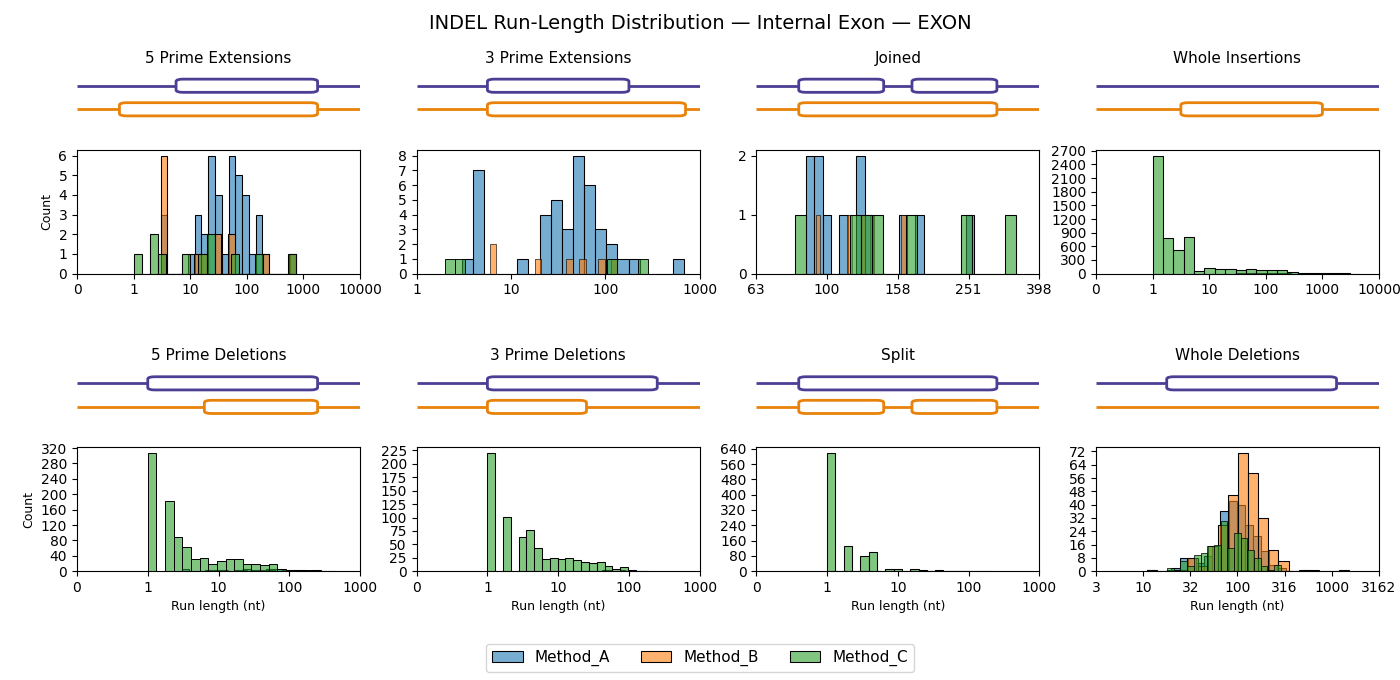
INDEL Error Taxonomy
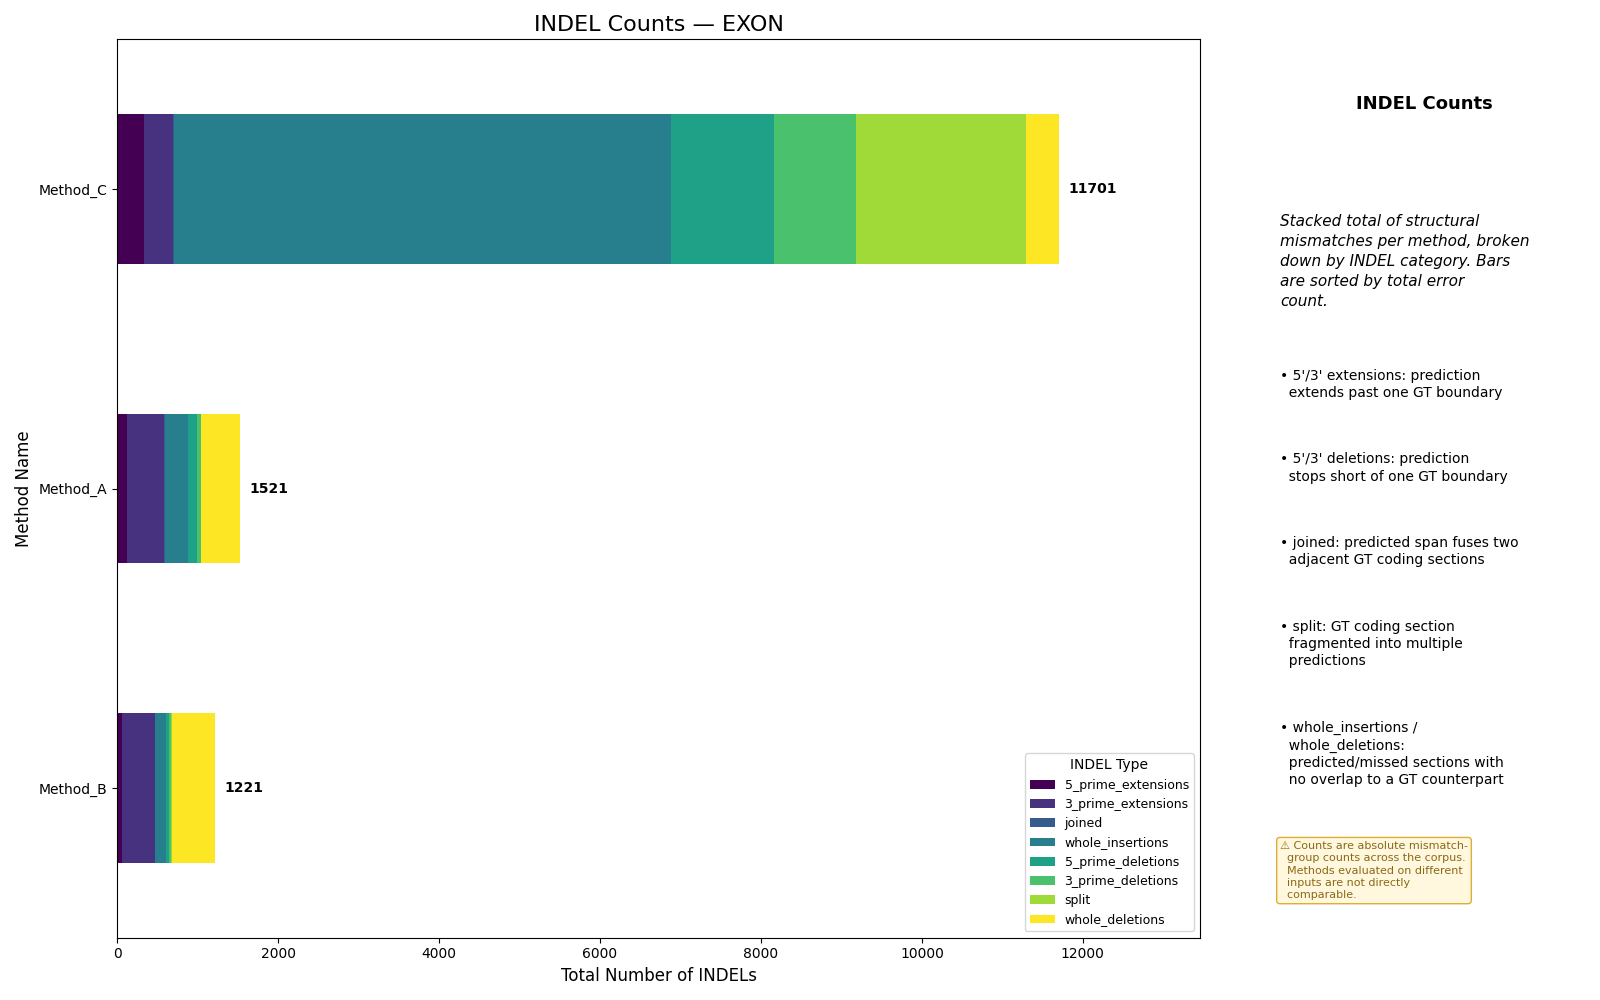
Classifies every contiguous mismatch region into one of 8 structural error types:
| Insertions (pred has class, GT does not) | Deletions (GT has class, pred does not) |
|---|---|
| 5' extension | 5' deletion |
| 3' extension | 3' deletion |
| Joined (merges two GT sections) | Split (splits one GT section) |
| Whole insertion (new section) | Whole deletion (missing section) |
Structural Coherence
Evaluates the predicted segment chain as a whole -- not per-section, but as a complete ordered arrangement.
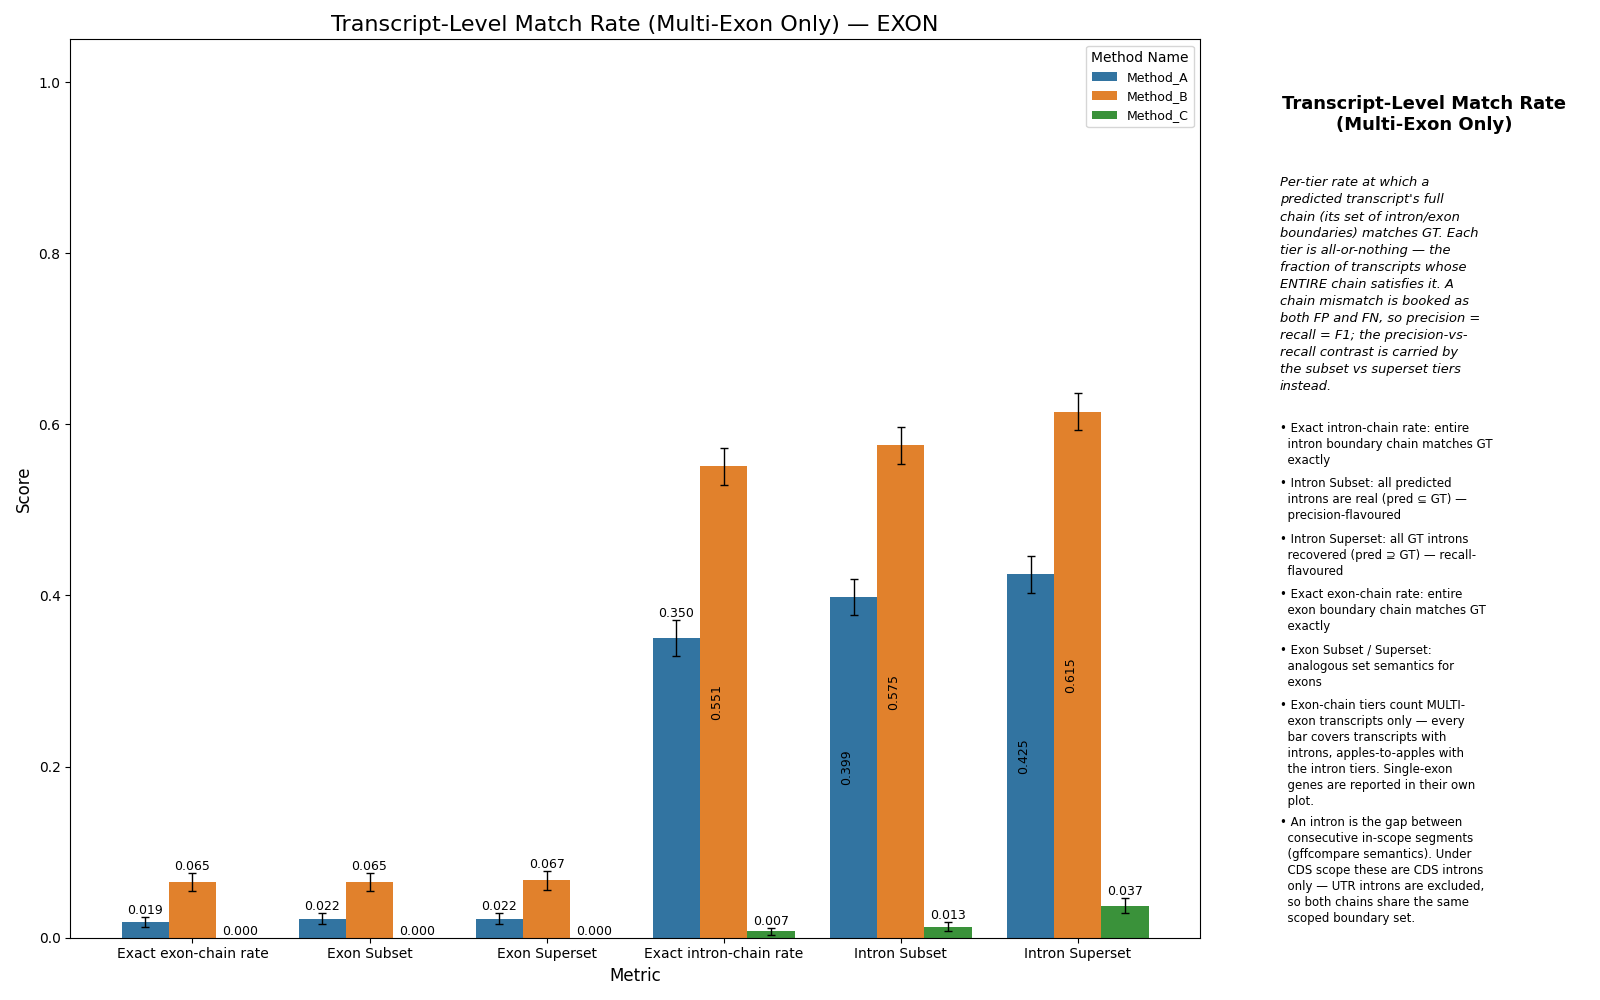
Intron Chain Comparison (strict, gffcompare-style)
intron_chain emits per-sequence tp/fp/fn ∈ {0, 1}: a sequence counts as TP only if the entire set of GT introns equals the set of predicted introns. Aggregated across sequences this becomes the familiar corpus precision/recall — directly comparable to gffcompare's intron-chain P/R.
Per-transcript Exon Recovery
The binary intron_chain metric hides "nearly right" predictions — a transcript with 9 of 10 exons correct scores the same as one with 0 correct. Three complementary per-transcript scalars surface this gradation and are kept as raw per-sequence lists so plotting can draw the distribution across transcripts:
exon_recall_per_transcript— fraction in[0, 1]of GT exons whose(start, end)was recovered exactly. A transcript with 9/10 exons right scores0.9. Transcripts with zero GT exons are excluded.exon_precision_per_transcript— fraction in[0, 1]of predicted exons whose(start, end)is an exact GT match (0.0when the prediction has no exons in scope). The symmetric precision partner to recall.false_exon_count_per_transcript— integer ≥ 0: predicted exons whose(start, end)is absent from GT. The absolute spurious-exon burden a ratio hides.
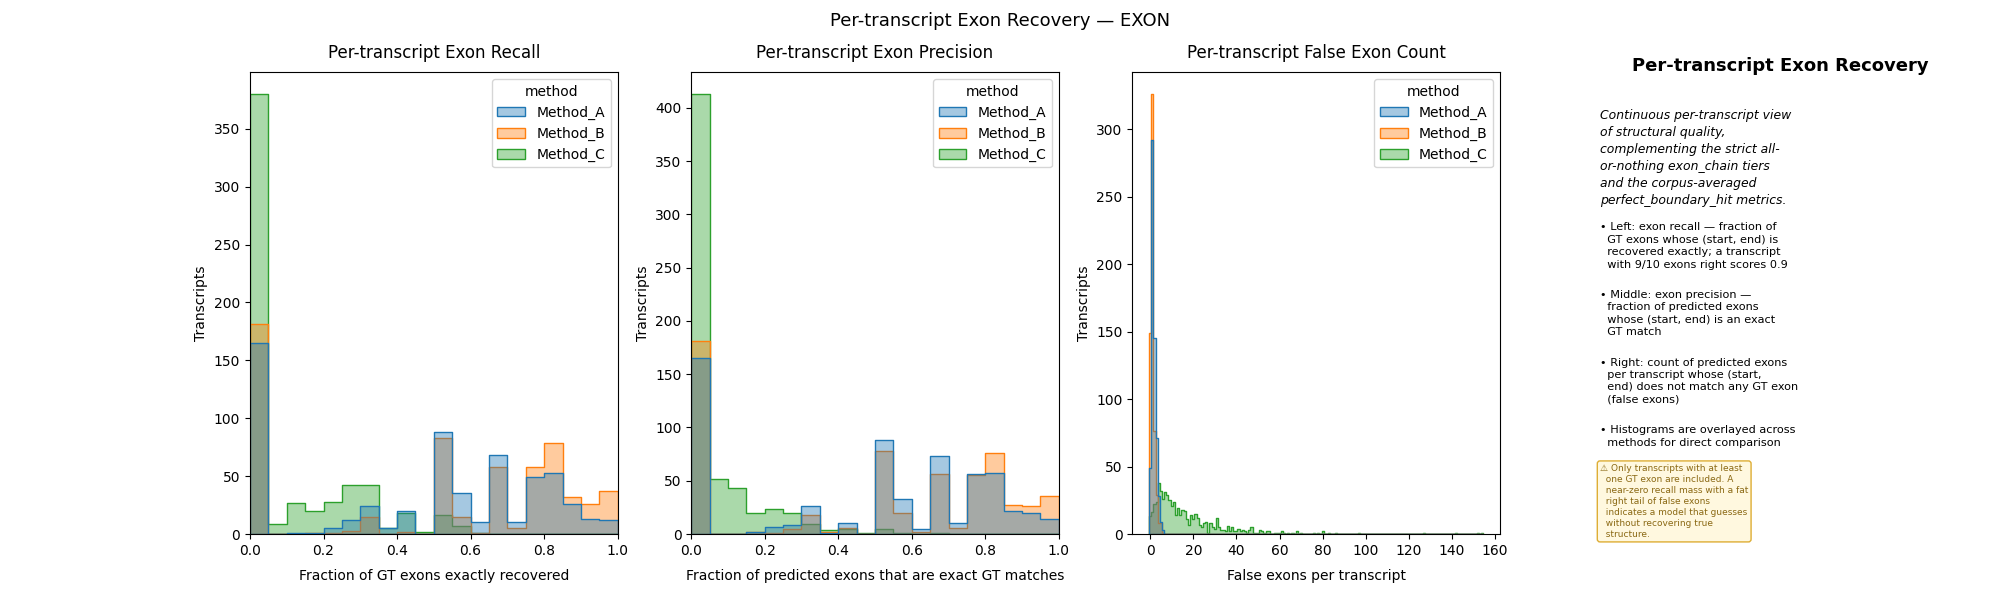
Rendered as three overlayed histograms; a fat left tail of recall combined with a fat right tail of false exons flags a model that guesses rather than recovering true structure.
Transcript Match Classification
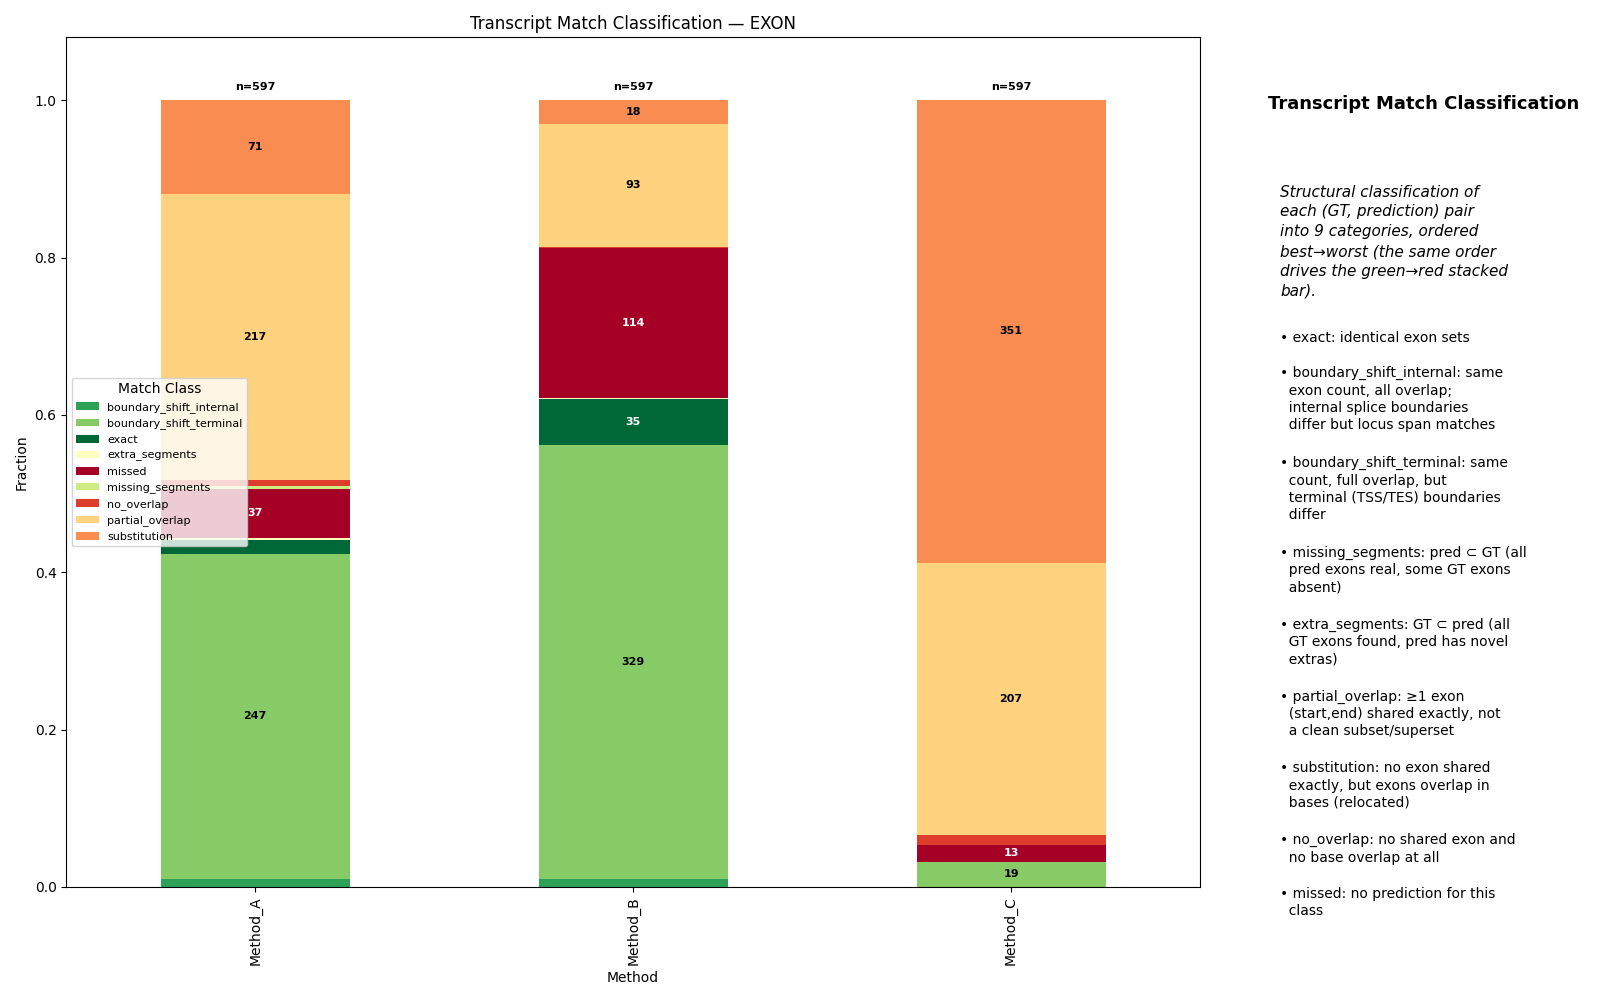
Holistic structural classification of each (GT, prediction) pair into one of nine categories
(see TranscriptMatchClass):
| Class | Condition |
|---|---|
exact |
Identical segment sets |
boundary_shift_internal |
Same segment count, outer locus boundaries match, internal splice sites differ |
boundary_shift_terminal |
Same segment count, but terminal (locus-edge) boundaries also differ |
missing_segments |
Prediction's segment set is a strict subset of GT's |
extra_segments |
GT's segment set is a strict subset of prediction's |
partial_overlap |
At least one shared segment, but neither equality nor subset relation |
substitution |
No shared (start, end) segment, but ≥1 predicted segment overlaps a GT segment in base coordinates (relocated/substituted exons) |
no_overlap |
No shared (start, end) segment and no base overlap |
missed |
Prediction has no segments of this class |
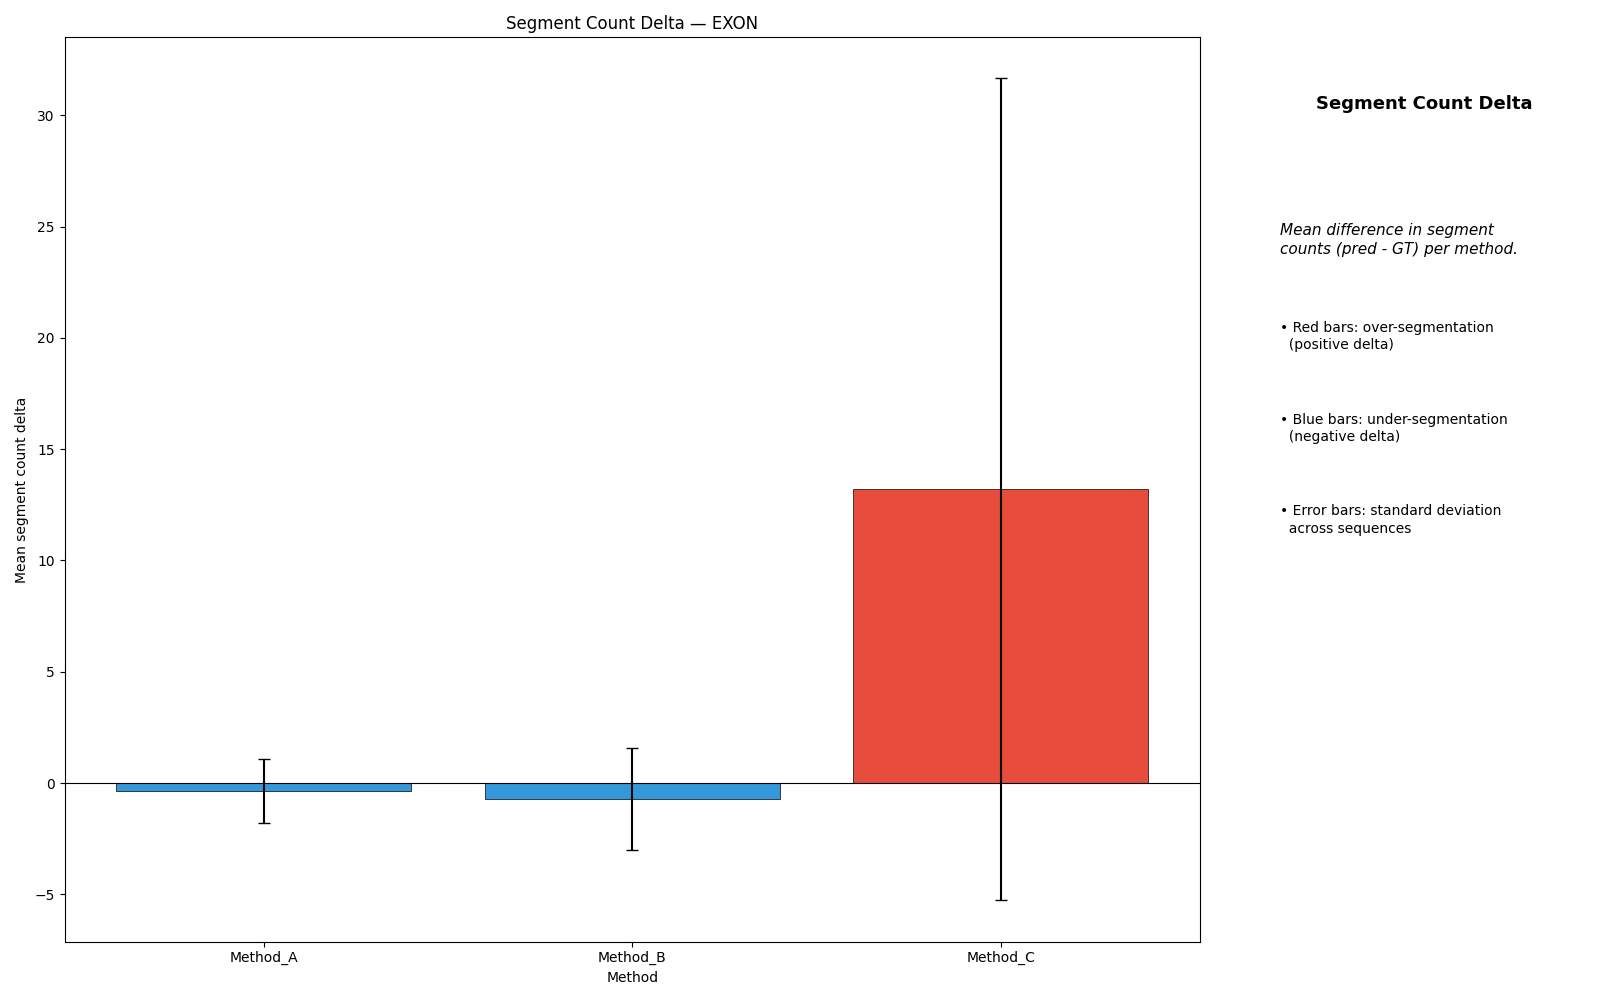
Segment Count Delta
Over-segmentation (positive) vs under-segmentation (negative).
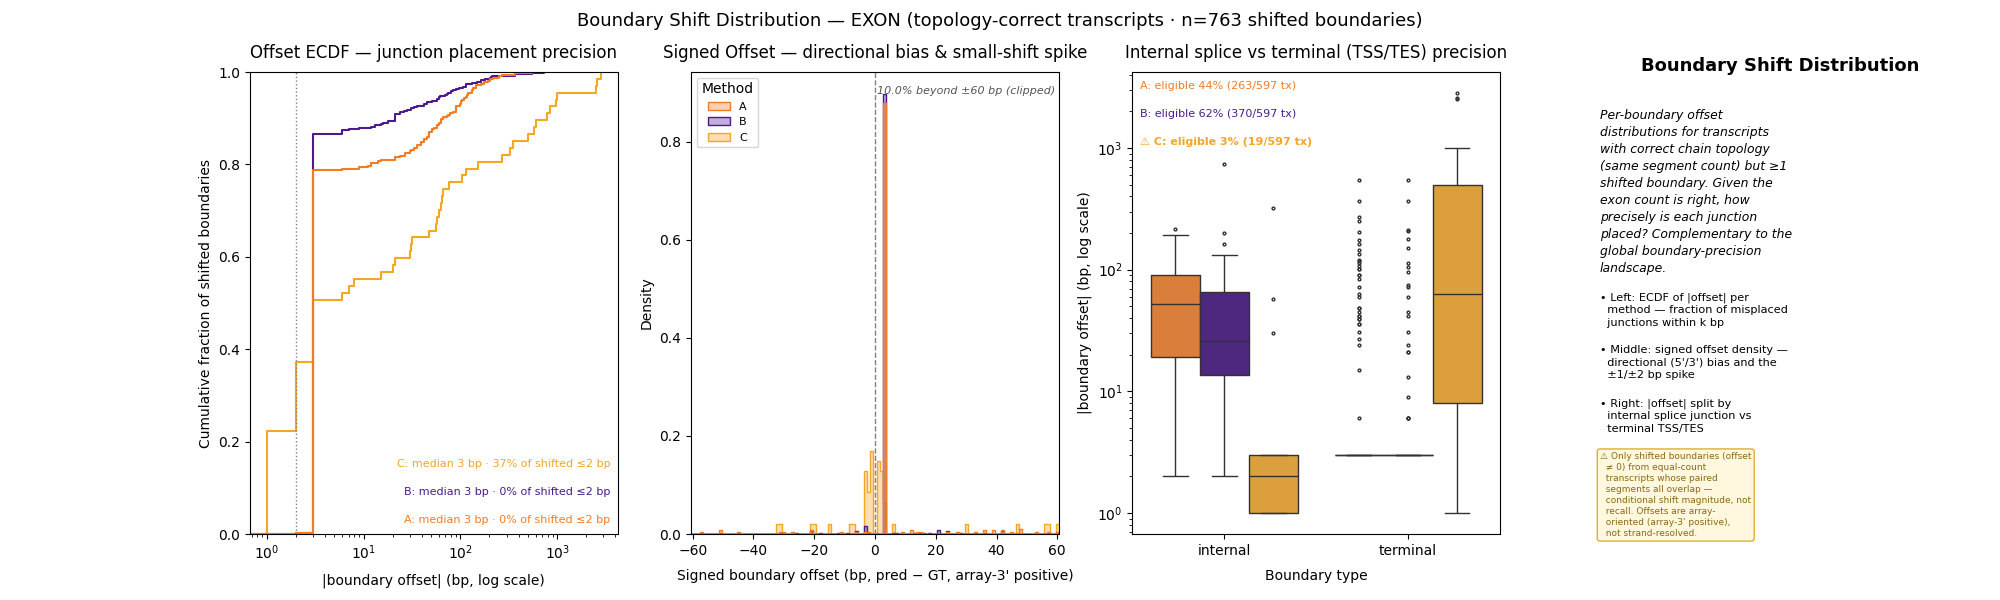
Boundary Shift Distribution
For transcripts where GT and prediction have matching segment counts, the per-transcript total absolute boundary offset (bp).
Diagnostic Depth
Causal diagnosis of structural errors — answering where prediction errors concentrate, not just that they exist.
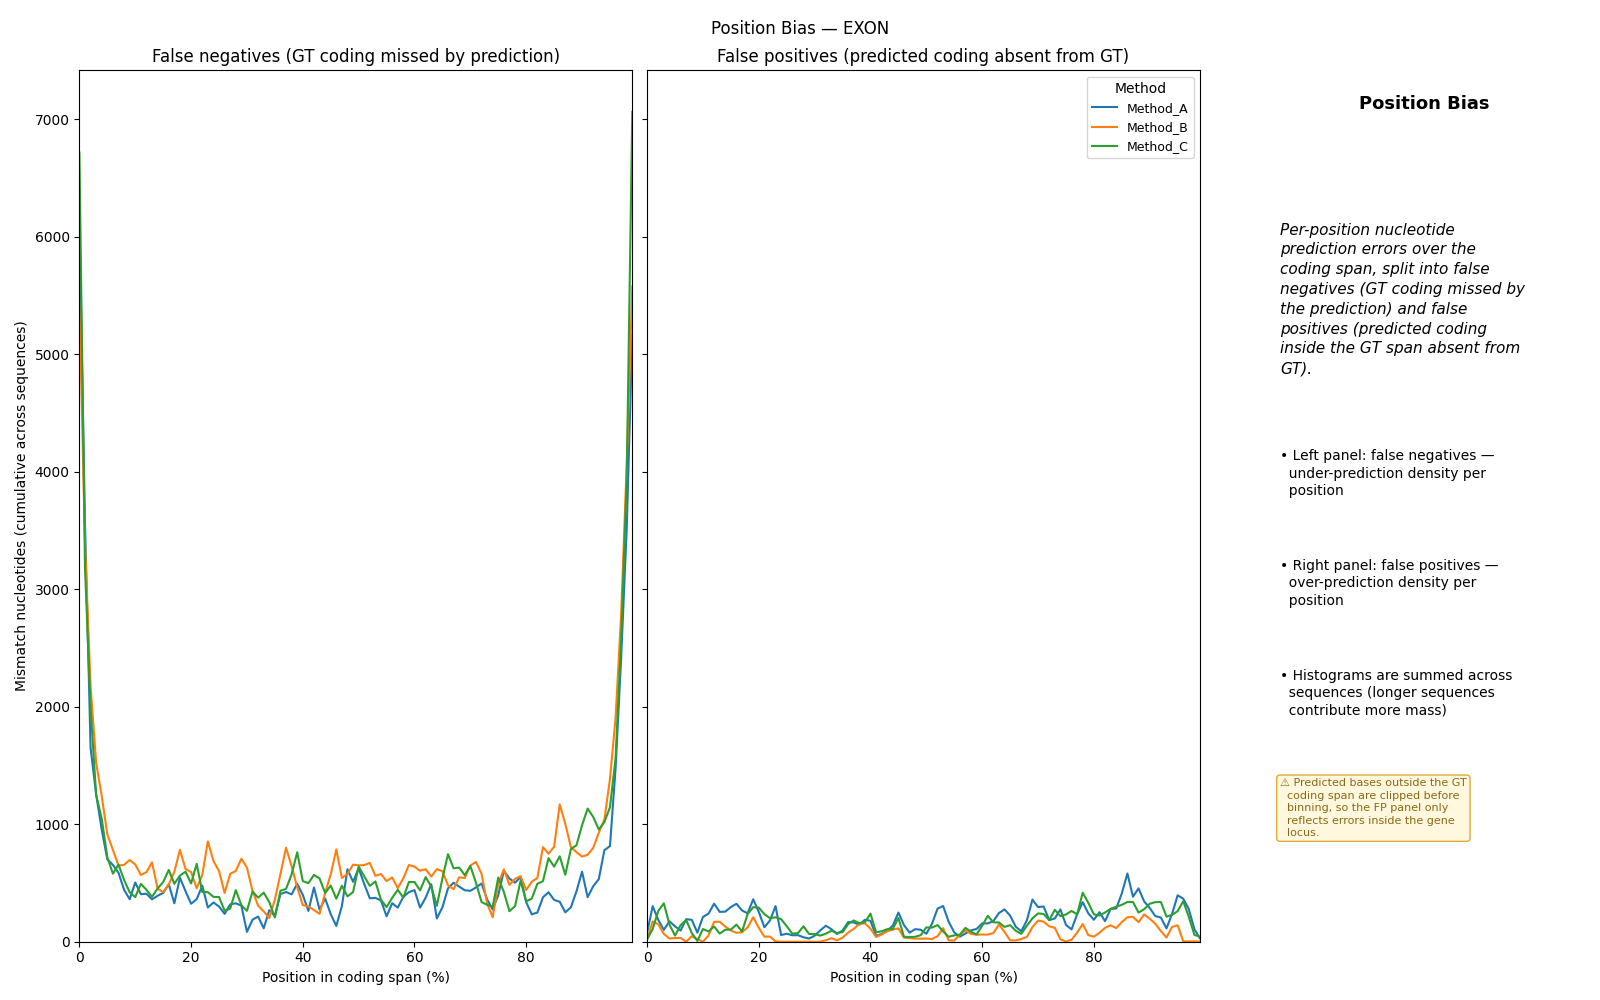
Position Bias
Match rate stratified by relative position inside the GT coding span (5' / interior / 3'), revealing whether errors concentrate at sequence ends. Two histograms are emitted: false negatives (GT coding bases the predictor missed) and false positives (predicted coding bases inside the GT span that are not in GT).
Segment-length EMD
Earth Mover's Distance between the GT and predicted coding-segment length distributions.
Phase Drift
Per-position coding-base phase drift, defined as
(cumulative_pred_coding_count − cumulative_gt_coding_count) mod 3 along the transcript
(signed difference reduced mod 3, so -1 and +2 both map to frame 2).
Reflects relative coding-base displacement between GT and prediction; it is not the
biological reading frame (which depends on the GFF phase column and is not consumed here).
Useful as a qualitative diagnostic. When the GT coding length is not divisible by 3 (e.g.
UTRs are painted into the coding mask), the metric is skipped for that sequence with a warning
rather than aborting the run.
State Transitions
Requested via EvalMetrics.STATE_TRANSITIONS (included in the default metric set,
so it runs unless you pass an explicit metrics list that omits it). Two analyses:
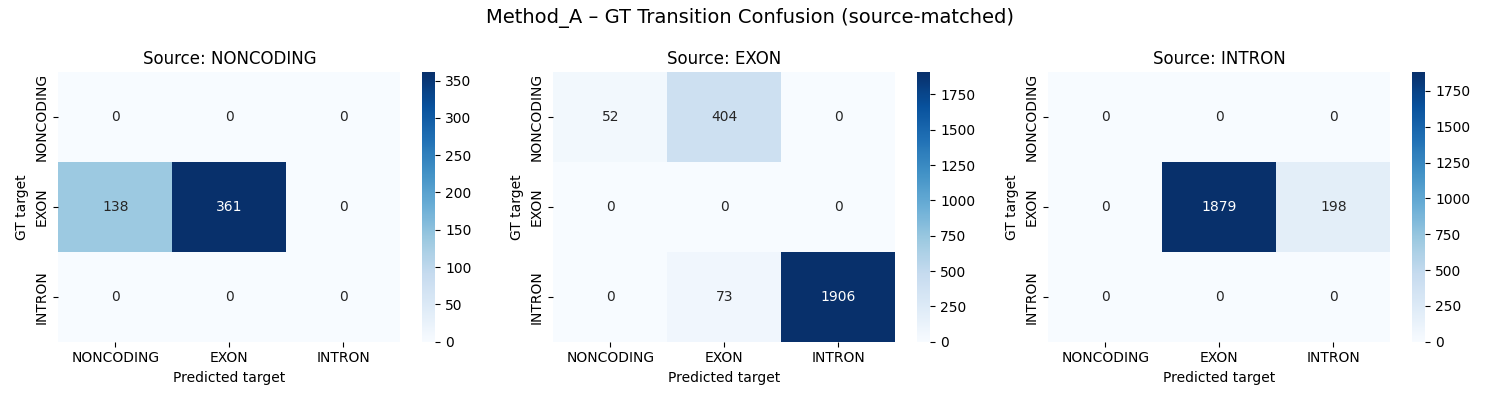
- GT Transition Confusion Matrices: At every position where GT changes label, what did the predictor do? One heatmap per source label.
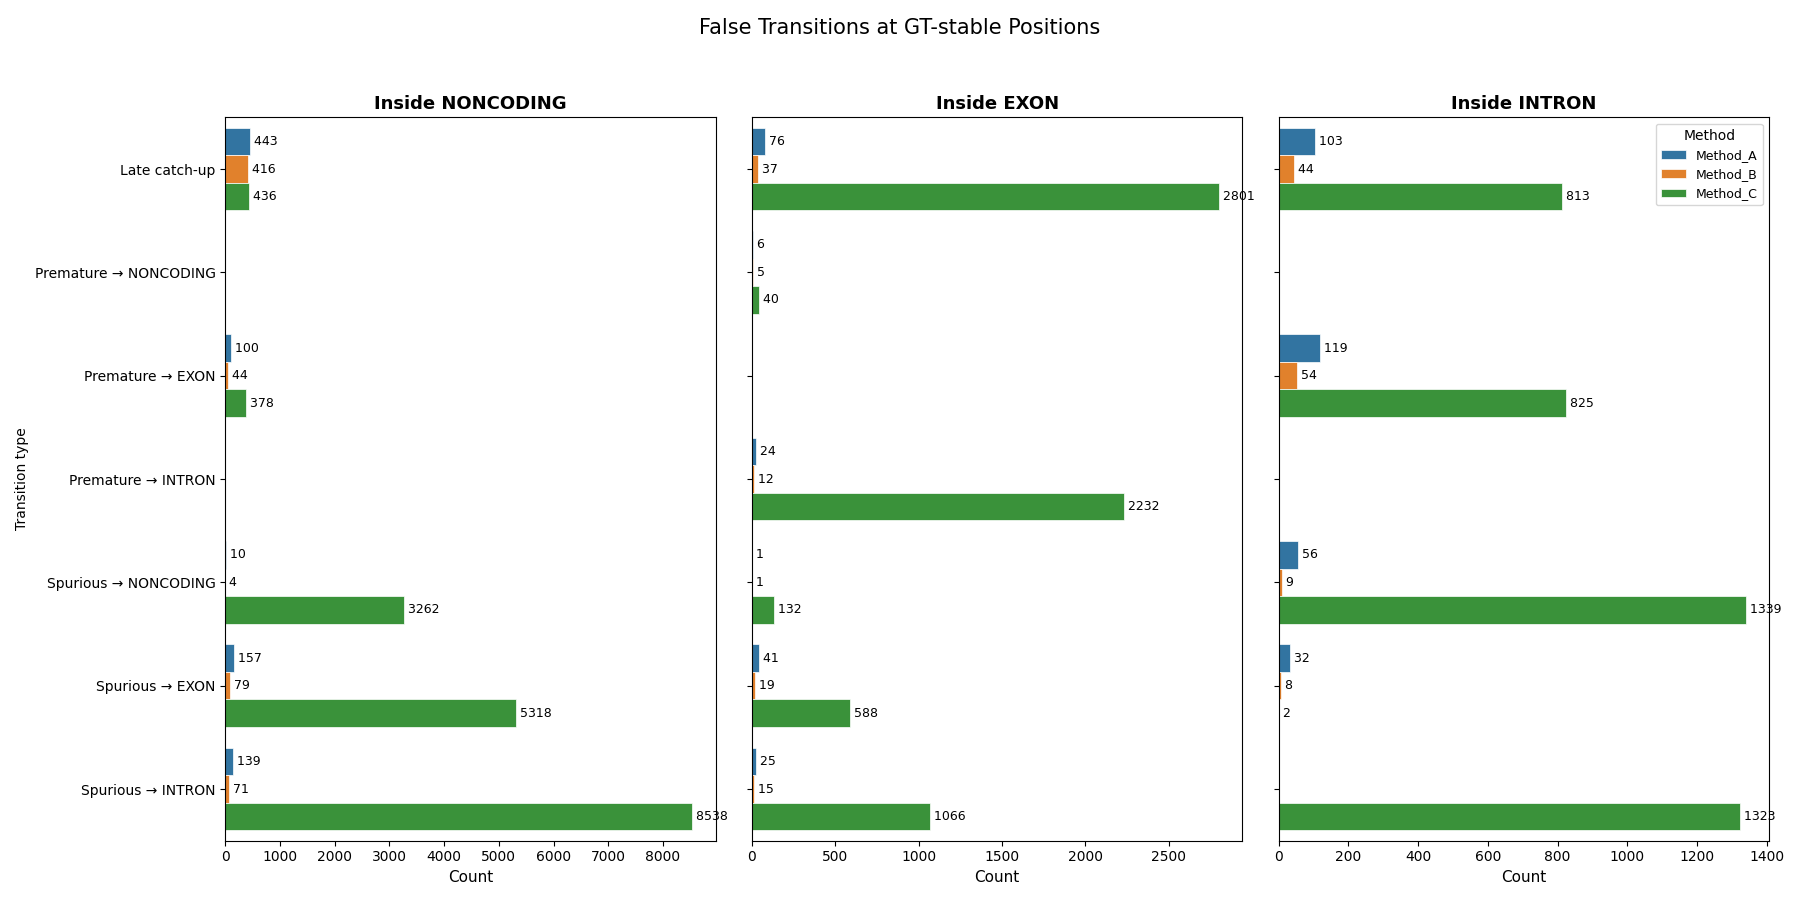
- False Transition Analysis: At positions where GT is stable (no label change), did the predictor introduce a spurious transition? Each false transition is classified into late-catchup, premature, or spurious using lookbehind/lookahead context.
Label Configuration
All metrics are label-agnostic. Every LabelConfig declares an explicit
annotation mode that fixes what the positive labels mean:
| Mode | Positive labels | Use it for |
|---|---|---|
EXON_INTRON |
one exon_label |
exon/intron structure; tools that don't split UTR from CDS |
UTR_CDS_INTRON |
five_prime_utr_label, cds_label, three_prime_utr_label |
full transcript anatomy; CDS-scoped metrics; PHASE_DRIFT |
from gene_calling_benchmark import AnnotationMode, LabelConfig

# Exon/intron structure
exon_config = LabelConfig(
    annotation_mode=AnnotationMode.EXON_INTRON,
    background_label=8,
    exon_label=0,            # required in this mode
    intron_label=2,          # optional; required for intron-chain metrics
    splice_donor_label=1,    # optional; both splice labels set together
    splice_acceptor_label=3, # optional
)

# Transcript anatomy with explicit UTR/CDS
anatomy_config = LabelConfig(
    annotation_mode=AnnotationMode.UTR_CDS_INTRON,
    background_label=8,
    cds_label=0,             # required in this mode
    five_prime_utr_label=4,  # required
    three_prime_utr_label=5, # required
    intron_label=2,
    splice_donor_label=1,
    splice_acceptor_label=3,
)
The integer tokens are an internal array-encoding detail. If you are working from GFF/GTF files and don't care about the specific integers, use the canonical defaults instead of assigning them by hand:
exon_config   = LabelConfig.default_exon_intron()      # same scheme as BEND_LABEL_CONFIG
anatomy_config = LabelConfig.default_utr_cds_intron()  # explicit UTR/CDS/intron/splice tokens
The mode also fixes the evaluation scope. Per-transcript metrics run on the
configured evaluation_scope (transcript_exon by default; cds is available
in UTR_CDS_INTRON), while global file-level metrics report every available
scope. PHASE_DRIFT is only valid in UTR_CDS_INTRON with
evaluation_scope=BenchmarkScope.CDS.
A pre-built EXON_INTRON config for the BEND benchmark is available as
BEND_LABEL_CONFIG. See the
annotation modes guide
for the full walkthrough.
Documentation
Full documentation is available at https://gene-calling-benchmark.readthedocs.io/en/latest/
- Metrics overview — index of every metric group with formulas and aggregation details
- Getting started — array, GFF, method-comparison, and W&B walkthroughs
- API reference — Sphinx-generated module documentation
Release history Release notifications | RSS feed

Download files
Download the file for your platform. If you're not sure which to choose, learn more about installing packages.
Source Distribution
Built Distribution
Filter files by name, interpreter, ABI, and platform.
If you're not sure about the file name format, learn more about wheel file names.
Copy a direct link to the current filters
File details
Details for the file gene_calling_benchmark-0.1.0.tar.gz.
File metadata
- Download URL: gene_calling_benchmark-0.1.0.tar.gz
- Upload date:
- Size: 188.3 kB
- Tags: Source
- Uploaded using Trusted Publishing? No
- Uploaded via: uv/0.6.6
File hashes
| Algorithm | Hash digest | |
|---|---|---|
| SHA256 |
e68107239b4dffe2f7309f3cbc1e1f6f40af0bcbcdd328b86dab94161b4dc2a8
|
|
| MD5 |
0c38d073743aa5e5b9c83541bafb5af8
|
|
| BLAKE2b-256 |
693394a054d943d0b7f22e06b057a169e96d4ba37a50d00a5a0166db11c45245
|
File details
Details for the file gene_calling_benchmark-0.1.0-py3-none-any.whl.
File metadata
- Download URL: gene_calling_benchmark-0.1.0-py3-none-any.whl
- Upload date:
- Size: 203.3 kB
- Tags: Python 3
- Uploaded using Trusted Publishing? No
- Uploaded via: uv/0.6.6
File hashes
| Algorithm | Hash digest | |
|---|---|---|
| SHA256 |
8d3acbce9cb5ca808c2bb0096d66c50310fd71a734ae07ff27241ee80470401f
|
|
| MD5 |
17c9d6173de9151343e7df4eb7f22671
|
|
| BLAKE2b-256 |
8a83c4dc733712cbdb2d9f43a8409756b5fbc731ad9e04650939f3bb0de734c7
|






