No project description provided

Project description
GeneScape: Gene Function Visualization

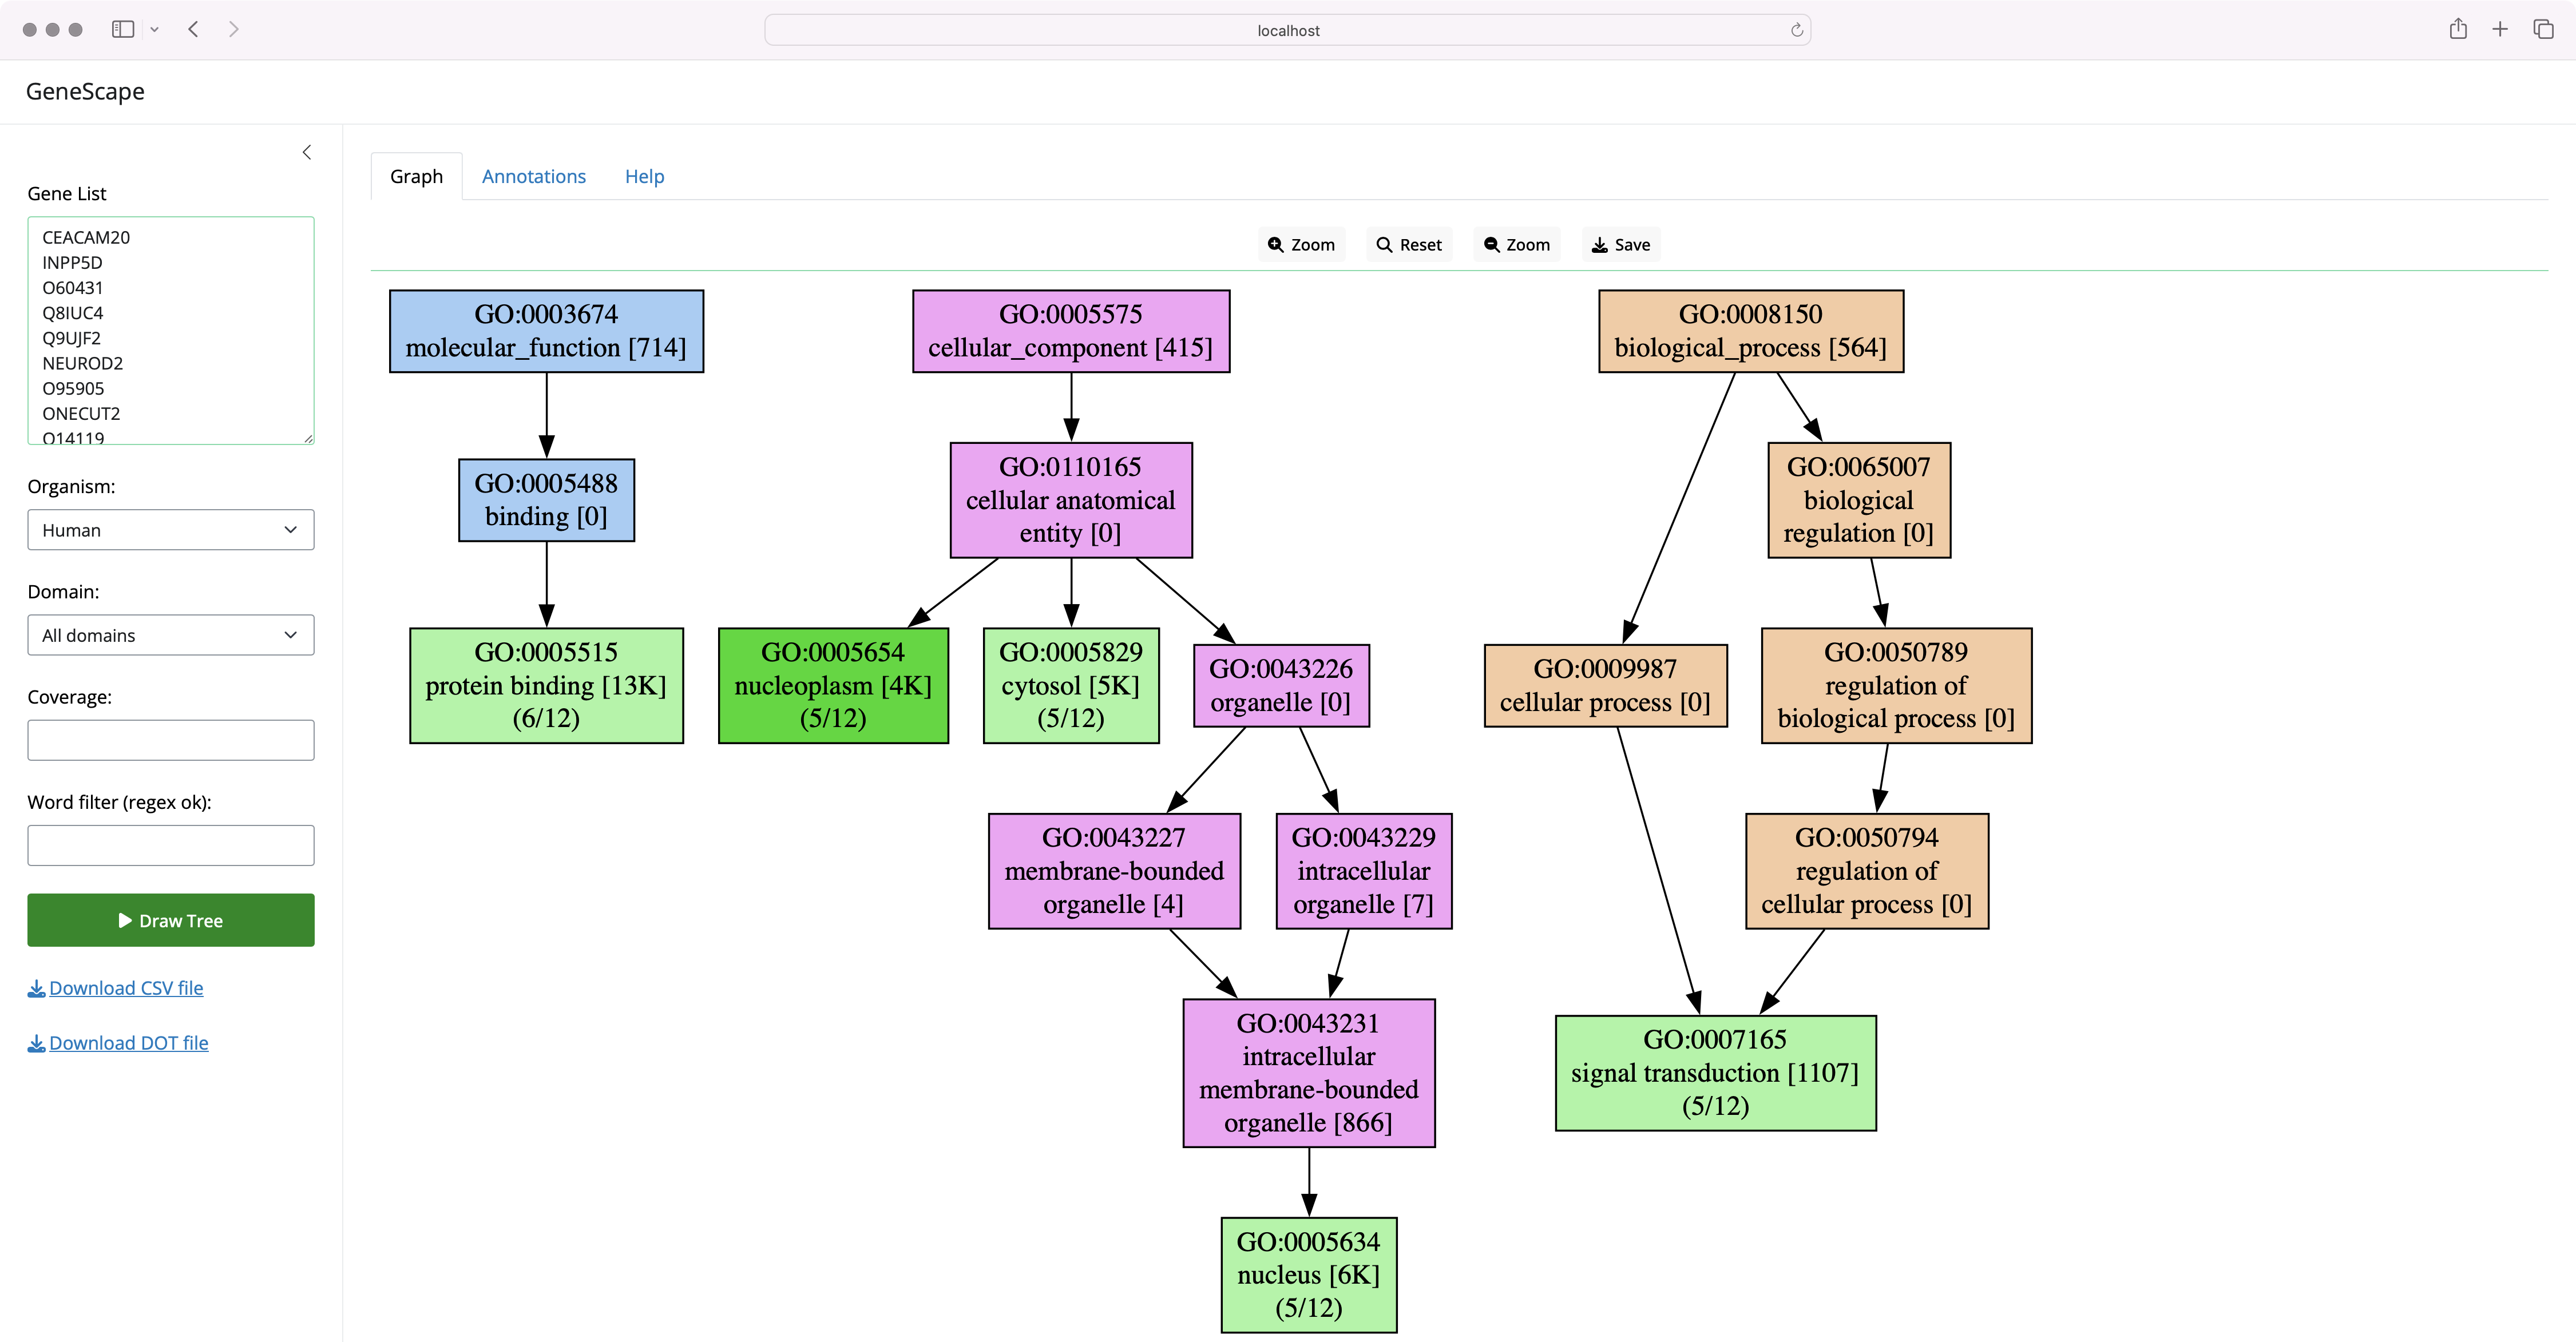
GeneScape is a software tool for visualizing gene functions. Users enter a list of genes, the software then draws a subgraph of the Gene Ontology (GO) terms associated with the genes.
GeneScape is a Python-based Shiny application that be run both at the command line and also via a graphical user interface.
Publication:
The Shiny version of the software can be accessed at:
Usage limits may apply to the public interface. For unlimited use, install and run the software locally.
Local installation
Users can also run the program on their system by installing the software via pip:
pip install genescape
After installation, the Shiny interface can be started via:
genescape web
Visit the http://localhost:8000 URL in your browser to see the interface.
Command line use
The program can also be used at the command line to generate images or annotations:
genescape treedraws informative Gene Ontology (GO) subgraphsgenescape annotateannotates a list of genes with GO functionsgenescape webprovides a web interface for thetreecommand
What does GeneScape do?
GeneScape works the following way:
- It first reads genes from an Input List
- Then extracts the Annotations associated with the input genes
- Finally, it builds and visualizes the functional subtree tree based on these Annotations.
Note: Even short lists of genes (under ten genes) can create large trees. Filter by minimum coverage (how many genes share the function) or functional patterns (functions that match a pattern).
GeneScape will try to find a reasonable coverage threshold when that threshold is not explicitly specified.
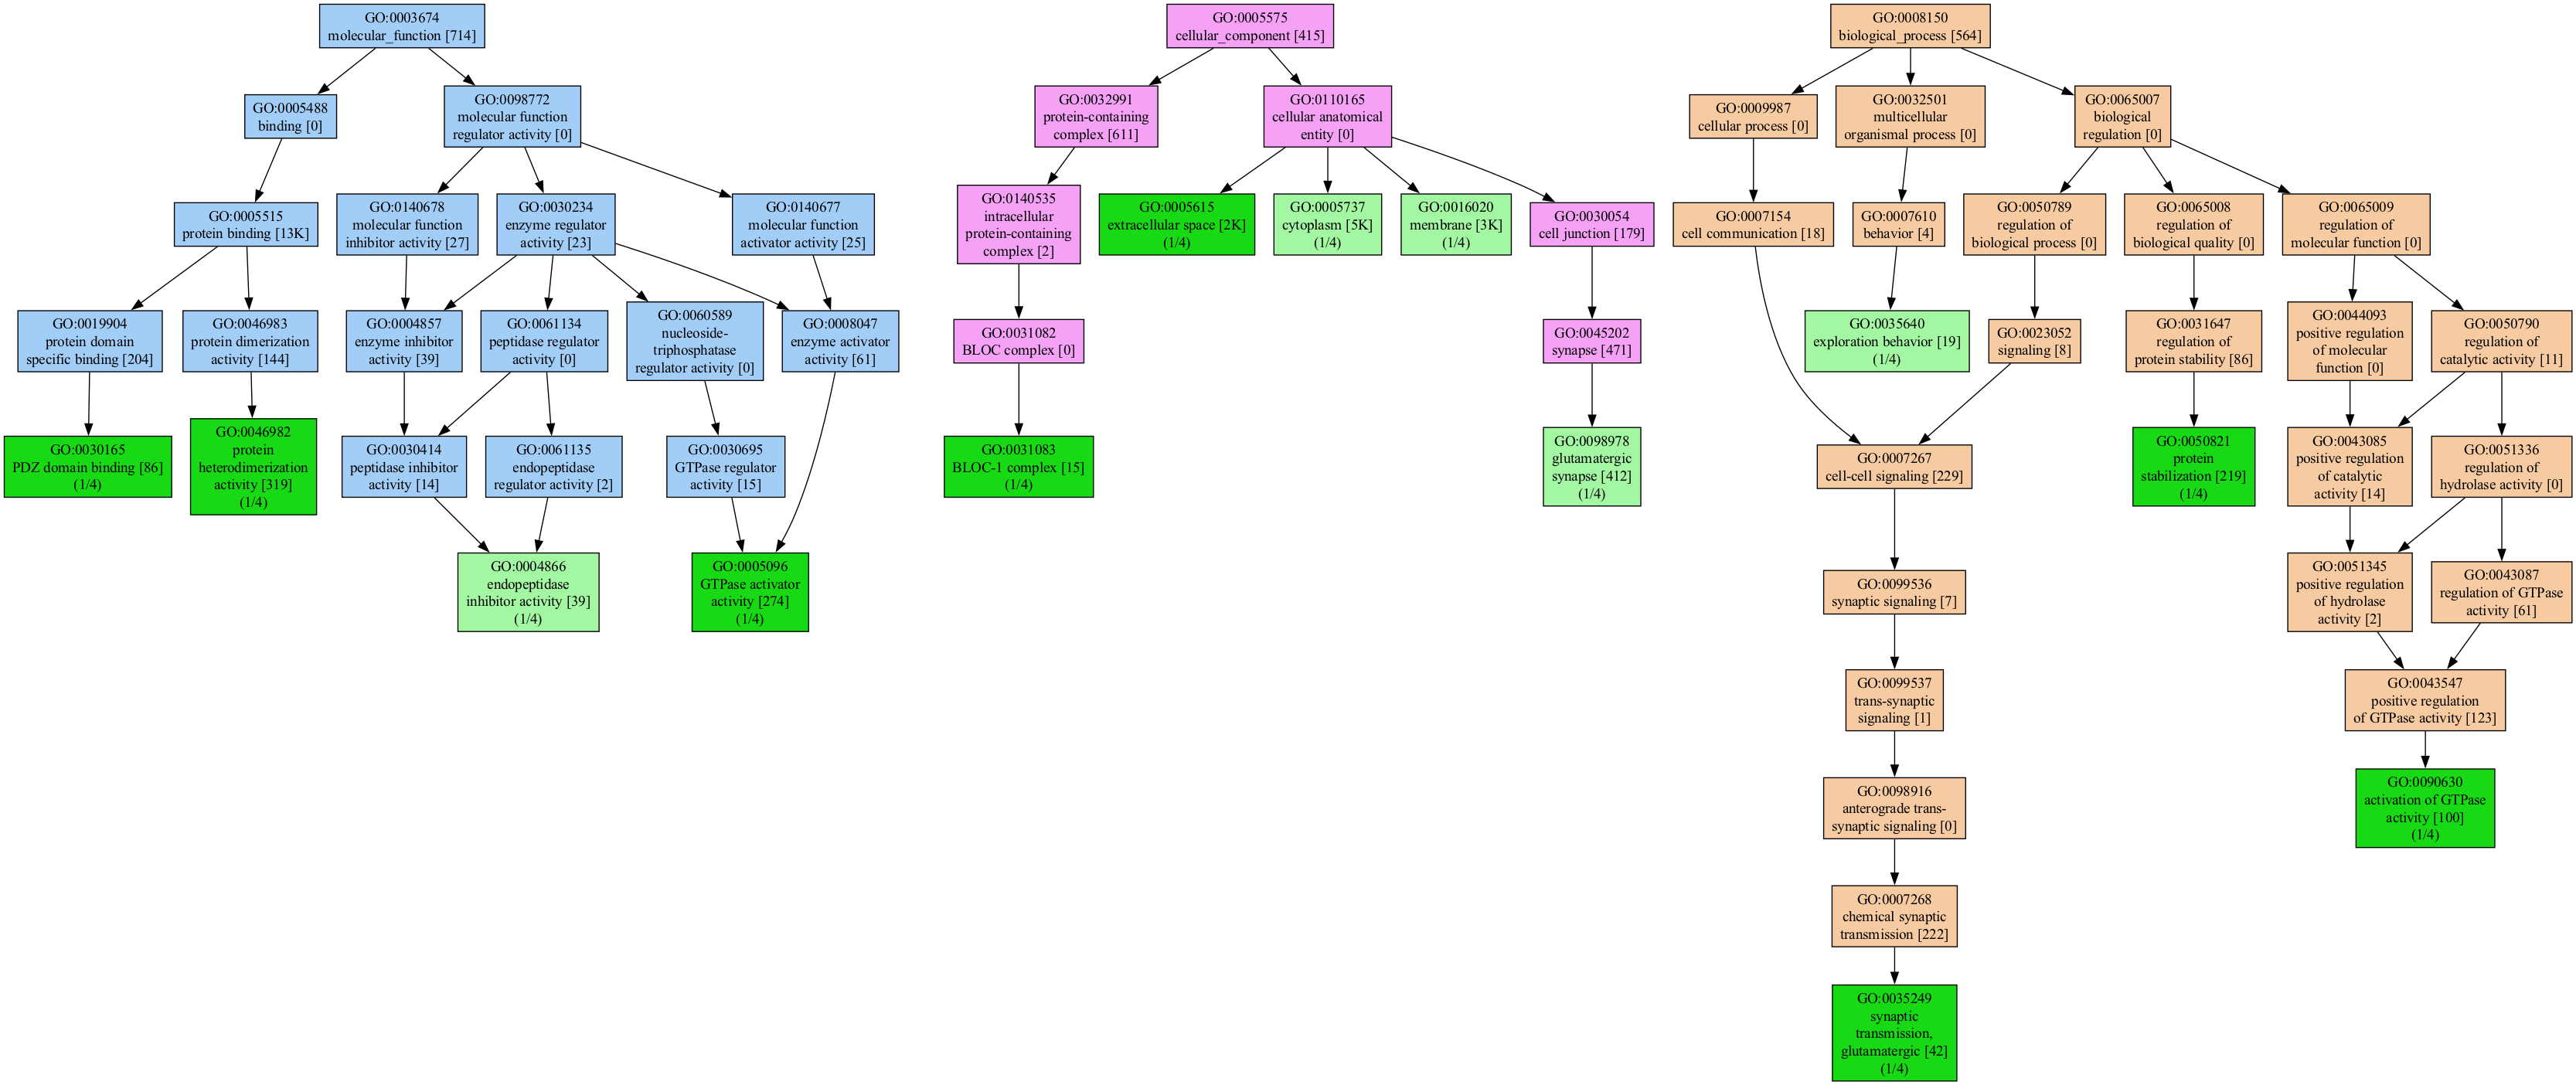
Node Labeling
The labels in the graph carry additional information on the number of genes in the input that carry that function and are an indicator of the specificity of the function in the organism. For example, the label:
      GO:0004866
    endopeptidase
  inhibitor activity [39]
        (1/5)
The label indicates that the function endopeptidase inhibitor activity was seen as an annotation to 39 of all genes in the original association file (for humans, there are over 19K gene symbols). Thus, the [39] is a characteristic of annotation of the organism.
The (1/5) means that 1 out of 5 genes in the input list carry this annotation. Thus, the value is a characteristic of the input list. The mincov (minimum coverage) filter is applied to the coverage value to filter out functions under a threshold.
Node Coloring
The colors in the tree carry additional meaning:
- Light green nodes represent functions that are in the input list.
- Dark green nodes are functions present in the input and are leaf nodes in the terminology, the most granular annotation possible
A dark green means the term is a leaf node, the most specific annotation possible. In both cases, the green color indicates that the function was present in the input list.
Each subtree in a different GO category has a different color:
- Biological Process (BP)
- Molecular Function (MF)
- Cellular Component (CC)
The subtree coloring is meant to help you understand the level of detail and the specificity of the functional terms you visualize.
Numbers such as 1/4 mean how many genes in the input carry that function.
Reducing the tree size
The trees can get huge, even for a small number of genes.
One can greatly reduce the size of the graph by removing functions that are not well represented in the input list or by focusing the graph to contain only functions that match a pattern.
Setting the mincov to 2 or higher is often enough to simplify the graph to a manageable size.
The filtering conditions that users can apply are:
- a pattern that matches the Function columns
- a minimum Coverage that means the minimum number of genes that carry that function
- a GO subtree
Filters are applied during the annotation step and will filter the GO terms derived from the gene list.
In the Shiny interface, use the coverage filter to remove functions not well represented in the input list. Recall that coverage represents the number of genes in the input list that carry that function. You can see the counts for each annotation in the Function Annotations box as the first column.
Command line requirements
The graphviz software must be installed to generate images from the command line. You can install it via conda
conda install graphviz
or via apt or brew.
Those unable to install the graphviz package can save the output as a .dot file:
genescape tree --test -o output.dot
Then use an online tool like viz-js to visualize the graph.
genescape tree
We packaged test data with the software so you can test it like so:
genescape tree --test
Which will generate a tree visualization of the test data.
Reducing the graph size
We can pass the tree visualizer a list of genes or a list of GO IDs, or even a mix of both.
We run the tree command to visualize the relationships between the GO terms that include all coverages:
genescape tree genes.txt --mincov 1
The resulting functional graph might be huge for many (most) gene lists.
The software will try to find a reasonable coverage threshold for the input genes if no coverage is specified.

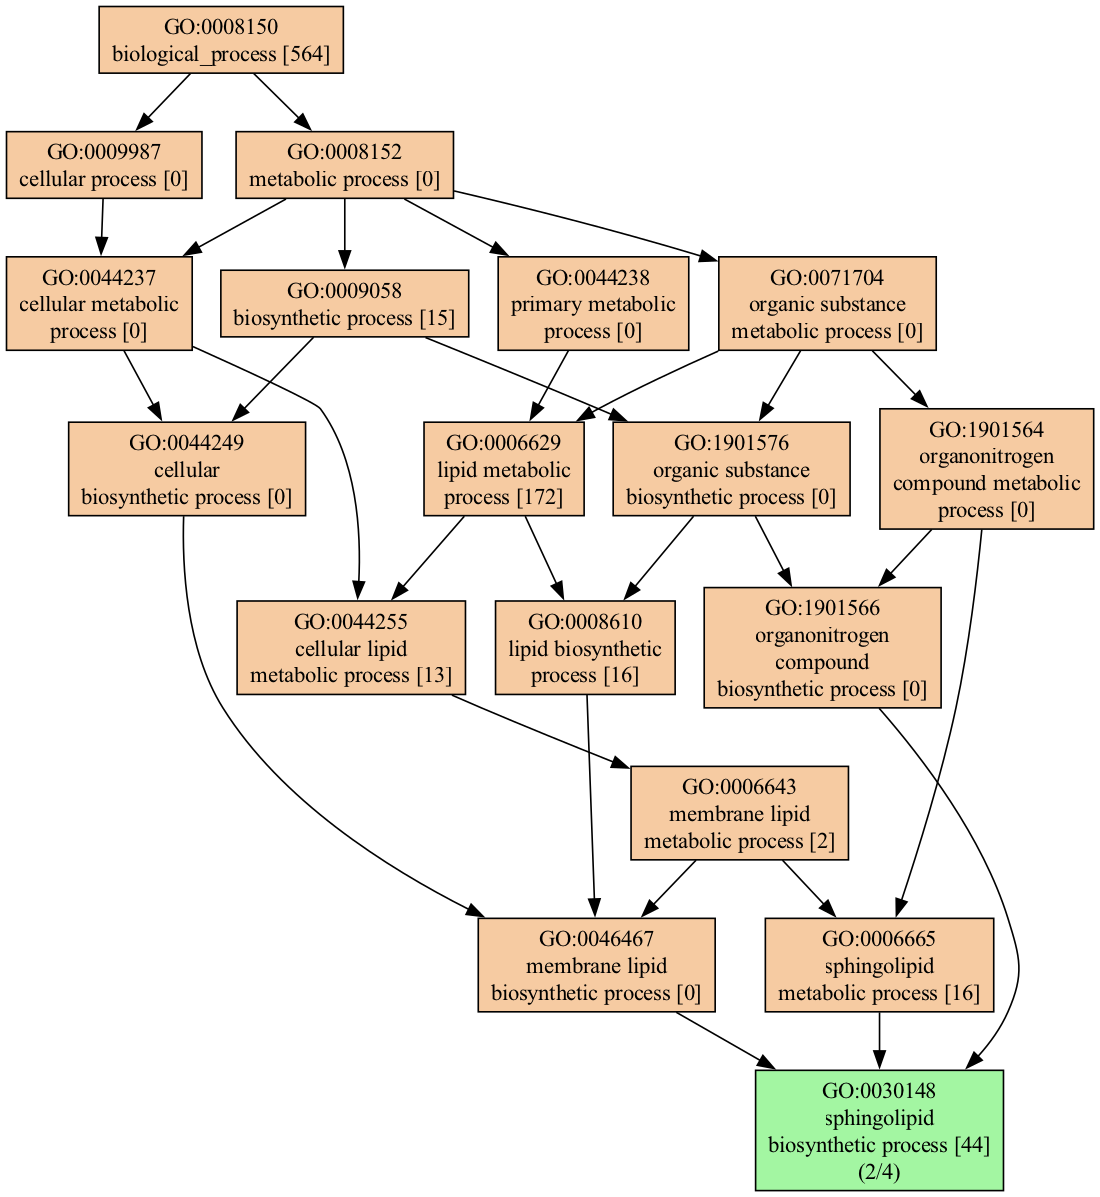
We can narrow down the visualization in multiple ways; for example, we can select only terms that match the word lipid :
genescape tree -m lipid --mincov 2 genes.txt
When filtered as shown above, the output is much more manageable:
genetrack annotation
The annotator operates on gene names. Suppose you have a list of gene names in the format:
Cyp1a1
Sphk2
Sptlc2
Smpd3
The command:
genescape annotate genelist.txt
will produce the output:
Coverage,Function,GO,Genes
3,protein binding,GO:0005515,CYP1A1|SMPD3|SPHK2
2,cytoplasm,GO:0005737,SMPD3|SPHK2
2,mitochondrial inner membrane,GO:0005743,CYP1A1|SPHK2
2,endoplasmic reticulum membrane,GO:0005789,CYP1A1|SPTLC2
2,sphingolipid biosynthetic process,GO:0030148,SPHK2|SPTLC2
2,intracellular membrane-bounded organelle,GO:0043231,CYP1A1|SPHK2
2,sphingosine biosynthetic process,GO:0046512,SPHK2|SPTLC2
genescape build
The software is currently packaged indices for a number of organisms.
To build an index for a different organism, download the GAF association file from the Gene Ontology website.
To build the new index use:
genescape build --gaf mydata.gaf.gz --obo go.basic.gz -i mydata.index.gz
To use the custom index, pass the -i (--index) option to any of the commands, web, tree and annotate like so:
genescape web --index mydata.index.gz
See the --help for more options.
Odds and ends
It is possible to mix gene and ontology terms. The following is a valid input:
GO:0005488
GO:0005515
Cyp1a1
Sphk2
Sptlc2
Testing
Tests are run via a Makefile as:
make test
Additional customizations
The software can be customized by creating a copy of the config.toml file and setting the GENESCAPE_CONFIG environment variable to point to the new configuration file.
In this file the lines that have an index type will be used to build the dropdown menu in the web interface.
Contributing
See CONTRIBUTING.md for information on how to contribute to the development of GeneScape.
Citation:
@article{GeneScape,
author = {Albert, Istvan},
doi = {10.21105/joss.06624},
journal = {Journal of Open Source Software},
month = jun,
number = {98},
pages = {6624},
title = {{GeneScape: A Python package for gene ontology visualization}},
url = {https://joss.theoj.org/papers/10.21105/joss.06624},
volume = {9},
year = {2024}
}
License
genescape is distributed under the terms of the MIT license.


Download files
Download the file for your platform. If you're not sure which to choose, learn more about installing packages.
Source Distribution
Built Distribution
Filter files by name, interpreter, ABI, and platform.
If you're not sure about the file name format, learn more about wheel file names.
Copy a direct link to the current filters
File details
Details for the file genescape-1.0.6.tar.gz.
File metadata
- Download URL: genescape-1.0.6.tar.gz
- Upload date:
- Size: 39.4 MB
- Tags: Source
- Uploaded using Trusted Publishing? No
- Uploaded via: python-httpx/0.27.0
File hashes
| Algorithm | Hash digest | |
|---|---|---|
| SHA256 |
7b6702ef9cc1de6e0c86686d296b594ae5b075474704c32147333f8a7ae396e5
|
|
| MD5 |
45b8d62f4d39d847361170c1583ca233
|
|
| BLAKE2b-256 |
4fb5adf05355a418c09f290ea066dd1e9839e9acea55642b69d20c960e20016c
|
File details
Details for the file genescape-1.0.6-py3-none-any.whl.
File metadata
- Download URL: genescape-1.0.6-py3-none-any.whl
- Upload date:
- Size: 39.3 MB
- Tags: Python 3
- Uploaded using Trusted Publishing? No
- Uploaded via: python-httpx/0.27.0
File hashes
| Algorithm | Hash digest | |
|---|---|---|
| SHA256 |
12b3a54987cedd55a0c58b0093e254c2ca3af0d2e67568d42231ff6f7f367943
|
|
| MD5 |
cf5837adc02656fab062650ec3a72d26
|
|
| BLAKE2b-256 |
86666f0903adeb93e60b5a26ed09a69ae71f92883915d8e838f815d00383aadd
|


