A library for visualizing genetic algorithm lineages

Project description
Genetic Algorithm Lineage Visualizer
A Python library for managing and visualizing the evolution of populations in genetic algorithms. The GeneticAnalyzer library tracks individuals, their lineage through crossovers and mutations, and provides intuitive visualizations of the family tree. This tool is perfect for understanding and presenting the evolutionary process.
Note: The GeneticAnalyzer library uses graphviz to generate graphs, so make sure you have it installed and configured correctly. Refer to the Graphviz Installation Guide for platform-specific instructions.
Features
- Track Lineage: Log individuals, parental relationships, and mutations across generations.
- Visualize Family Tree: Generate a graph of the population's lineage to trace genetic evolution.
- Highlight Best Individuals: Mark the highest-performing individual and trace their ancestry.
- Customizable Workflows: Integrate with any fitness function, mutation, or crossover mechanism.
Installation
Using pip
pip install geneticanalyzer
Manually
-
Clone the repository:
git clone https://github.com/MemerGamer/GeneticAnalyzer.git
cd GeneticAnalyzer
-
Install dependencies:
pip install -r requirements.txt
-
Install Graphviz (required by
pygraphviz):Refer to the Graphviz Installation Guide for platform-specific instructions.
Usage
Overview
The GeneticAnalyzer class provides an easy-to-use interface to track the population's evolution and visualize its lineage. The main methods include:
add_individual: Add an individual with optional parent relationships and mutation details.visualize_tree: Generate a graphical representation of the population's lineage.plot_fitness_over_generations: Plot the average fitness across generations.
Example Usage
See examples in the GeneticAnalyzerExamples repository.
Below is an example of using GeneticAnalyzer in a Python script to track and visualize population evolution.
Example Script
from geneticanalyzer import GeneticAnalyzer

# Initialize the GeneticAnalyzer
analyzer = GeneticAnalyzer()

# Add individuals to the population
individual_1 = {"genes": [1, 0, 1, 1, 0], "fitness": 3.0}
individual_2 = {"genes": [0, 1, 0, 1, 1], "fitness": 2.5}
id_1 = analyzer.add_individual(individual_1, generation=0)
id_2 = analyzer.add_individual(individual_2, generation=0)

# Create a child via crossover and mutation
child = {"genes": [1, 1, 1, 1, 0], "fitness": 4.0}
child_id = analyzer.add_individual(child, parents=[id_1, id_2], mutation_info="Bit flip", generation=1)

# Visualize the family tree
analyzer.visualize_tree(highlight_best=child_id)

# Plot fitness over generations
analyzer.plot_fitness_over_generations()
Visualization Output
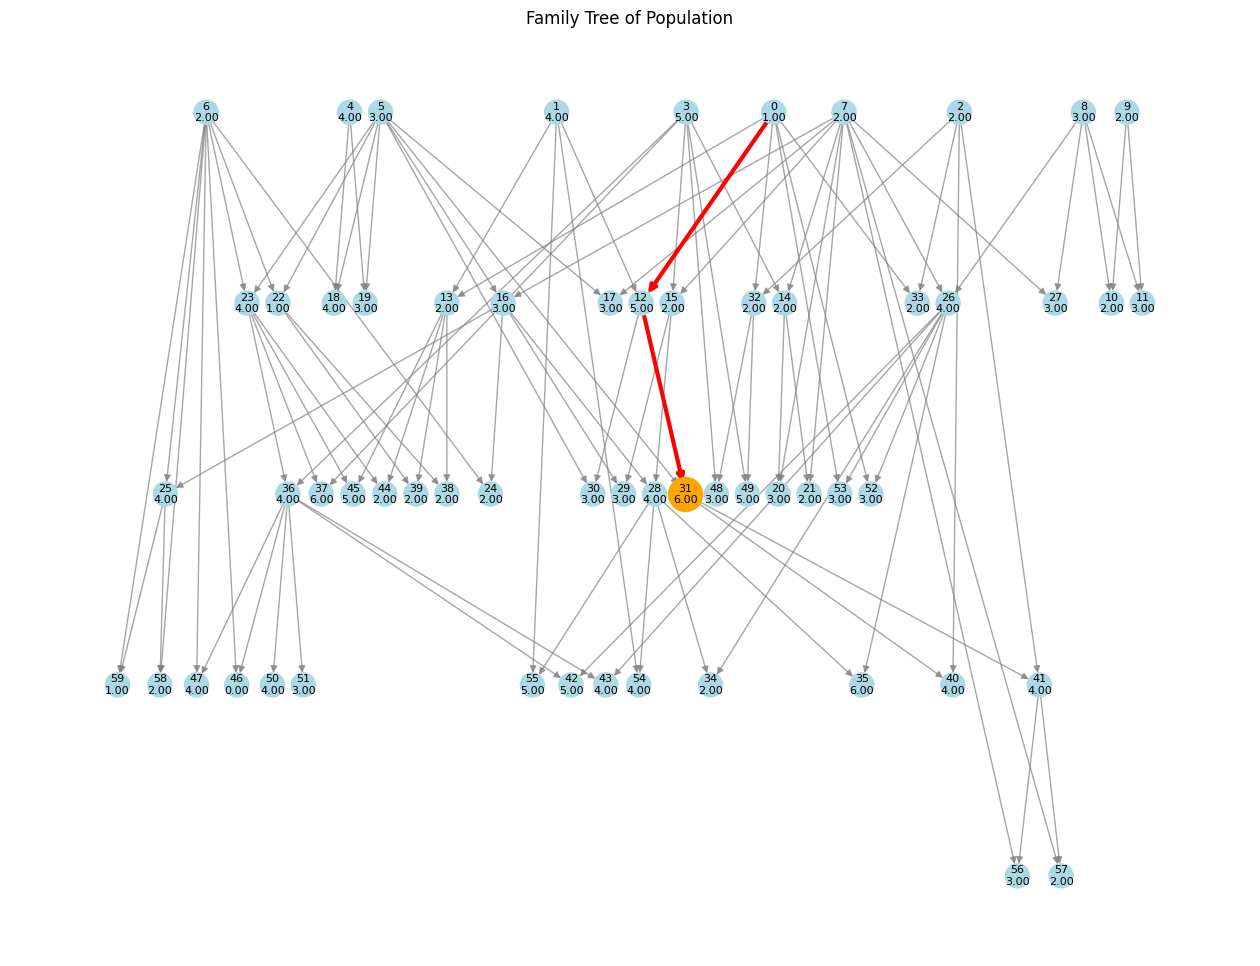
-
Family Tree: A directed graph showing the lineage of individuals, with:
- Nodes representing individuals (labeled with fitness scores).
- Edges representing parent-child relationships via crossover or mutation.
- Best individual highlighted in orange.
- Lineage path traced in red.
-
Fitness Plot: A line graph showing the average fitness of the population over generations.
Key Methods
GeneticAnalyzer.add_individual
Adds an individual to the population and records relationships.
| Parameter | Type | Description |
|---|---|---|
individual |
dict |
Contains genes (list) and fitness (float). |
parents |
list (optional) |
List of parent IDs. |
mutation_info |
str (optional) |
Description of mutation applied. |
generation |
int (optional) |
Generation to which this individual belongs. Default: 0. |
Returns the unique ID of the individual.
GeneticAnalyzer.visualize_tree
Generates a visual representation of the family tree.
| Parameter | Type | Description |
|---|---|---|
highlight_best |
int (optional) |
ID of the best individual to highlight in orange. |
layout |
str (optional) |
Layout style ("dot", "spring", "circular", "random"). Default: "dot". |
GeneticAnalyzer.plot_fitness_over_generations
Plots the average fitness of the population across generations.
No parameters required.
Advanced Customization
-
Fitness Function:
Replace the fitness function to evaluate individuals based on your custom criteria.def fitness_function(individual): return sum(individual) # Example: maximize the sum of binary genes
-
Mutation:
Modify the mutation mechanism to suit your requirements.def mutate(individual, mutation_rate=0.1): for i in range(len(individual)): if random.random() < mutation_rate: individual[i] = 1 - individual[i] # Flip binary bit return individual
-
Crossover:
Customize the crossover strategy to combine parent genes.def crossover(parent1, parent2): point = random.randint(1, len(parent1) - 1) return parent1[:point] + parent2[point:], parent2[:point] + parent1[point:]
Visualization Notes
- Node Colors: Nodes are colored dynamically based on fitness scores (normalized to a colormap).
- Edge Colors:
- Blue: Crossover relationships.
- Purple: Mutations.
- Best Individual:
- Highlighted in orange.
- Lineage traced in red from the root (oldest ancestor) to the individual.
Requirements
-
Python 3.7 or higher
-
Libraries:
matplotlibnetworkxpygraphvizscipy
-
Graphviz: Ensure Graphviz is installed on your system.
Star History

License
This project is licensed under the GPLv3 License. See the LICENSE file for details.
Author
Developed by Kovács Bálint-Hunor (MemerGamer). Contributions and suggestions are welcome!


Download files
Download the file for your platform. If you're not sure which to choose, learn more about installing packages.
Source Distribution
Built Distribution
Filter files by name, interpreter, ABI, and platform.
If you're not sure about the file name format, learn more about wheel file names.
Copy a direct link to the current filters
File details
Details for the file geneticanalyzer-1.1.7.tar.gz.
File metadata
- Download URL: geneticanalyzer-1.1.7.tar.gz
- Upload date:
- Size: 18.8 kB
- Tags: Source
- Uploaded using Trusted Publishing? No
- Uploaded via: twine/6.0.1 CPython/3.13.1
File hashes
| Algorithm | Hash digest | |
|---|---|---|
| SHA256 |
d827cb55cd24ab8a64b7f5421811fdde1cb92c9bd370ca5298640be9e859900e
|
|
| MD5 |
55193ac12c4579e839b18f762b9253dd
|
|
| BLAKE2b-256 |
260377c66516e3a877970a7329adef6d79c3636a858877ac94787f002c7a6936
|
File details
Details for the file geneticanalyzer-1.1.7-py3-none-any.whl.
File metadata
- Download URL: geneticanalyzer-1.1.7-py3-none-any.whl
- Upload date:
- Size: 19.1 kB
- Tags: Python 3
- Uploaded using Trusted Publishing? No
- Uploaded via: twine/6.0.1 CPython/3.13.1
File hashes
| Algorithm | Hash digest | |
|---|---|---|
| SHA256 |
e3200ec585cfe2746ae02f7343a31e87de76c655897bb851497d931b555630a5
|
|
| MD5 |
0687c8c507538f201495ffc420a104c2
|
|
| BLAKE2b-256 |
adb975f14231a46ef801cf9d0b36115eae43f37f98d4b23554831a1b147b451d
|


