Python SDK for the Geneva Forecasting Engine API

Project description
Geneva Forecast
Time-Series Forecasting & Demand Planning API
Powered by the Geneva Forecasting Engine, by RoadMap Technologies


Geneva Forecast is the official Python SDK for the Geneva Forecasting Engine: a high-performance time series API with automated model selection, conformal prediction intervals, and built-in chart generation. Forecast any time series in 3 lines of Python.
Forecast any time series with a single function call: model selection, accuracy metrics, and prediction intervals included.
Why Geneva Forecast?
Free to Get Started, No Credit Card Required
The Geneva API is free with 1,000 forecasts per month. Sign up at the Developer Portal, generate your API key, and start forecasting in minutes. No trial periods, no paywalls, no surprises.
Automated Model Selection
The Geneva Expert System evaluates all 10 forecasting methods against your data (exponential smoothing, Holt-Winters, regression curves, Croston) and selects the best fit automatically. Every result includes real accuracy metrics (MAD, MAPE, RMSE) and calibrated prediction intervals.
Built-In Visualization
Generate a professional forecast chart with a single function call: historical data, forecast line, and shaded prediction interval bands, with optional calendar date labels and file export. No extra dependencies required.
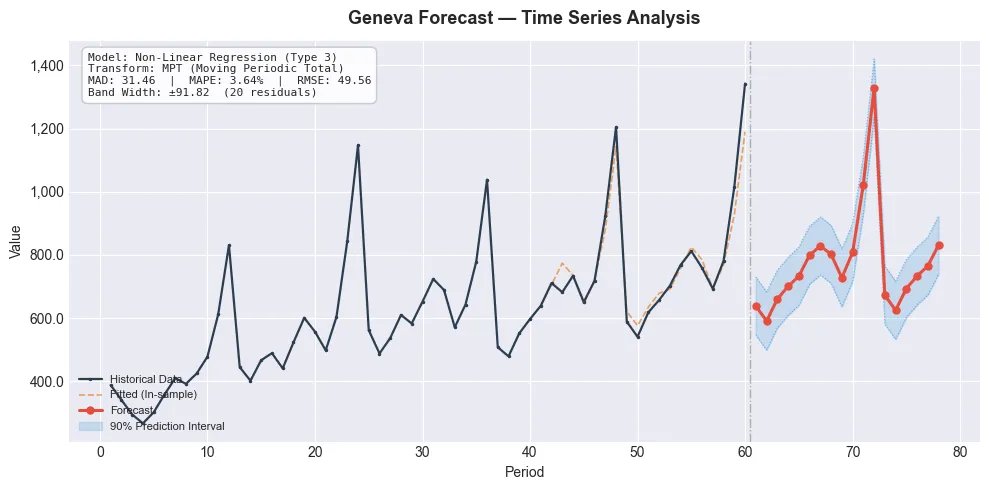
Example output from plot_forecast(): historical data, forecast line, and confidence interval bands
Requirements
| Requirement | Details |
|---|---|
| Python | 3.9 or later |
| API Key | Free, sign up at portal.roadmap-tech.com |
Security: Your API key should be stored as an environment variable, never hardcoded in source files.
Installation
pip install geneva-forecast
Quick Start
from geneva_forecast import GenevaClient

client = GenevaClient(
    api_url="https://api.roadmap-tech.com",
    api_key="gva_your_api_key_here",
)

# Monthly sales data (6 years)
monthly_sales = [
    112.0, 118.4, 132.1, 124.3, 121.1, 140.2,
    148.9, 153.7, 136.2, 119.0, 104.0, 118.5,
    121.3, 129.8, 138.5, 146.7, 128.4, 155.3,
    162.8, 149.1, 141.7, 119.5, 108.2, 126.3,
    133.9, 142.7, 156.1, 137.8, 145.2, 161.4,
    178.3, 168.0, 149.5, 125.3, 113.7, 132.8,
    139.5, 155.8, 148.2, 163.4, 152.7, 175.9,
    194.1, 181.3, 162.8, 140.6, 129.3, 148.7,
    157.2, 149.8, 171.6, 158.3, 168.9, 189.4,
    210.7, 195.2, 174.3, 153.1, 141.8, 163.9,
    172.4, 181.9, 195.7, 178.3, 183.5, 204.6,
    226.3, 213.8, 188.7, 165.4, 155.2, 179.8,
]

result = client.forecast(
    data=monthly_sales,
    horizon=12,
    wave_periods=[12],
)

for point in result.forecast:
    print(f"  Period {point.period}: {point.value:.2f}")

print(f"Model: {result.model_info.method_name}")
print(f"MAPE:  {result.metrics.mape:.2f}%")
The client can also be used as a context manager:
with GenevaClient(api_url="https://api.roadmap-tech.com", api_key="gva_...") as client:
    result = client.forecast(data=monthly_sales, horizon=12)
Prediction Intervals
Get conformal prediction intervals by setting confidence_level:
result = client.forecast(
    data=monthly_sales,
    horizon=12,
    confidence_level=0.95,
    include=["forecast", "prediction_intervals", "metrics", "model_info"],
)

for pt in result.prediction_intervals:
    print(f"  Period {pt.period}: {pt.forecast:.2f}  [{pt.lower:.2f}, {pt.upper:.2f}]")
Visualization
Built-in charting with no extra dependencies:
from geneva_forecast.plot import plot_forecast

result = client.forecast(
    data=monthly_sales,
    horizon=12,
    confidence_level=0.95,
    include=["forecast", "fitted", "prediction_intervals", "metrics", "model_info"],
)

# One-liner chart with historical data, fitted values, forecast, and prediction intervals
plot_forecast(monthly_sales, result)

# Calendar date labels on x-axis
plot_forecast(monthly_sales, result, start_date="2020-01-01", freq="MS")
# Supported frequencies: "MS" (monthly), "QS" (quarterly), "W" (weekly),
#                        "D" (daily), "H" (hourly), "YS" (yearly)

# Save to file
plot_forecast(monthly_sales, result, show=False, save="forecast.png")
Parameters
Core Parameters
| Parameter | Type | Default | Description |
|---|---|---|---|
data |
list[float] |
required | Time series values (min 1, max 10,000) |
horizon |
int | None |
None |
Periods ahead to forecast. Default: one full seasonal cycle |
method |
int | None |
None |
Forecasting method (0–9). None = Expert System auto-select |
wave_periods |
list[int] |
[12] |
Seasonal cycle lengths (e.g. [12] monthly, [52] weekly, [4] quarterly) |
confidence_level |
float | None |
None |
Prediction interval confidence (e.g. 0.95 for 95%) |
holdout_periods |
int | None |
None |
Hold out the last N data points for out-of-sample evaluation. Mutually exclusive with holdout_ratio |
holdout_ratio |
float | None |
None |
Fraction of data reserved for evaluation (e.g. 0.2 = 20%). Mutually exclusive with holdout_periods. Engine default: 0.333 (33%) |
strip_leading_zeros |
bool |
True |
Remove leading zeros before forecasting. Set to False for intermittent demand (Croston) where zeros carry meaning |
include |
list[str] |
["forecast", "metrics", "model_info"] |
Response sections to return |
Advanced Parameters
| Parameter | Type | Default | Description |
|---|---|---|---|
seasonal_transform |
int |
0 |
Seasonal transform: 0 = None, 1 = Seasonal decomposition, 2 = MPT (Moving Periodic Total) |
smoothing |
bool |
False |
Apply 3-period median smoothing to the input data before forecasting |
history_length |
int | None |
None |
Override how many data points to use. Default: all provided data. Use to limit to the most recent N observations |
Available include Sections
"forecast" · "fitted" · "seasonal_factors" · "metrics" · "model_info" · "prediction_intervals" · "trials" · "all"
Set
method=None(the default) to let the Expert System automatically select the best-performing model for your data.
Forecasting Methods
| ID | Method | Best For |
|---|---|---|
| 0 | Linear Regression | Steady linear growth or decline |
| 1–5 | Non-Linear Regression (5 curve types) | Exponential, s-curve, power trends |
| 6 | Simple Exponential Smoothing | Stable, level series |
| 7 | Double Exponential Smoothing (Holt) | Trending series without seasonality |
| 8 | Holt-Winters (Seasonal) | Trending + seasonal series |
| 9 | Croston (Intermittent Demand) | Sporadic, zero-inflated series |
Holdout & Backtesting
Use holdout_periods or holdout_ratio to reserve data for out-of-sample evaluation. The engine trains on the remaining data and reports accuracy metrics (MAD, MAPE, RMSE) against the held-out portion.
# Hold out the last 12 months for evaluation
result = client.forecast(
    data=monthly_sales,
    horizon=12,
    wave_periods=[12],
    holdout_periods=12,
)
print(f"Out-of-sample MAPE: {result.metrics.mape:.2f}%")
print(f"Model selected: {result.model_info.method_name}")

# Hold out 20% of data using a ratio
result = client.forecast(
    data=monthly_sales,
    horizon=12,
    holdout_ratio=0.2,
)
Intermittent Demand (Croston)
For series with sporadic demand and meaningful zero values, disable strip_leading_zeros and use method 9:
# Spare parts demand — zeros represent real zero-demand periods
result = client.forecast(
    data=[0, 0, 5, 0, 0, 0, 3, 0, 0, 7, 0, 0, 0, 0, 2, 0, 0, 0, 4, 0, 0, 0, 0, 6],
    horizon=12,
    method=9,
    strip_leading_zeros=False,
    include=["forecast", "metrics", "model_info"],
)
print(f"Method: {result.model_info.method_name}")
Response Models
The ForecastResult object returned by client.forecast() contains typed fields based on what you requested in the include parameter.
ForecastResult
| Field | Type | Requires include |
Description |
|---|---|---|---|
forecast |
list[ForecastPoint] |
"forecast" |
Forecasted values. Each point has .period and .value |
fitted |
list[FittedPoint] |
"fitted" |
In-sample fitted values. Each point has .period and .value |
seasonal_factors |
list[SeasonalPoint] |
"seasonal_factors" |
Seasonal decomposition. Each point has .period, .seasonal_factor, .smoothed_seasonal_factor |
metrics |
Metrics |
"metrics" |
Accuracy metrics: .mad, .mape, .rmse |
model_info |
ModelInfo |
"model_info" |
Selected model: .method_id, .method_name, .transform_id, .transform_name, .smoothing |
trials |
list[TrialInfo] |
"trials" |
All models evaluated by the Expert System, ranked by accuracy |
prediction_intervals |
list[ConformalForecastPoint] |
"prediction_intervals" |
Each point has .period, .forecast, .lower, .upper |
prediction_interval_info |
ConformalPredictionInfo |
"prediction_intervals" |
Metadata: .confidence_level, .calibration_residuals, .interval_width |
BatchForecastResult
| Field | Type | Description |
|---|---|---|
results |
list[SeriesResult] |
One result per input series. Each has .id, .status, .forecast (a ForecastResult), .error |
total_series |
int |
Total number of series submitted |
successful |
int |
Number that completed successfully |
failed |
int |
Number that returned errors |
elapsed_ms |
float |
Total wall-clock time in milliseconds |
Expert System Diagnostics
When the Expert System selects a model, it evaluates all 10 methods across multiple transforms. Use include=["trials"] to see every model evaluated and compare their accuracy:
result = client.forecast(
    data=monthly_sales,
    horizon=12,
    wave_periods=[12],
    include=["forecast", "metrics", "model_info", "trials"],
)

print(f"Winner: {result.model_info.method_name} (MAPE: {result.metrics.mape:.2f}%)\n")

print("All trials evaluated:")
for trial in result.trials[:5]:
    print(f"  #{trial.trial_number}: {trial.method_name} "
          f"({trial.transform_name}, MAPE={trial.mape:.2f}%)")
Batch Forecasting
Forecast multiple time series in a single request. Each series supports all the same parameters as a single forecast (method, wave_periods, holdout_periods, strip_leading_zeros, etc.):
result = client.batch_forecast(series=[
    {
        # Seasonal electronics sales — 2 years of monthly data
        "id": "electronics_na",
        "data": [
            142, 136, 151, 148, 155, 162, 178, 185, 194, 210, 245, 280,
            158, 149, 165, 161, 170, 179, 196, 204, 213, 232, 268, 310,
        ],
        "horizon": 12,
        "wave_periods": [12],
    },
    {
        # SaaS subscription revenue — steady growth, quarterly data
        "id": "saas_mrr",
        "data": [
            45.2, 48.1, 52.3, 55.8, 59.4, 63.1, 67.8, 72.5,
            78.2, 83.6, 89.1, 95.3, 101.8, 108.4, 115.2, 122.7,
        ],
        "horizon": 8,
        "wave_periods": [4],
        "holdout_periods": 4,
    },
    {
        # Spare parts demand — intermittent, zeros are meaningful
        "id": "spare_parts_valve",
        "data": [
            0, 0, 3, 0, 0, 0, 5, 0, 0, 2, 0, 0,
            0, 0, 4, 0, 0, 0, 7, 0, 0, 3, 0, 0,
        ],
        "horizon": 12,
        "method": 9,
        "strip_leading_zeros": False,
    },
])

print(f"Batch: {result.successful}/{result.total_series} succeeded in {result.elapsed_ms:.0f}ms\n")

for sr in result.results:
    if sr.status == "success":
        forecast = sr.forecast
        values = [f"{p.value:.1f}" for p in forecast.forecast[:6]]
        print(f"  [{sr.id}]")
        print(f"    Model:    {forecast.model_info.method_name}")
        print(f"    MAPE:     {forecast.metrics.mape:.2f}%")
        print(f"    Forecast: {', '.join(values)}{'...' if len(forecast.forecast) > 6 else ''}")
    else:
        print(f"  [{sr.id}] Error: {sr.error}")
Error Handling
from geneva_forecast import GenevaAPIError, GenevaConnectionError, GenevaTimeoutError

try:
    result = client.forecast(data=[1.0, 2.0, 3.0])
except GenevaAPIError as e:
    print(f"API error {e.status_code}: {e.message}")
except GenevaTimeoutError:
    print("Request timed out")
except GenevaConnectionError:
    print("Could not connect to the Geneva API")
Related Resources
| Resource | Description |
|---|---|
| Geneva Developer Portal | Free API keys, usage dashboard, and account management |
| Geneva MCP Server | Forecast directly from Claude, ChatGPT, Cursor, and Windsurf |
| Geneva API Documentation | Full API reference, parameter guides, and examples |
License
MIT License, Copyright 2026 RoadMap Technologies, Inc.
Release history Release notifications | RSS feed


Download files
Download the file for your platform. If you're not sure which to choose, learn more about installing packages.
Source Distribution
Built Distribution
Filter files by name, interpreter, ABI, and platform.
If you're not sure about the file name format, learn more about wheel file names.
Copy a direct link to the current filters
File details
Details for the file geneva_forecast-1.0.2.tar.gz.
File metadata
- Download URL: geneva_forecast-1.0.2.tar.gz
- Upload date:
- Size: 20.8 kB
- Tags: Source
- Uploaded using Trusted Publishing? No
- Uploaded via: twine/6.2.0 CPython/3.14.3
File hashes
| Algorithm | Hash digest | |
|---|---|---|
| SHA256 |
0b7a4197a643c4a27b8f13462771a7a10f6e591c8da55657ef3af1547b6f7769
|
|
| MD5 |
557d2ecea729928fa91d9242d53ede9e
|
|
| BLAKE2b-256 |
00ff54b502f64379971772ff600be9188f9b3297d39ad97e597eda389777c1e0
|
File details
Details for the file geneva_forecast-1.0.2-py3-none-any.whl.
File metadata
- Download URL: geneva_forecast-1.0.2-py3-none-any.whl
- Upload date:
- Size: 17.3 kB
- Tags: Python 3
- Uploaded using Trusted Publishing? No
- Uploaded via: twine/6.2.0 CPython/3.14.3
File hashes
| Algorithm | Hash digest | |
|---|---|---|
| SHA256 |
62e416665331b703669f1787833f9d8752250ac71e511fe15a43f69fdcaf8b4e
|
|
| MD5 |
1e2019d7524e22a8af7d187aa29172cc
|
|
| BLAKE2b-256 |
eaa2820c7dbca83263509f4c2e15ca6c3ea0a00dd9e7a92a1da3cac63639f990
|


