A Python library to easily visualize geospatial data of Morocco.

Project description
Welcome to geomaroc
A Python library to make working with geospatial data of Morocco easier.
- GitHub repo: https://github.com/AmineAndam04/geomaroc
- PyPI: https://pypi.org/project/geomaroc/
- Raw data: https://github.com/AmineAndam04/geomaroc-Raw-data
- R version: https://github.com/AmineAndam04/R-geomaroc
- CRAN: https://CRAN.R-project.org/package=geomaroc
Introduction
People who work in data science are seeing increased need to work with geospatial data, especially for visualization purposes (e.g. during the covid-19 pandemic).Geopandas is a very popular geospatial library in python that extends Pandas to allow spatial operations on geometrics types.
Working with geopands requires having access to coordinates of the items of our map (polygon coordinates), but having accesss to those coordinates is not an easy task.In fact, we often need the shapefiles in order to plot a map. Trying to find those shapefiles can be a long journey, especailly for someone with zero experience with geospatial data. Moreover, for someone interested in the geospatial data of Morocco, the majority of shapefiles available online are either of very poor quality, or they don't provide province-level,prefectue-level or district-level coordinates.Even if we manage to find the appropriate shapefiles, they usually come without the southern regions of Morocco.
Geomaroc helps the user get those coordinates easly.This library aims to fix these problem by:
 1. providing methods to automatically get the boundary coordinates to plot maps of Morocco **without having acces to shapefiles.**

 2. providing access to the coordinates of low-level administrative subdivisions (e.g. province, prefecture, districs).

 3. providing access to the complete map of  Morocco (including the southern regions of Morocco)
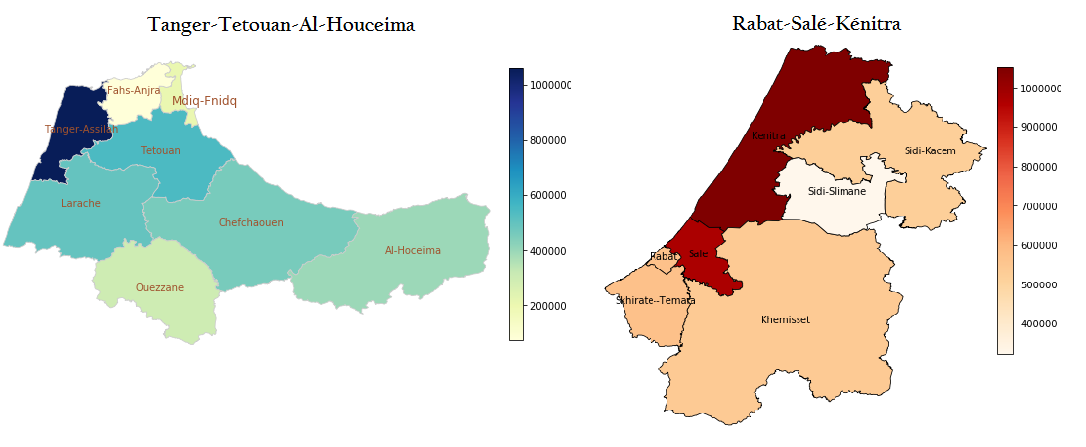
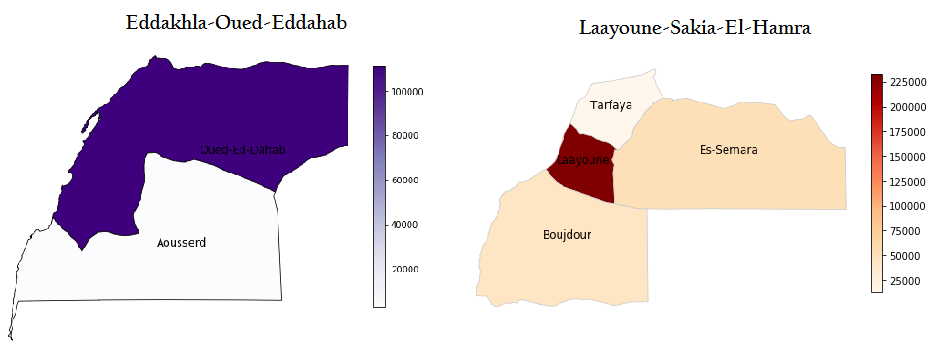
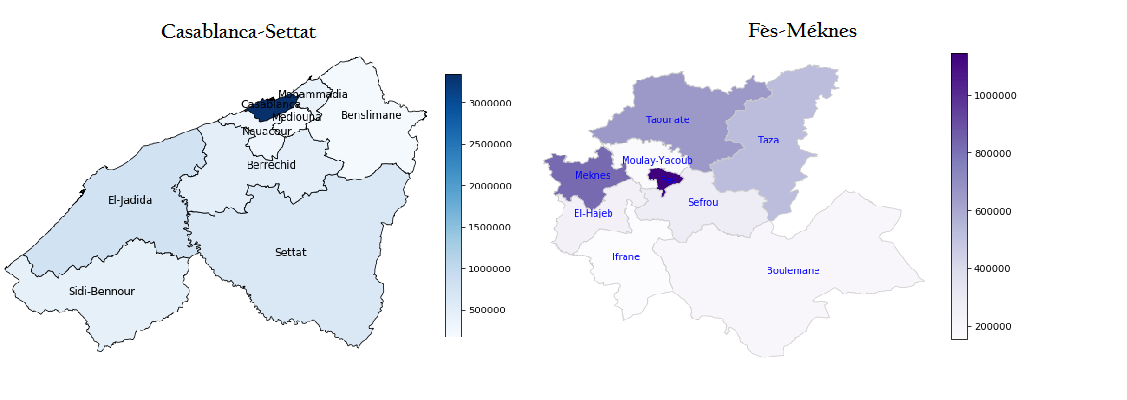
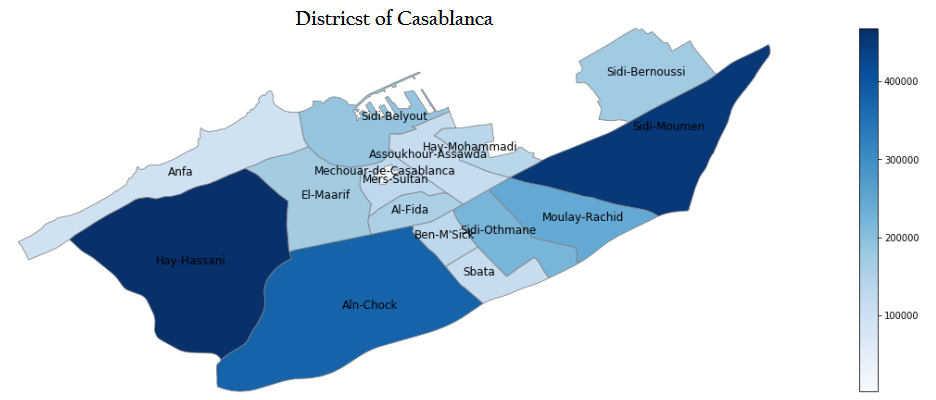
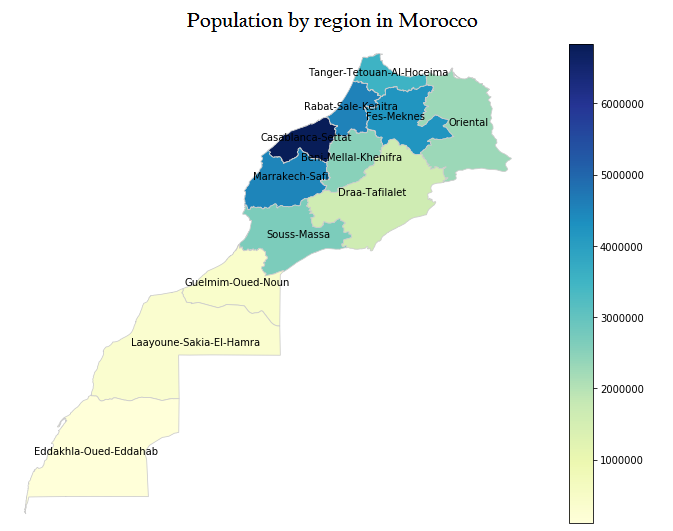
illustration:
To generate those plots go to Gallery
Requirements
geomaroc library needs the following packages :pandas, geopandas, shapely, json and importlib.
Install
pip install geomaroc
import geomaroc
Usage
- getRegion() :Helps to plot the shape of each region.
import geomaroc
## working with n_region
gp=geomaroc.getRegion("Casablanca-Settat")
gp.plot()
## working with id_region
gp=geomaroc.getRegion(id_region=6) # Attention!! don't write geomaroc.getRegion(6)
gp.plot()
- getMultiRegion() :Helps to plot the shape of multiple regions.
import geomaroc
## working with n_region
gp=geomaroc.getMultiRegion(["Casablanca-Settat",Draa-Tafilalet])
gp.plot()
## working with id_region
gp=geomaroc.getMultiRegion(id_region=[6,8])
gp.plot()
- getProvince() :Helps to plot the shape of provinces within a region.
import geomaroc
## working with n_region
gp=geomaroc.getProvince("Casablanca-Settat")
gp.plot()
## working with id_region
gp=geomaroc.getProvince(id_region=6)
gp.plot()
- getMultiProvince(): Helps to plot the shape of provinces in multiple regions.
import geomaroc
## working with n_region
gp=geomaroc.getMultiProvince(["Casablanca-Settat",Draa-Tafilalet])
gp.plot()
## working with id_region
gp=geomaroc.getMultiProvince(id_region=[6,8])
gp.plot()
- getDistrict(): Helps to plot the shape of districts within a province.
import geomaroc
## working with n_province
geomaroc.getDistrict("Tetouan")
gp.plot()
## working with id_province
gp=geomaroc.getProvince(id_region=571)
gp.plot()
- getMultiDistrict(): Helps to plot the shape of districts in multiple provinces.
import geomaroc
## working with n_province
gp=geomaroc.gp=geomaroc.getMultiDistrict(["Tetouan","Tanger-Assilah","Al-Hoceima"])
gp.plot()
## working with id_province
gp=geomaroc.geomaroc.getProvince(id_region=[571,51,511])
gp.plot()
- Regions() & Provinces() : Hepls to respect the notation and to get the id of each region and province
Notation
We adpoted this methode to work with names and id of regions,provinces and districts :
- replace "é" with "e"
- replace "è" with "e"
- replace " " with "-"
- replace "â" with "a"
So "Tanger-Tétouan-Al Hoceima" becomes "Tanger-Tetouan-Al-Hoceima" and "Drâa-Tafilalet" becomes "Drâa-Tafilalet"
Use geomaroc.Regions() and geomaroc.Provinces() to check the notations:
region=geomaroc.Regions()
region
{'Beni-Mellal-Khenifra': 5,
 'Casablanca-Settat': 6,
 'Draa-Tafilalet': 8,
 'Eddakhla-Oued-Eddahab': 12,
 'Fes-Meknes': 3,
 'Guelmim-Oued-Noun': 10,
 'Laayoune-Sakia-El-Hamra': 11,
 'Marrakech-Safi': 7,
 'Oriental': 2,
 'Rabat-Sale-Kenitra': 4,
 'Souss-Massa': 9,
 'Tanger-Tetouan-Al-Hoceima': 1}
import pandas as pd
provinces=geomaroc.Provinces()
province=pd.DataFrame(columns=["Region","Id_region","Province","Id_province"])
for i in range(len(provinces.keys())):
   for j in range(len(provinces[list(provinces.keys())[i]])):
       reg=list(provinces.keys())[i]
       prov=list(provinces[reg].keys())[j]
       province=province.append({"Region":reg,"Id_region":region[reg],"Province":prov,"Id_province":provinces[reg][prov]},ignore_index=True)
province
	Region	                 Id_region	Province	Id_province
0	Beni-Mellal-Khenifra	     5	     Khouribga	      311
1	Beni-Mellal-Khenifra	     5	     Khenifra	      301
2	Beni-Mellal-Khenifra	     5	     Azilal	      81
3	Beni-Mellal-Khenifra	     5	     Beni-Mellal	 91
4	Beni-Mellal-Khenifra	     5	     Fquih-Ben-Salah 255
...	...	...	...	...
70	Tanger-Tetouan-Al-Hoceima	1	     Mdiq-Fnidq	 573
71	Tanger-Tetouan-Al-Hoceima	1	     Ouezzane	      405
72	Tanger-Tetouan-Al-Hoceima	1	     Tanger-Assilah	 511
73	Tanger-Tetouan-Al-Hoceima	1	     Tetouan	      571
74	Tanger-Tetouan-Al-Hoceima	1	     Al-Hoceima	 51
Raw data
Visit geomaroc raw data
gallery


Download files
Download the file for your platform. If you're not sure which to choose, learn more about installing packages.
Source Distribution
Built Distribution
Filter files by name, interpreter, ABI, and platform.
If you're not sure about the file name format, learn more about wheel file names.
Copy a direct link to the current filters
File details
Details for the file geomaroc-1.0.3.tar.gz.
File metadata
- Download URL: geomaroc-1.0.3.tar.gz
- Upload date:
- Size: 12.3 MB
- Tags: Source
- Uploaded using Trusted Publishing? No
- Uploaded via: twine/4.0.2 CPython/3.9.13
File hashes
| Algorithm | Hash digest | |
|---|---|---|
| SHA256 |
f3ae67c2645db9e1487145118afc0d702669fc0f6c95c568358f394f3dc02606
|
|
| MD5 |
ceb98365e4ec5367c3690a47ea21859d
|
|
| BLAKE2b-256 |
ed24f56c27b47b1c264cbe73f452556a3d779c0fcfa42c94592d8d8cd731642c
|
File details
Details for the file geomaroc-1.0.3-py3-none-any.whl.
File metadata
- Download URL: geomaroc-1.0.3-py3-none-any.whl
- Upload date:
- Size: 12.3 MB
- Tags: Python 3
- Uploaded using Trusted Publishing? No
- Uploaded via: twine/4.0.2 CPython/3.9.13
File hashes
| Algorithm | Hash digest | |
|---|---|---|
| SHA256 |
30ecbfd9e1d46c5f50a91e5509c16f37cf0bf10cdf34b80309bf2f49f25f9921
|
|
| MD5 |
c1d8a487690e09a67720e0793e3df217
|
|
| BLAKE2b-256 |
78082c7de5de5e2f93ac6c3ca43768ea1e68863398edb01da9f25887d659b0c9
|


