A Python wrapper for the geoviz JavaScript library

Project description
geovizpy
geovizpy is a Python wrapper for the geoviz JavaScript library, designed to bring the power of D3.js-based thematic mapping to Python. It allows you to create high-quality, interactive maps directly from Python scripts or Jupyter notebooks.
This library is a wrapper around the geoviz library. For detailed information on the underlying mapping logic, please refer to the original geoviz documentation.
Features
- Simple, chainable API: Build complex maps by chaining intuitive methods.
- Variety of Map Types: Create choropleth, proportional symbol, typology, and other thematic maps.
- Interactive Controls: Add hover-to-expand controls for toggling layer visibility and exporting the map as SVG or PNG.
- Customizable: Extensive options to customize colors, legends, strokes, and more.
- Standalone HTML: Renders self-contained HTML files with no server required.
- Image Export: Save maps directly to PNG or SVG from Python (requires optional dependencies).
Installation
Standard Installation
You can install the core library using pip:
pip install geovizpy
Or install directly from the source repository:
pip install git+https://codeberg.org/fbxyz/geovizpy.git
For Image Export
To save maps as PNG or SVG files directly from Python, you need to install the optional export dependencies:
-
Install the extra dependencies:
pip install "geovizpy[export]"
-
Install Playwright's browser binaries:
playwright installOn Linux, you may also need to install host dependencies:
sudo playwright install-deps
Quick Start
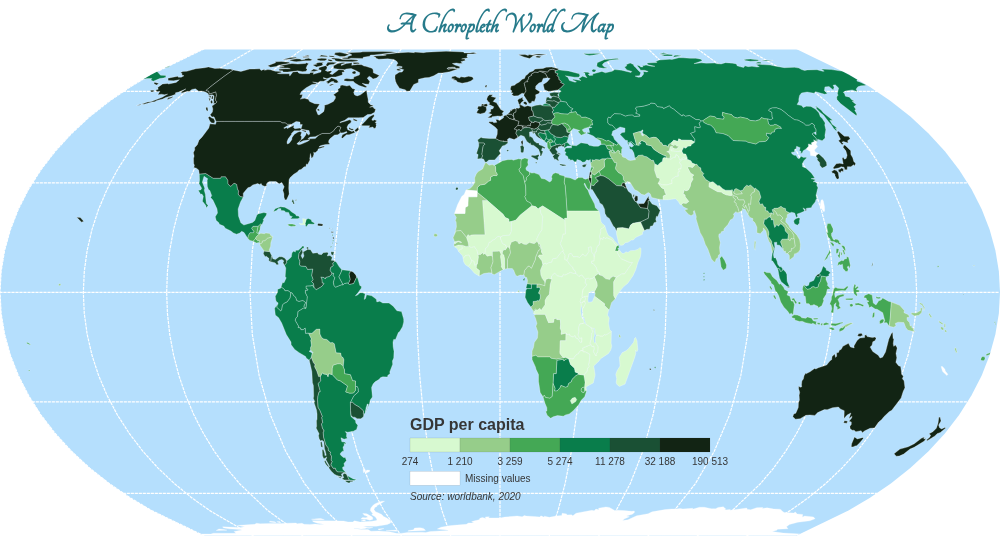
Here is a simple example of how to create a choropleth map:
from geovizpy import Geoviz
import json

# Load your GeoJSON data
# (Assuming 'world.json' is in a 'data' subdirectory)
with open("data/world.json") as f:
    world_data = json.load(f)

# Initialize the map
viz = Geoviz(projection="EqualEarth", width=800)

# Add layers
viz.outline()
viz.graticule()

# Add a choropleth layer
viz.choro(
    data=world_data,
    var="gdppc",
    colors="Blues",
    legend=True,
    leg_title="GDP per Capita"
)

# Add interactive controls
viz.add_layer_control(layers=["choropleth_gdp"])
viz.add_export_control()

# Save the map
viz.save("my_map.html")  # Renders an interactive HTML file
# viz.save("my_map.png")   # Renders a static PNG image (requires export dependencies)
Documentation
For more detailed information on all available methods and parameters, please see the full documentation.
Release history Release notifications | RSS feed


Download files
Download the file for your platform. If you're not sure which to choose, learn more about installing packages.
Source Distribution
Built Distribution
Filter files by name, interpreter, ABI, and platform.
If you're not sure about the file name format, learn more about wheel file names.
Copy a direct link to the current filters
File details
Details for the file geovizpy-0.1.6.tar.gz.
File metadata
- Download URL: geovizpy-0.1.6.tar.gz
- Upload date:
- Size: 11.3 kB
- Tags: Source
- Uploaded using Trusted Publishing? No
- Uploaded via: twine/6.2.0 CPython/3.12.12
File hashes
| Algorithm | Hash digest | |
|---|---|---|
| SHA256 |
2ac1b16fbe22cdae329da88f35611620c6c9e26940febf65894c4743c13a917f
|
|
| MD5 |
024cb6347731cf2b6fa256d6c2f2510d
|
|
| BLAKE2b-256 |
5581edd33ff09d1ab0cd21287326cd95bd0111d7bf651201da2773729a61e53e
|
File details
Details for the file geovizpy-0.1.6-py3-none-any.whl.
File metadata
- Download URL: geovizpy-0.1.6-py3-none-any.whl
- Upload date:
- Size: 11.6 kB
- Tags: Python 3
- Uploaded using Trusted Publishing? No
- Uploaded via: twine/6.2.0 CPython/3.12.12
File hashes
| Algorithm | Hash digest | |
|---|---|---|
| SHA256 |
aad3832d00453c0d5d11b805bc905a0cbab6d6f1415e2a22b312221ca1369dee
|
|
| MD5 |
06735a47336f60ace8a4efe87a135c25
|
|
| BLAKE2b-256 |
083dfe1a903b894aa4ea1029060ad85983dee65593daa5dc4acd8bff52fbcb6f
|


