



$ gitstats
📊 Generate insightful visual reports from Git.
📘 Documentation: gitstats.readthedocs.io 📊 GitStats Gallery: shenxianpeng.dev/gitstats/gallery/
Example
gitstats . generates this gitstats report:
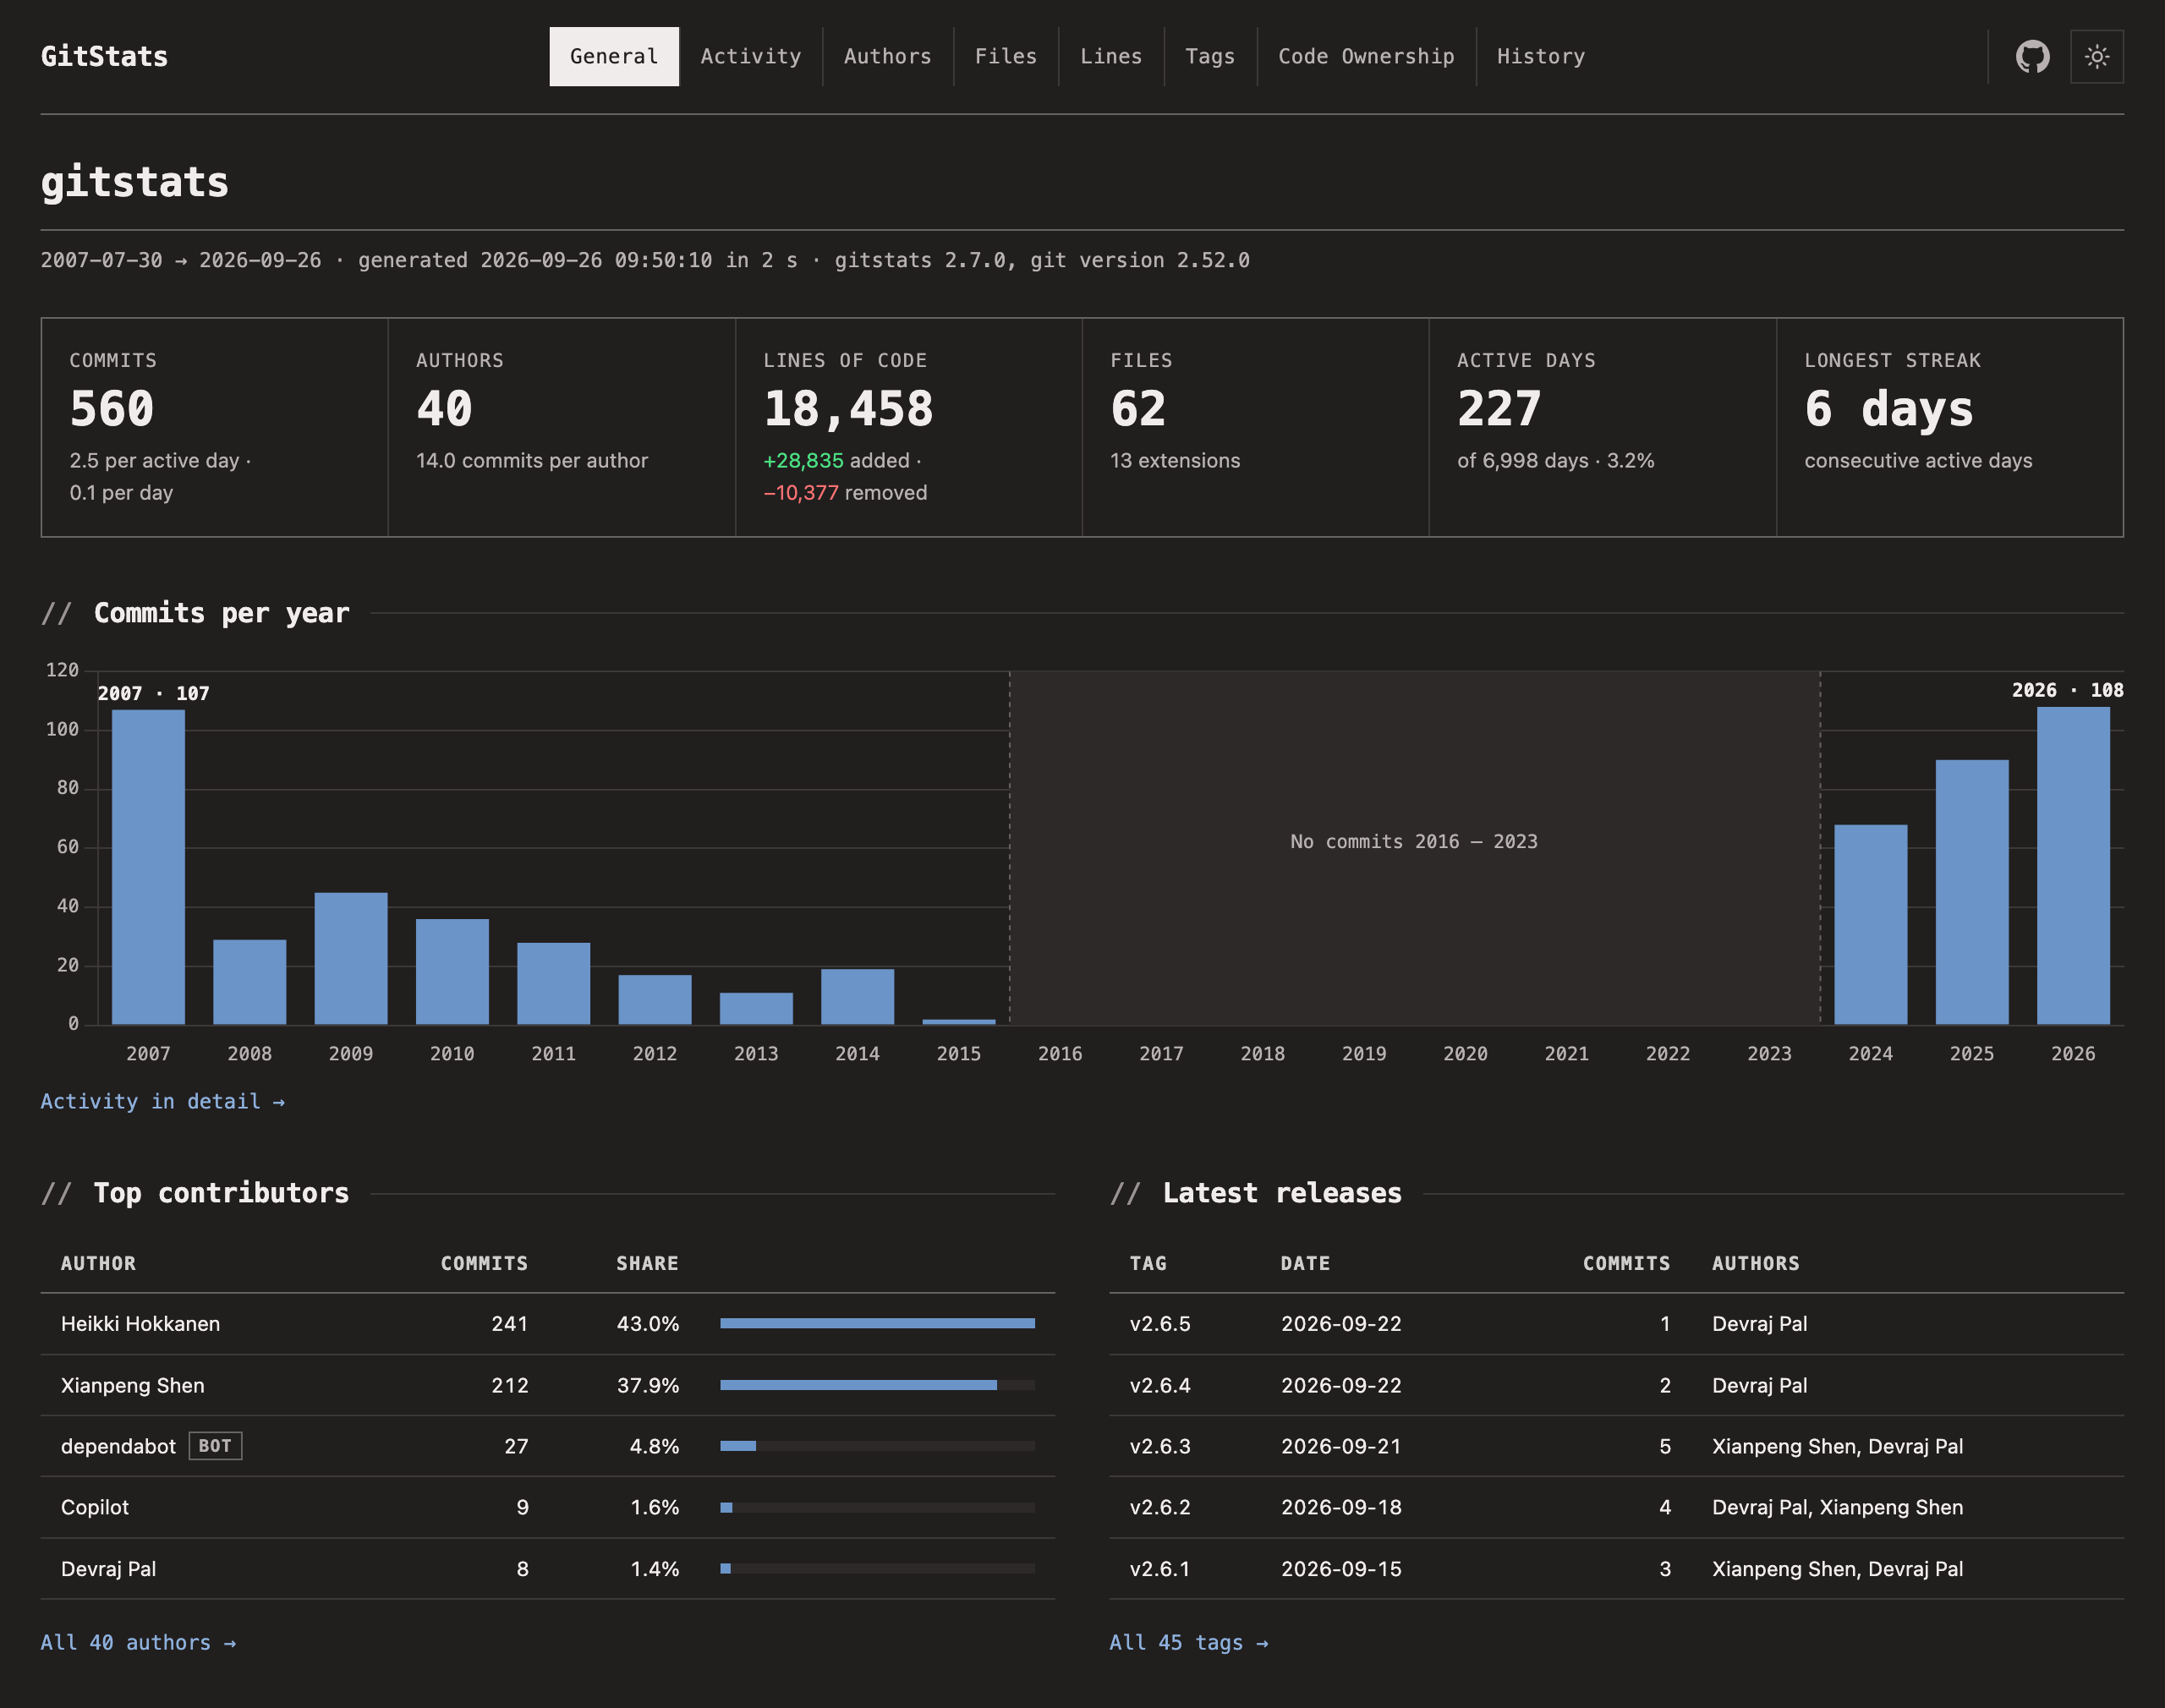
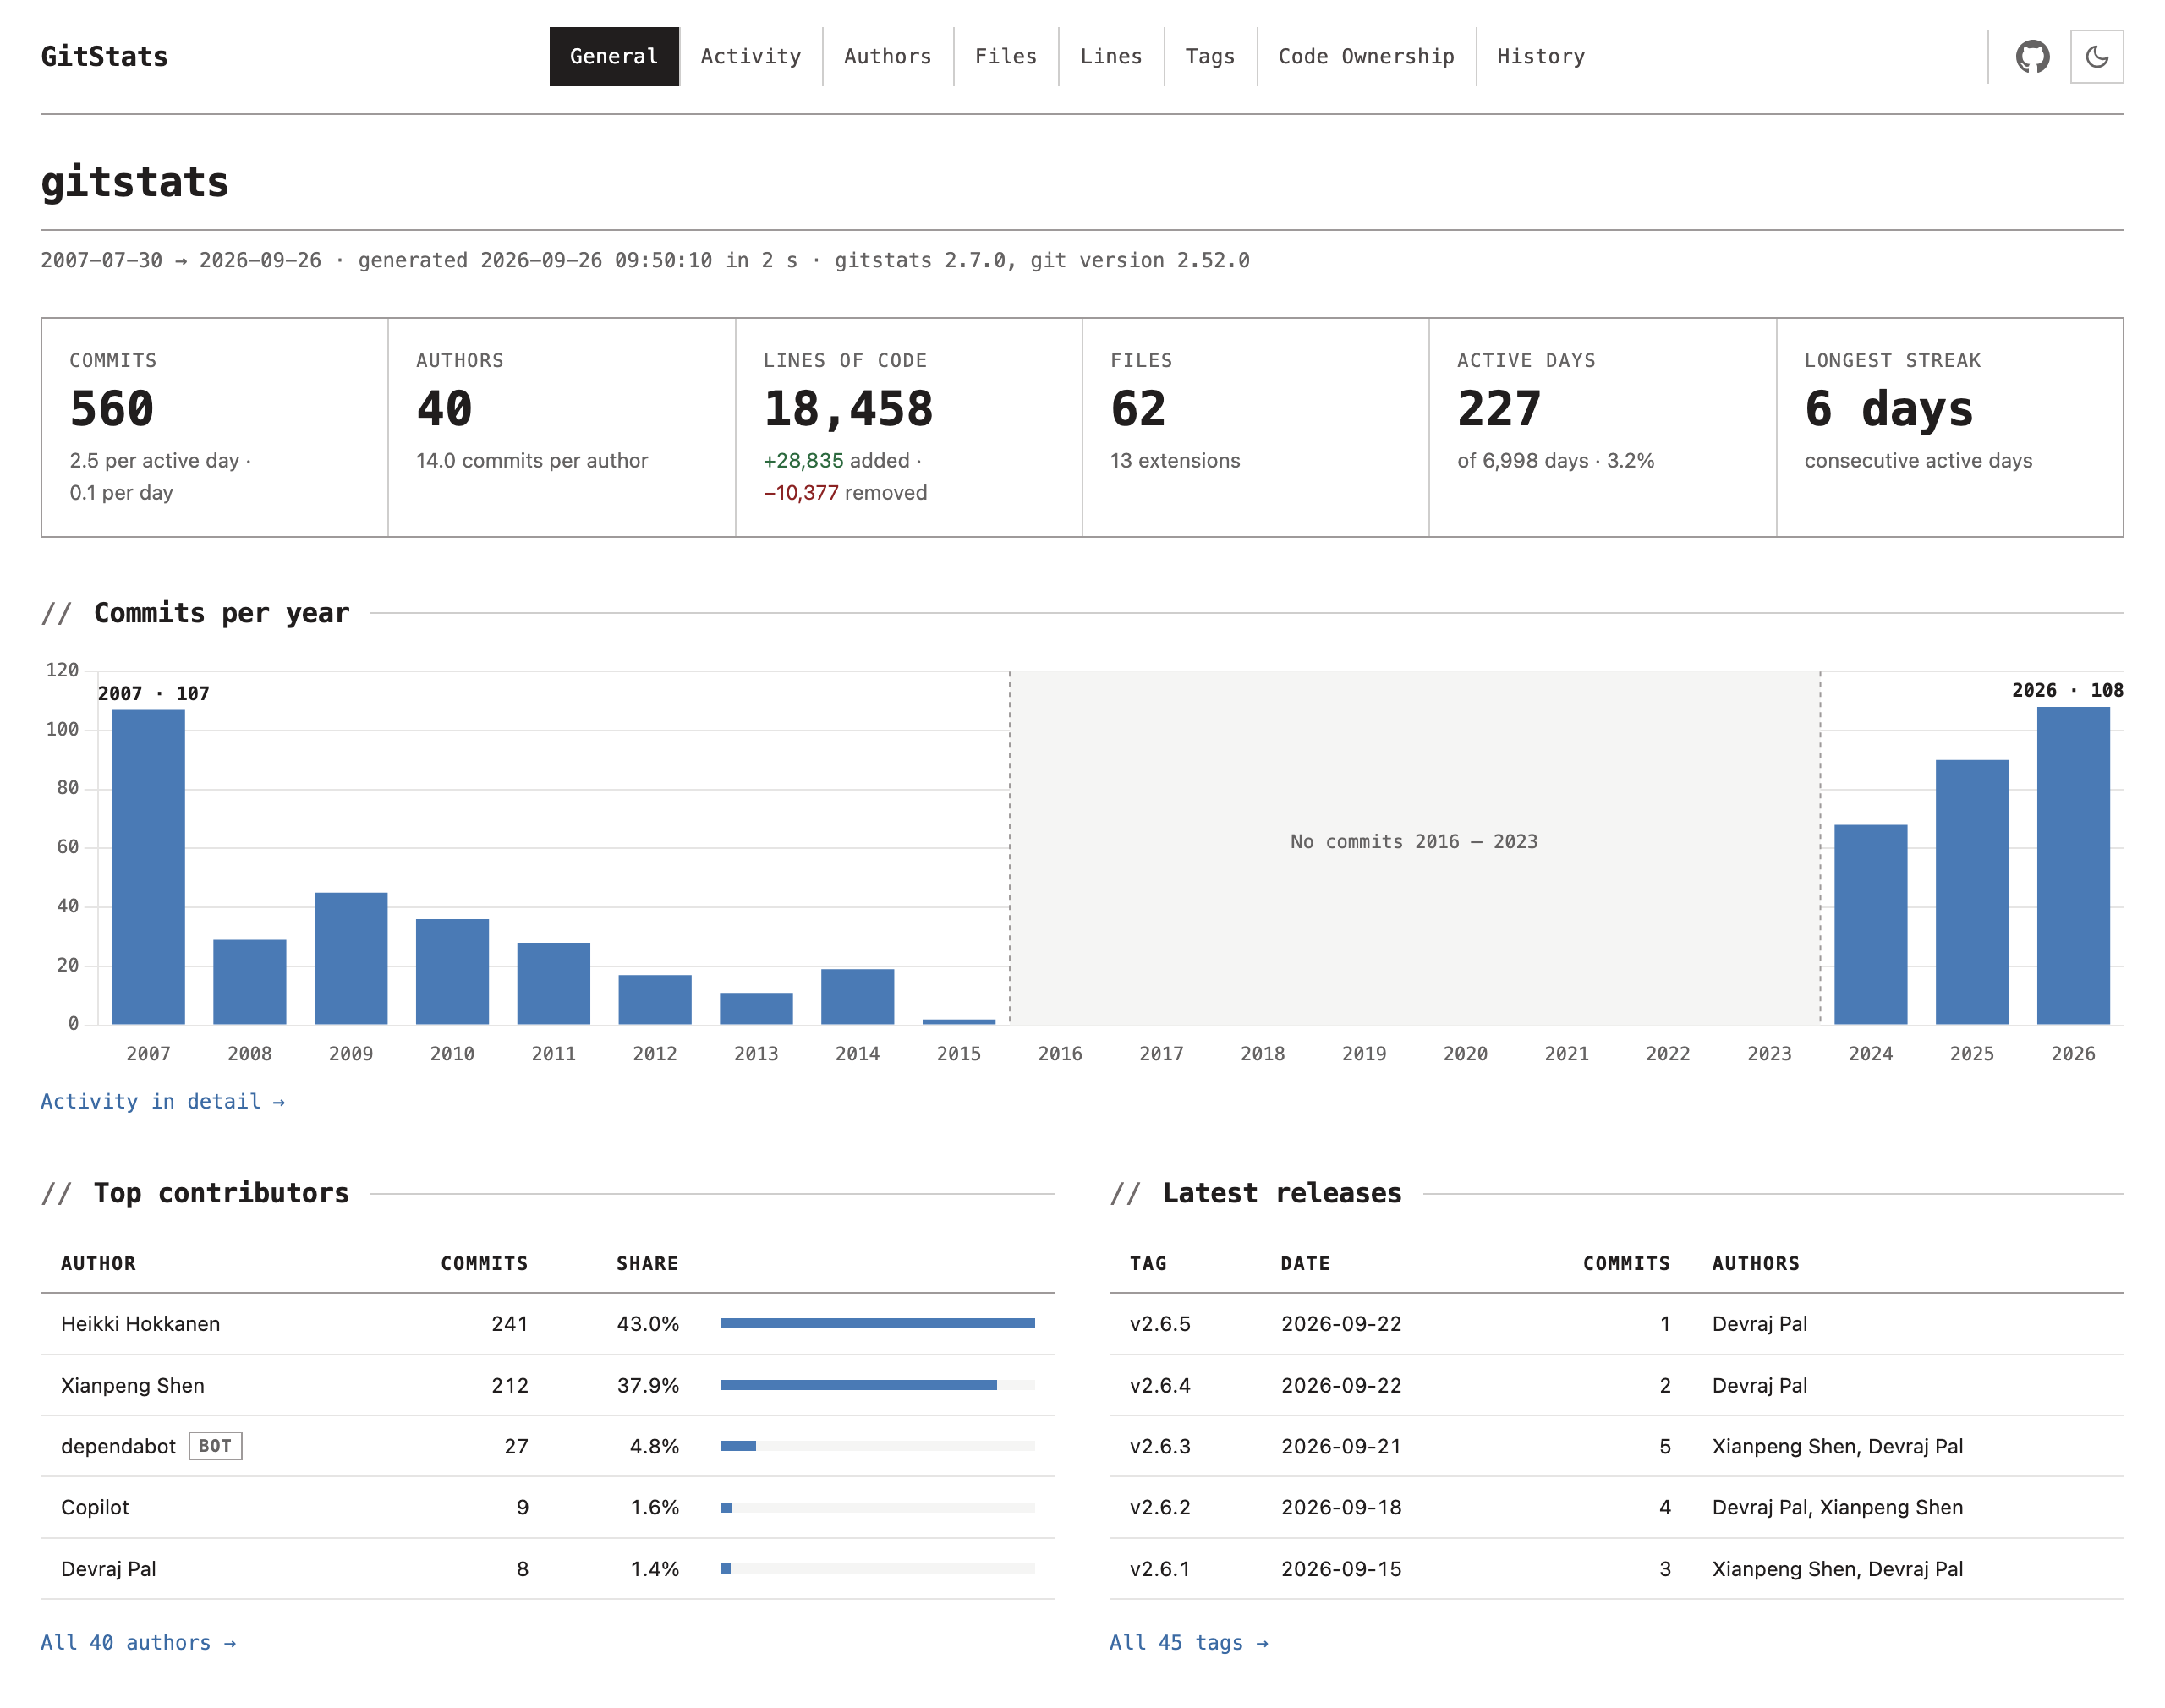
Check out the GitStats Gallery for live reports on the world’s largest open-source projects — auto-generated weekly.

Installation
pip install gitstatsOr, using uv (recommended):
uv pip install gitstats      # install into current environment
uvx gitstats .              # run instantly, no install required
gitstats is compatible with Python 3.10 and newer.
Usage
gitstats <gitpath> [<outputpath>]If <outputpath> is omitted, reports are written to gitstats-report/ by default.
Analyze several repositories at once to get a portfolio overview — useful for seeing how all of a team’s projects are doing in one place:
gitstats repo1 repo2 repo3 <outputpath>Each repository gets its full report in <outputpath>/<repo>/ along with a machine-readable summary.json, and an aggregate page at <outputpath>/index.html shows a sortable table of every repository — commits, authors, recent activity, lines of code and a health label — linking into the individual reports. Repositories that fail to analyze are listed on the page without stopping the run.
Add --serve to preview the generated report right away — gitstats starts a local web server and prints the URL (bound to 127.0.0.1 by default; pass --host 0.0.0.0 to expose it on your network, --port to pick a port):
gitstats --serve .Use --verbose to show debug-level command logs, or --quiet to show only warnings and errors:
gitstats --verbose .
gitstats --quiet .
Run gitstats --help for more options, or check the documentation.
GitHub Action
Automate your gitstats report generation with the official GitStats Action.
- uses: shenxianpeng/gitstats-action@v1
  with:
    deploy-to-pages: true
With just one uses line, the Action generates a full gitstats report and deploys it to GitHub Pages automatically.
See the gitstats-action repository for detailed inputs, examples, and advanced usage (AI-powered reports, custom config, manual deploy, etc.).
Share Your Report with a Badge
Every report ships with a badge.svg next to index.html — a shields.io-style badge in the gitstats brand colors that shows live repository data (commit count by default). Because the badge lives inside the report directory, wherever you host the report the badge is served from the same URL, and it refreshes automatically every time the report is regenerated.
This repository eats its own dog food — these are live badges served from the demo report (click one):





The quickest way: the report’s Badges page. Open the published report and go to Badges in the nav (or “Badge for your README” under the repository name). Pick a style and a format — Markdown, reStructuredText or HTML — and press Copy next to the badge you want: the snippet already points at your report. The page reads the report’s address from its own URL; when it is opened from a local file, type the address in (your browser remembers it) or generate the report with --site-url:
gitstats --site-url https://reports.example.com/my-repo/ . gitstats-report--site-url also prints the README badge in the run log, which is handy in CI.
Or write the snippet yourself. Embed it in your README so visitors can jump straight to the report:
[](https://<your-report-url>/)Or in reStructuredText:
.. image:: https://<your-report-url>/badge.svg
   :target: https://<your-report-url>/
   :alt: GitStats report
Projects on GitHub — the easiest path is the GitStats Action with deploy-to-pages: true (see above). After the first run, the workflow’s job summary contains ready-to-copy badge markdown pointing at your GitHub Pages report, e.g. https://<owner>.github.io/<repo>/badge.svg.
Projects hosted elsewhere — publish the report output directory with any static hosting you already use (GitLab Pages, Netlify, an internal web server, …) and point the badge at it. For example, on GitLab CI:
pages:
  variables:
    GIT_DEPTH: 0   # CI clones are shallow by default: fetch all history
  script:
    - pip install gitstats
    - gitstats . public
  artifacts:
    paths:
      - public
then embed https://<group>.gitlab.io/<project>/badge.svg linking to https://<group>.gitlab.io/<project>/. The integration docs cover GitLab group badges, private GitLab projects and Bitbucket Pipelines.
Customizing the badge
Static hosting can’t vary a file on ?query parameters, so customization works through pre-rendered files and configuration instead.
Pick a metric by URL. Alongside badge.svg, every report contains a badges/ directory with one badge per metric — switching what the badge says is just switching the URL:
badges/commits.svg — 1,234 commits
badges/last-commit.svg — Aug 2026 (date of the latest commit)
badges/authors.svg — 12 authors
badges/files.svg — 245 files
badges/lines.svg — 44,025 lines
badges/release.svg — v2.7.0 · 46 tags (newest tag and tag count)
badges/active-days.svg — 229 active days (days with commits)
A few badges pack more into one image:
badges/summary.svg — 563 commits | 40 authors | 18.5k lines
badges/activity.svg — a sparkline of commits per month over the last year of history, then the latest month: 29 in Sep
badges/health.svg — active, quiet or dormant with the age of the last commit (last commit 3 days ago), colored green, amber or gray; active means a commit within 30 days, quiet within a year. It keeps its own label and colors, and its age counts from when the report was generated, so regenerate the report on a schedule to keep it honest
Pick a style by URL too. Every badge is also written in every style, as badges/<style>/<name>.svg (badges/terminal/summary.svg). A README that links one of these keeps its look when badge_style changes; the Badges page uses them.
Style with config keys. The badge_* options control every generated badge (including which badge badge.svg itself is, any name above):
gitstats -c badge_metric=last-commit \
         -c badge_label="my project" \
         -c badge_color=green \
         -c badge_style=terminal . gitstats-report
badge_color accepts shields.io color names (brightgreen, green, yellow, orange, red, blue, lightgrey), hex values like #30a14e, or any SVG color. badge_style is one of:
flat — rounded, subtle gradient (default)
flat-square — sharp corners, solid fill
terminal — the report’s own look: monospace, square, a // before the label and a light, outlined value
for-the-badge — taller, bold and uppercase, for a row of hero badges
light — white label and pale blue value with a thin border, for READMEs on white pages
Full shields.io customization. Each badge is also exported as badges/<metric>.json in the shields.io endpoint schema. Point shields at it and use any of their URL parameters — arbitrary colors, style=plastic, logos — while the data stays yours and stays live:
[](https://<your-report-url>/)Repo Wrapped Card
Add --wrapped to also get a “Repo Wrapped” card: a square (1080×1080) SVG image written next to the report as wrapped-<year>.svg, made for sharing.
gitstats --wrapped .
gitstats --wrapped --wrapped-theme sunset .      # midnight (default), sunset or clean
gitstats --wrapped --wrapped-year 2025 .         # the card for another year
gitstats --wrapped --wrapped-output card.svg .   # write it to another file
The card is about one year, the current one by default, and every number on it is that year’s: commits, active days, longest streak, lines changed, contributors, releases (or new contributors, in a year without a release), the busiest month and weekday, the top contributor, the commits in each month and the part of the day most of them were made in. A year without commits gets no card: gitstats says so and names the last year that has any.
With several repositories, each one gets its card in its own report directory; --wrapped-output names a single file, so it only works with one repository.
What’s New in v2.0.0
v2.0.0 is a major release focused on modernizing the report UI and removing the Gnuplot dependency.
- Terminal-inspired UI redesign
The entire report interface has been redesigned with a terminal / OpenCode-inspired aesthetic: zero border-radius (sharp, angular corners), monospace fonts in headings and navigation, border-heavy layout, and a GitHub-style green heatmap. Both light and dark modes are supported with a one-click toggle — no flash of unstyled content when switching pages.
- Chart.js replaces Gnuplot
All charts are now rendered interactively in the browser using Chart.js. Gnuplot is no longer required. Reports are fully self-contained HTML files.
Features
Here is a list of some features of gitstats:
General: headline numbers (commits, authors, lines, files, active days, longest streak), commits per year, top contributors, latest releases.
Activity: commits by year, month and week; a punch card of day of week by hour of day; month of year; timezones.
Authors: every author’s commits, lines and active span; a contributor timeline; cumulative lines added per author; the top author per year and month; commits by email domain; contributor growth.
Files: file count over time, extensions ranked by lines, and the most-changed files.
Lines: lines of code over time, and lines added and removed per month.
Tags: every tag with its commits and authors.
Code Ownership: bus-factor risk (files only one person has changed), ownership by author, and the files shared by the most people.
Hotspots: every file plotted by its size against how often it changes, and the large, frequently changed files ranked by score.
History: the project’s life one year at a time — its peaks, quiet years and revivals, newcomers and releases — with optional AI narration.
Portfolio: analyze several repositories at once for an aggregate overview.
Wrapped card: a shareable SVG card of one year in the repository, with --wrapped.
Readable anywhere: interactive charts, light and dark themes, and layouts that work on phones; long quiet periods are shaded on every timeline.
Customizable: config values through gitstats.conf.
Cross-platform: works on Linux, Windows, and macOS.
AI-Powered Features 🤖
GitStats supports AI-powered insights to enhance your repository analysis with natural language summaries and actionable recommendations.
Quick Start:
# Install with AI support
pip install gitstats[ai]

# Enable AI with OpenAI
export OPENAI_API_KEY=your-api-key
gitstats --ai --ai-provider openai <gitpath> [<outputpath>]
For detailed setup instructions, configuration options, and examples, see the AI Integration Documentation.
Contributing
As an open source project, gitstats welcomes contributions of all forms.
Thanks to all contributors:

The gitstats project was originally created by Heikki Hokkainen and is currently maintained by Xianpeng Shen.
1 maintainer

Metadata
1 maintainer
Release files for gitstats 2.9.0
For a detailed explanation of source distributions (sdists) and built distributions (wheels), please see the package formats documentation.
Built distribution (wheel)
| File | Interpreter | ABI | Platform | Reset |
|---|---|---|---|---|
| gitstats-2.9.0-py3-none-any.whl | Python 3 | none | any | Details |
Release files / gitstats-2.9.0-py3-none-any.whl
| Download URL | gitstats-2.9.0-py3-none-any.whl |
|---|---|
| Size | 184.1 kB |
| Tags | Python 3 |
|
SHA-256 checksum How to use checksums |
abef2dfcfeb2746a2ba61685a74c07c9849085ddecd5498f7a83dfbc87b8feb4
|
|
BLAKE2b-256 checksum How to use checksums |
5f26fc4d684d5c4b895886377b623ab6e8dedd0ce4ca143019576ba953193b52
|
| Upload date | |
|
Uploaded using Trusted Publishing? What is trusted publishing? |
No |
| Uploaded via |
twine/7.0.0 CPython/3.14.8
|














