
gog for Python
Draw a plot by describing it. You name a table, a mark to draw (points, bars,
lines and so on), and which column goes to which part of the picture. That is
a specification, and gog draws it as an SVG.
One engine, written in Rust, does the drawing for R, Python, Julia and JavaScript. You write the specification in your language's own syntax, and the engine draws the same picture from it in all four, byte for byte.
Why you might want this
One vocabulary instead of many chart types. There is no histogram()
function, so there are no arguments that belong to a histogram alone. The
whole vocabulary fits on one page, and each chart type is a combination of
words from it. A histogram is bar * bin: the bar mark joined to the bin transform,
which counts the rows in each interval. Keep bin and change bar to
line, area or step, and the same counts are drawn as a line, a filled
area or a staircase. You learn each word once, and it works the same way in
every plot.
It says no, and says what to write instead. If you write something the
grammar has no meaning for, gog refuses it, and the message says what to
write instead. It never accepts part of what you wrote and then ignores it, so
a plot that is drawn shows everything you wrote.
The same picture from four languages. A colleague who works in R, Julia or JavaScript writes the same specification in that language's syntax, and gets the same file, byte for byte. So a team that uses different programming languages can still work on one plot.
A plot is a specification, not drawing code. What you build is a specification, and the engine draws it. So you can save one to a file, compare two of them, create one from another program, or send one over a network. That is harder in a library where a plot exists only as an object in your running session.
Things that usually need a second package are already here. Three dimensions, animation, brushing (selecting rows and dimming the rest), circular layouts, maps, networks, treemaps, flow diagrams and contour maps are all part of the same vocabulary. None of them is an add-on with a syntax of its own.
Install
pip install gog
The wheel includes the drawing engine, so there is nothing else to install and no Rust toolchain to set up.
Your first plot
from gog import *

gm = {"gdp": [1000, 8000, 30000],
      "life": [52, 68, 79],
      "continent": ["Africa", "Asia", "Europe"]}

p = data(gm) + point + x(col.gdp, scale="log") + y(col.life) + color(col.continent)
save_svg(p, "life.svg")
Read that aloud: "Given gm: points, x is gdp on a log scale, y is life, color by continent." gog calls a line of code like this a sentence, and each part of it becomes one phrase of what you read aloud. So you can say a plot in words first, and then type it.
A table is a dict that maps each column name to a list of values, as above.
Any object that has .columns and returns a column for table[name] works
too, so a pandas or polars DataFrame works. gog needs neither package.
When a plot does not draw as you expect, save_json(p, "plot.json") saves what
the engine reads to draw it: the sentence, and every value of each column the
sentence names. The engine draws the same plot from that file, so attach the
file to a bug report. Read it before you share it, because it holds your data.
Five plots, five sentences
Each picture below was drawn from the code under it. Each example downloads
its table from the website of the book, gog's online manual, with
gog_table(). So the code runs without changes on a computer that is
online. Click a picture to open its page in the book, where you can turn the
3-D plots with the pointer.
The examples assume you have already run from gog import *.
Storms of hurricane strength, by calendar month
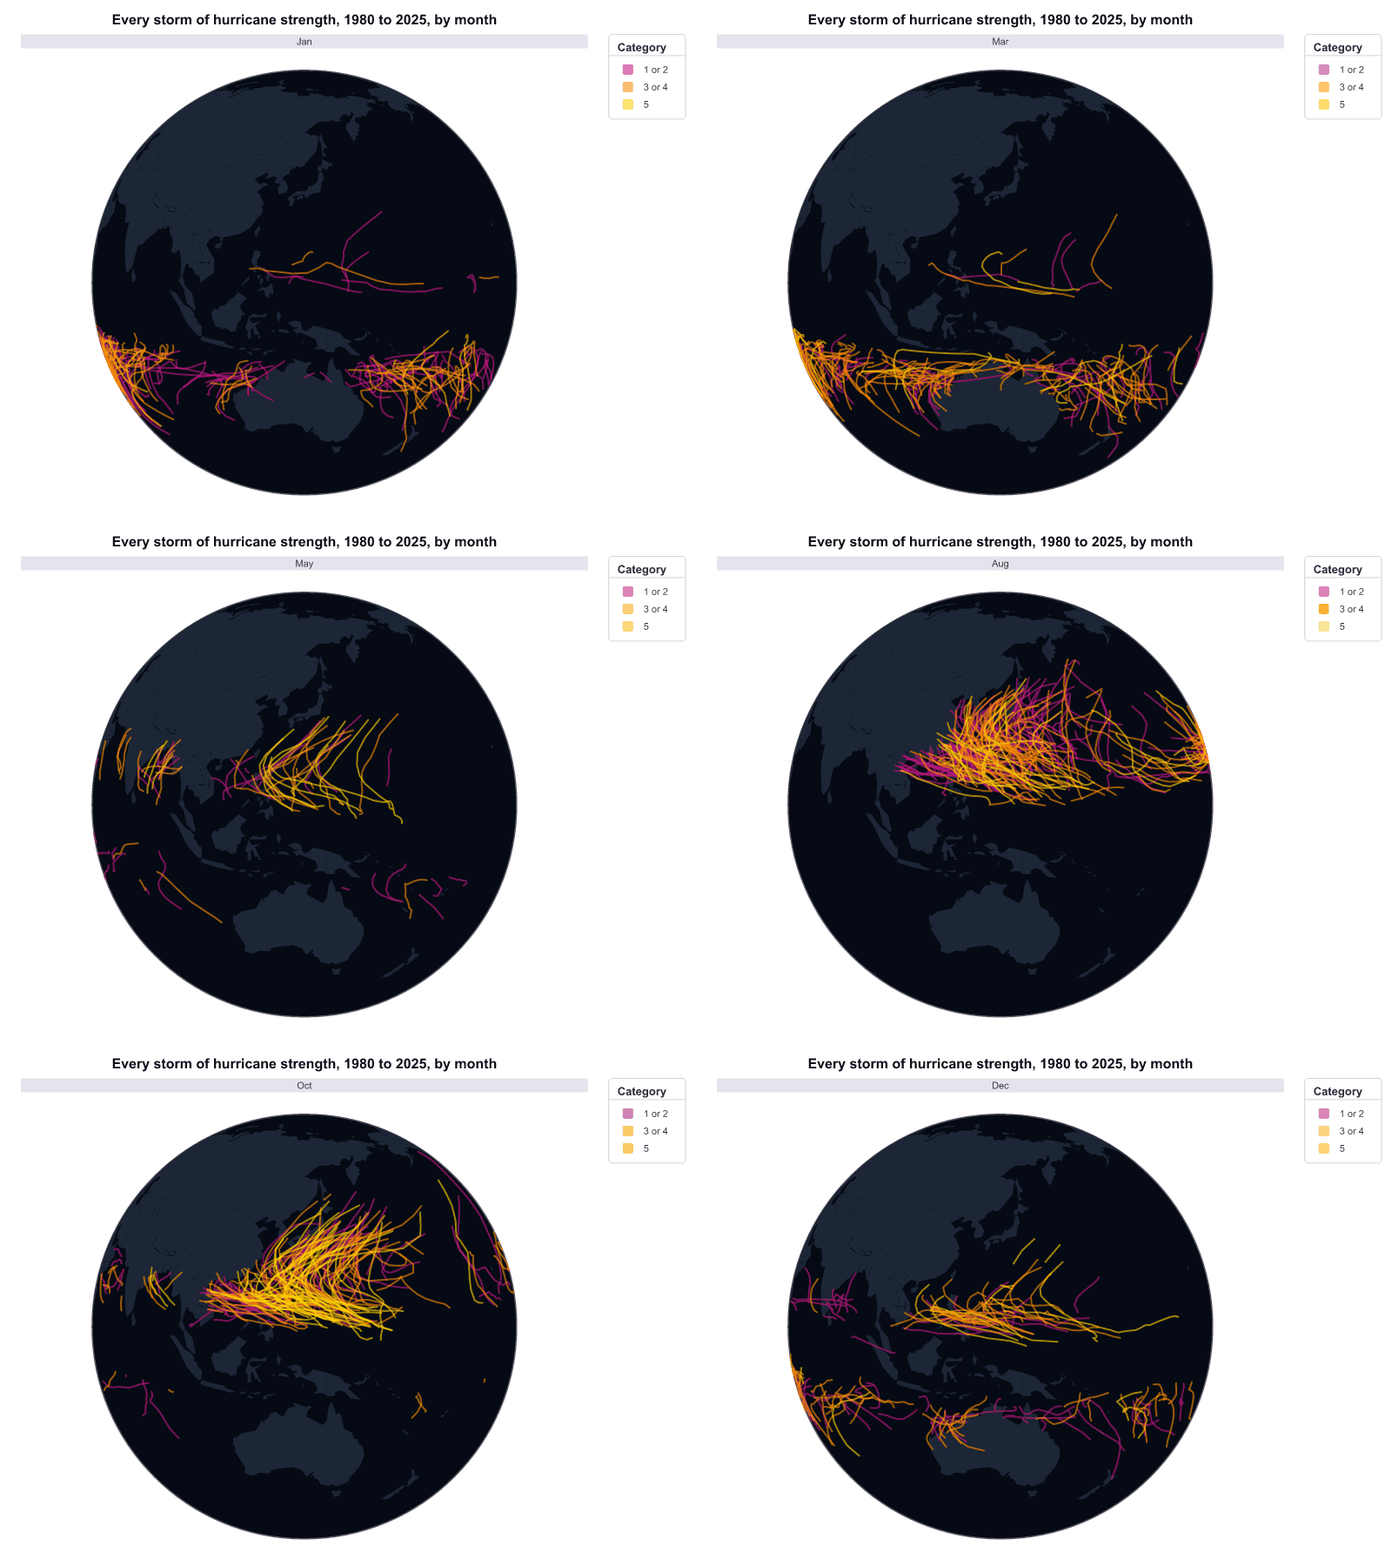
cyclones = gog_table("cyclones")
cyclones["month"] = ordered(cyclones["month"],
                            ["Jan", "Feb", "Mar", "Apr", "May", "Jun",
                             "Jul", "Aug", "Sep", "Oct", "Nov", "Dec"])
world_borders = gog_table("world_borders")

p = (data(world_borders) + zone + x(col.lon) + y(col.lat) + group(col.country) +
     style(color="#1c2636") +
     data(cyclones) + path + x(col.lon) + y(col.lat) + group(col.storm) +
     color(col.category) +
     palette(["mediumvioletred", "darkorange", "gold"]) + style(opacity=0.6) +
     play(col.month) + globe(turn=135, tilt=10) +
     theme(background="#050a14", grid="none") +
     title("Every storm of hurricane strength, 1980 to 2025, by month"))
save_gif(p, "hurricanes.gif")
A volcano in three dimensions
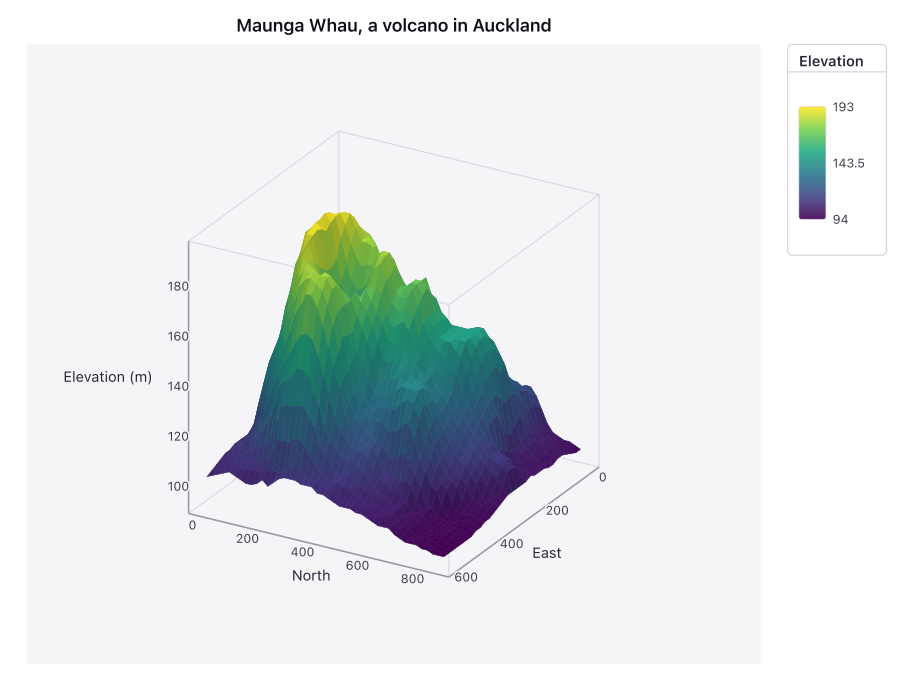
maunga_whau = gog_table("maunga_whau")

p = (data(maunga_whau) + surface + x(col.east) + y(col.north) + z(col.elevation) +
     color(col.elevation) + palette("viridis") +
     z_label("Elevation (m)") + title("Maunga Whau, a volcano in Auckland"))
save_svg(p, "volcano.svg")
Trade between countries, as a chord diagram
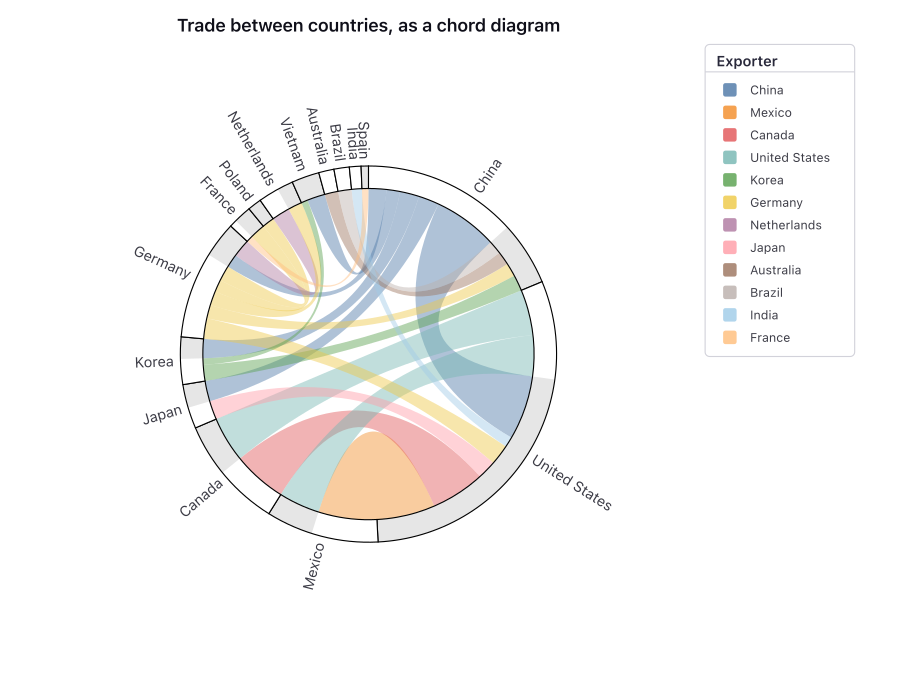
trade_partners = gog_table("trade_partners")

p = (data(trade_partners) + x(col.billions) +
     ribbon * flow(col.exporter, col.importer, shared=True) + color(col.exporter) +
     zone * flow(col.exporter, col.importer, shared=True) +
     text * flow(col.exporter, col.importer, shared=True) + label(col.name) +
     polar() + title("Trade between countries, as a chord diagram"))
save_svg(p, "chord.svg")
Life expectancy against GDP per person
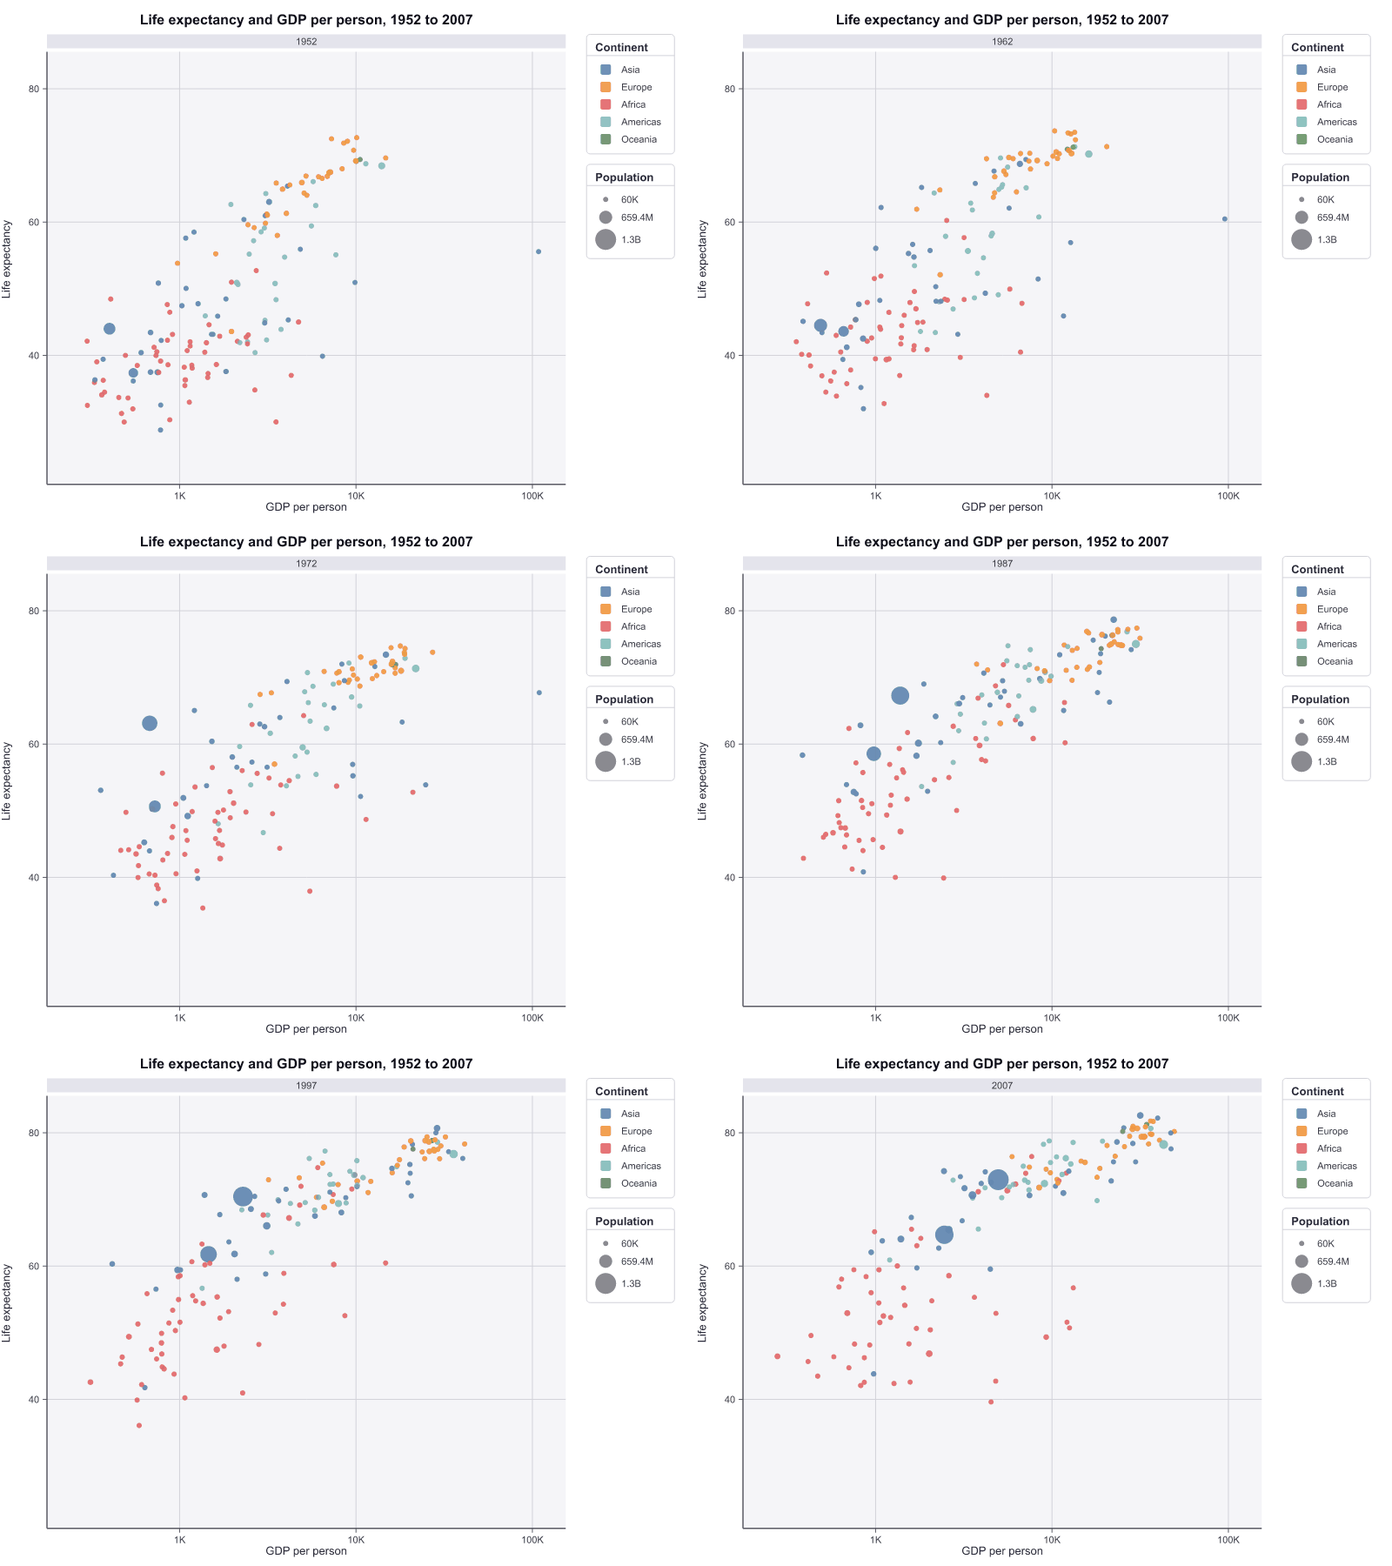
gm_all = gog_table("gm_all")

p = (data(gm_all) + point + x(col.gdp, scale="log") + y(col.life) +
     color(col.continent) + size(col.population) + play(col.year) +
     x_label("GDP per person") + y_label("Life expectancy") +
     title("Life expectancy and GDP per person, 1952 to 2007"))
save_gif(p, "gapminder.gif")
A household's money, as a Sankey diagram
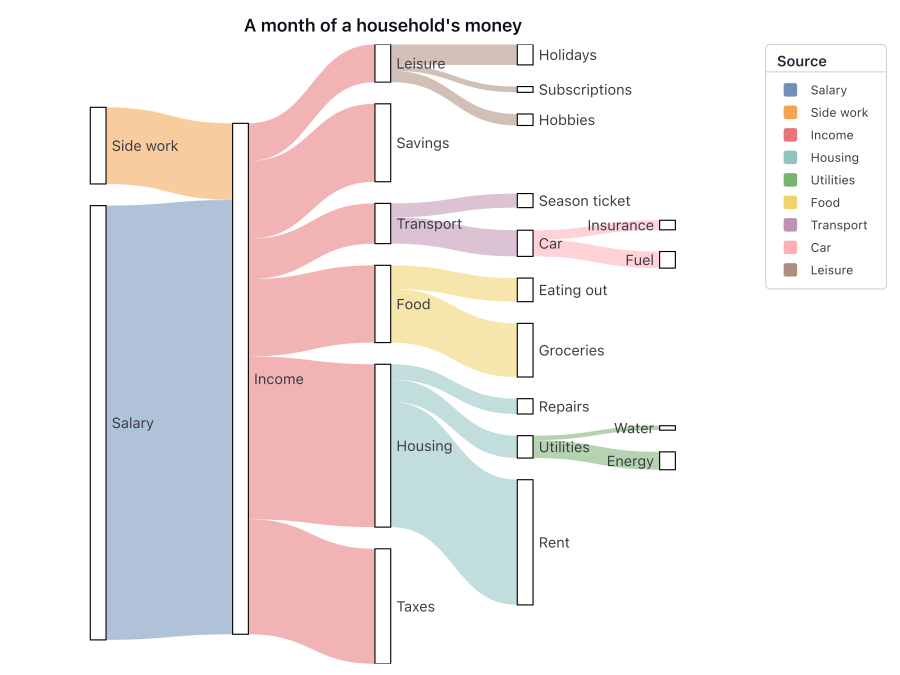
budget = gog_table("budget")

p = (data(budget) + y(col.amount) +
     ribbon * flow(col.source, col.target, layered=True) + color(col.source) +
     zone * flow(col.source, col.target, layered=True) +
     text * flow(col.source, col.target, layered=True) + label(col.name) +
     title("A month of a household's money"))
save_svg(p, "sankey.svg")
What you can draw
Marks — points, lines, bars, areas, steps, error bars, boxes, ribbons, text, paths, reference lines, shaded regions, surfaces in three dimensions, and the links of a network.
Ways to show a column — position, color, size, shape, texture, transparency, a text label, or a split into one series per group.
Transforms, written into the sentence — binning, counting, shares, sums, averages, medians, quantiles, running totals, ranges, confidence intervals, smoothing curves and density estimates, and the layouts of treemaps, flow diagrams, networks and cluster trees. The engine computes them, so you do not compute them before you plot.
Panels, spaces and animation — small multiples in rows or columns, several plots side by side or one above another, a circular (polar) space, a three-dimensional cube, maps and globes, and animation with one frame for each value of a column.
Selection — a brush selects the rows inside a range you give. Those rows keep their full color, and the other rows are dimmed. In a web browser you can also drag the brush with the pointer.
Chart types come from these words too: a pie chart is a stacked bar chart in polar space, and a violin plot is a density drawn as a ribbon.
Two things to know in Python
A column is written col.gdp. In R you can write a column's name alone, as
in x(gdp). In Python a bare gdp would be a variable, so in gog you
write the column called gdp as col.gdp. A plain string is always a value, as in
style(color="tomato"), so x("gdp") is refused, and the message names the
correct spelling. Use col["life exp"] for a name with a space in it.
from gog import * hides six of Python's built-in functions. In gog,
bin, sum, min, max and range are transforms, and map is a space. To
keep Python's own functions in the same file, write import gog and then
gog.point, gog.x and so on. Or import one of them again with
from builtins import sum.
The book
The book is gog's full manual, free online. The engine draws every plot in it each time the book is built, so no picture in it is a screenshot.
https://psychometrician.github.io/gog-book/
The book shows its examples in R, Python, Julia and JavaScript. To run an
example that uses one of the book's tables, read the table first, for example
gapminder_2007 = gog_table("gapminder_2007"). The book's
Python chapter lists what is particular to Python.
License
Apache License 2.0. See LICENSE and NOTICE. Both files are included in the package.
1 maintainer

Metadata
1 maintainer
Release files for gog 0.6.1
For a detailed explanation of source distributions (sdists) and built distributions (wheels), please see the package formats documentation.
Built distributions (wheels)
| File | Reset | |||
|---|---|---|---|---|
| gog-0.6.1-py3-none-win_amd64.whl | Python 3 | none | Windows x86-64 | Details |
| gog-0.6.1-py3-none-manylinux_2_28_x86_64.whl | Python 3 | none | Linux glibc 2.28+ x86-64 | Details |
| gog-0.6.1-py3-none-manylinux_2_28_aarch64.whl | Python 3 | none | Linux glibc 2.28+ ARM64 | Details |
| gog-0.6.1-py3-none-macosx_11_0_arm64.whl | Python 3 | none | macOS 11.0+ ARM64 | Details |
| gog-0.6.1-py3-none-macosx_10_12_x86_64.whl | Python 3 | none | macOS 10.12+ x86-64 | Details |
Total release size: 17.9 MB
Release files / gog-0.6.1-py3-none-win_amd64.whl
| Download URL | gog-0.6.1-py3-none-win_amd64.whl |
|---|---|
| Size | 3.4 MB |
| Tags | Python 3 Windows x86-64 |
|
SHA-256 checksum How to use checksums |
67e03f0fb292c06b1e84a9a93337d6a36feb3ad309b2f21028d86fe0f074f97e
|
|
BLAKE2b-256 checksum How to use checksums |
4d4aa18f2e437ac5f38cd48f31a37bca0fc0041fd0a43da76b6c5234c7279855
|
| Upload date | |
|
Uploaded using Trusted Publishing? What is trusted publishing? |
Yes |
| Uploaded via |
twine/7.0.0 CPython/3.13.14
|
Provenance
Provenance describes where a file came from. On PyPI, provenance is shared via attestations, which provide a verifiable record of the build or publishing details. View details, limitations and caveats.


PyPI Publish Attestation
PyPI verified that this artifact, at this checksum, originated from the publisher listed below.
Signed by GitHub Actions, verified by PyPI on Oct 15, 2026.
Transparency logRelease files / gog-0.6.1-py3-none-manylinux_2_28_x86_64.whl
| Download URL | gog-0.6.1-py3-none-manylinux_2_28_x86_64.whl |
|---|---|
| Size | 3.8 MB |
| Tags | Linux glibc 2.28+ x86-64 Python 3 |
|
SHA-256 checksum How to use checksums |
af2be0f24b961206c1fa673c5563093c8fbdee64c4cf890bd0bd0538218abdf2
|
|
BLAKE2b-256 checksum How to use checksums |
0b3c8b7fa68a17f4a2f1a36703f8dc13df76b2de65ac31f473b8efe52f6acf13
|
| Upload date | |
|
Uploaded using Trusted Publishing? What is trusted publishing? |
Yes |
| Uploaded via |
twine/7.0.0 CPython/3.13.14
|
Provenance
Provenance describes where a file came from. On PyPI, provenance is shared via attestations, which provide a verifiable record of the build or publishing details. View details, limitations and caveats.
PyPI Publish Attestation
PyPI verified that this artifact, at this checksum, originated from the publisher listed below.
Signed by GitHub Actions, verified by PyPI on Oct 15, 2026.
Transparency logRelease files / gog-0.6.1-py3-none-manylinux_2_28_aarch64.whl
| Download URL | gog-0.6.1-py3-none-manylinux_2_28_aarch64.whl |
|---|---|
| Size | 3.6 MB |
| Tags | Linux glibc 2.28+ ARM64 Python 3 |
|
SHA-256 checksum How to use checksums |
64e50bf118c076f4529fbeb1b52463091b1e1b3cdd29419dc15d92e7ac6ea4aa
|
|
BLAKE2b-256 checksum How to use checksums |
2d11d1e14caf4d40533bc821a98fd30ad232b0be7d482db7a68625aa1cb66aac
|
| Upload date | |
|
Uploaded using Trusted Publishing? What is trusted publishing? |
Yes |
| Uploaded via |
twine/7.0.0 CPython/3.13.14
|
Provenance
Provenance describes where a file came from. On PyPI, provenance is shared via attestations, which provide a verifiable record of the build or publishing details. View details, limitations and caveats.
PyPI Publish Attestation
PyPI verified that this artifact, at this checksum, originated from the publisher listed below.
Signed by GitHub Actions, verified by PyPI on Oct 15, 2026.
Transparency logRelease files / gog-0.6.1-py3-none-macosx_11_0_arm64.whl
| Download URL | gog-0.6.1-py3-none-macosx_11_0_arm64.whl |
|---|---|
| Size | 3.4 MB |
| Tags | Python 3 macOS 11.0+ ARM64 |
|
SHA-256 checksum How to use checksums |
97186f248e17966ba6ea7b78d03a461576d4c5cf88a6d8659910baf71e3f1515
|
|
BLAKE2b-256 checksum How to use checksums |
dbb59f263c9ada0ecda9d40893c61f1de3329a527767a4820ba2cc30abb5c756
|
| Upload date | |
|
Uploaded using Trusted Publishing? What is trusted publishing? |
Yes |
| Uploaded via |
twine/7.0.0 CPython/3.13.14
|
Provenance
Provenance describes where a file came from. On PyPI, provenance is shared via attestations, which provide a verifiable record of the build or publishing details. View details, limitations and caveats.
PyPI Publish Attestation
PyPI verified that this artifact, at this checksum, originated from the publisher listed below.
Signed by GitHub Actions, verified by PyPI on Oct 15, 2026.
Transparency logRelease files / gog-0.6.1-py3-none-macosx_10_12_x86_64.whl
| Download URL | gog-0.6.1-py3-none-macosx_10_12_x86_64.whl |
|---|---|
| Size | 3.6 MB |
| Tags | Python 3 macOS 10.12+ x86-64 |
|
SHA-256 checksum How to use checksums |
3a46db3fcf7bbd104e726b5bd486a73e333b79ae3cd95d0102e9eec19801aa50
|
|
BLAKE2b-256 checksum How to use checksums |
8ef167c3e7c0a203a2f42a0dcbbc3827c80d40d07a9e1638a7f42d5321cd3746
|
| Upload date | |
|
Uploaded using Trusted Publishing? What is trusted publishing? |
Yes |
| Uploaded via |
twine/7.0.0 CPython/3.13.14
|
Provenance
Provenance describes where a file came from. On PyPI, provenance is shared via attestations, which provide a verifiable record of the build or publishing details. View details, limitations and caveats.
PyPI Publish Attestation
PyPI verified that this artifact, at this checksum, originated from the publisher listed below.
Signed by GitHub Actions, verified by PyPI on Oct 15, 2026.
Transparency log













