
Single-host daemon that surfaces 'idle-held' NVIDIA GPU memory — the embarrassing category conventional dashboards miss.
Verified details
These details have been verified by PyPIProject links
GitHub Statistics
Maintainers

Project description
gpu-usage-audit
Single-host NVIDIA GPU usage audit for finding idle-held GPUs: cards that look idle by utilization, but are still held by a process through GPU memory.




English · 한국어 · Releases · Issues
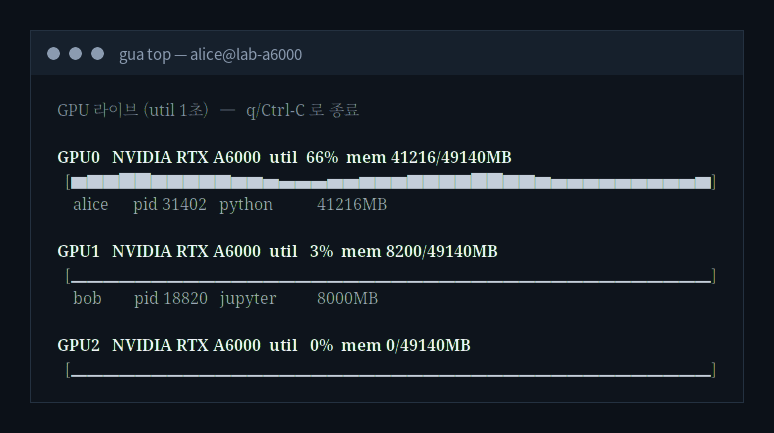
gua top — a live local view, no board or web UI required. GPU0 is genuinely busy; GPU1 sits at 3% utilization while still holding 8.2 GB (idle-held); GPU2 is truly free.
About
gpu-usage-audit watches local NVIDIA/NVML telemetry and answers one question other dashboards skip: is this GPU actually free, or just sitting idle while holding memory? It separates every GPU card-tick into:
active: utilization is doing real workidle-held: utilization is low, but a process still holds GPU memorytruly-idle: no meaningful GPU process memory is present
The second category is the point. A notebook can sit at 1% SM utilization while keeping an 8 GB tensor allocated. Conventional dashboards usually flatten that into “idle”; this tool shows that the card is effectively unavailable.
Two ways to see it: live with gua top (1s utilization graph + per-GPU process table, right in your terminal), and retrospective with gua report (records into SQLite, then splits the window into the three states above with idle-capacity in GPU-hours). For a shared lab across several hosts, the optional GUA Board folds the same telemetry into one web view.
Features
- Single-host, bare-metal NVIDIA GPU audit
gua doctorreadiness check for/dev/nvidia*,nvidia-smi, NVML, and DB path- Background collector with
gua daemon,gua status, andgua stop - Live local view with
gua top— 1s util graph + per-GPU process table, no board needed - SQLite history database at
~/.gua/gua.dbby default - Report sections for headline split, idle capacity, per-GPU state, top identities, and time-of-day heatmap
- Daemon interval metadata stored per run, so reports compute GPU-hours correctly across mixed 30s / 10s runs
- GPU-less
gua democommand with deterministic fake telemetry - Optional cloud sync to GUA Board: the same 1s util stream, surfaced across many hosts in one web view
- No cluster runtime dependency; no Kubernetes, Slurm, Docker, or remote-node scan
Installation
The recommended install path is PyPI via uv:
uv tool install gpu-usage-audit
Update or remove it with:
uv tool install gpu-usage-audit@latest   # picks up a just-published release (upgrade may miss it due to index cache)
uv tool uninstall gpu-usage-audit
Manual wheel downloads are available from GitHub Releases (swap in the latest tag):
BASE="https://github.com/AI-Ocean/gpu-usage-audit/releases/download/v1.6.1"
WHEEL="gpu_usage_audit-1.6.1-py3-none-any.whl"

curl -fsSLO "$BASE/$WHEEL"
curl -fsSLO "$BASE/SHA256SUMS"
sha256sum -c SHA256SUMS --ignore-missing

uvx --from "./$WHEEL" gua doctor
Quick Start
On an NVIDIA GPU host:
gua doctor
gua daemon --interval 30s
gua status
gua report --since 1h
gua stop
gua doctor is read-only. It does not need sudo; run it as the same user that will run the daemon.
For a live look without the daemon or a report, just run gua top (press q or Ctrl-C to quit):
gua top            # 1s util graph + per-GPU process table
gua top --fake     # try it on a machine with no GPU
Default local state lives under ~/.gua/:
| Path | Purpose |
|---|---|
~/.gua/gua.db |
SQLite history database |
~/.gua/gua.pid |
background daemon PID file |
~/.gua/gua.log |
daemon stdout/stderr log |
The default DB is an appendable local history database. Later daemon runs append to it. If you pass a custom --db PATH, daemon still refuses an existing file to avoid mixing ad hoc runs by accident.
Report Preview
$ gua report --since 1h
gua — lab-a100 (bare, driver 560.35.05)  Window: 1:00:00

§1 Headline
  basis: one sample = one GPU card at one daemon tick
  rules: active >=10% util; idle-held <10% util with >100 MB process memory
  active       █   15.7%
  idle-held    ▒   45.1%
  truly-idle   ░   39.2%
  (51 samples)

§2 Idle capacity
  converted from card-ticks to GPU-hours using recorded daemon interval
  idle-held: ~0.31 GPU-hours, ~1.53 GPUs equivalently unavailable
  truly-idle: ~0.12 GPU-hours, ~1.00 GPUs equivalently free

§3 Per-GPU
§4 Top identities
§5 Time-of-day heatmap (UTC)
Reports can run while the daemon is writing; SQLite WAL mode handles concurrent reads. Reports also work after the daemon has stopped, as long as the DB file exists.
Commands
| Command | Description |
|---|---|
gua doctor |
Check local NVIDIA/NVML readiness and DB path status |
gua daemon |
Start background collection on the local NVIDIA host (--cloud also streams to GUA Board) |
gua start |
Alias for gua daemon |
gua status |
Show whether the managed background collector is running |
gua stop |
Stop the managed background collector |
gua top |
Live local GPU view (1s util graph + processes), no board required |
gua report |
Render the retrospective report from SQLite |
gua demo |
Generate a fake local report without a GPU |
gua enroll |
Connect this host to a GUA Board workspace (optional cloud sync) |
gua sync-once |
Collect one snapshot and push the latest state to GUA Board |
gua version |
Print version |
Important Options
gua daemon [--db PATH] [--interval D] [--pid-file PATH] [--log-file PATH]
gua daemon --cloud [--config PATH]        # also stream to GUA Board (after `gua enroll`)
gua daemon --foreground [--db PATH] [--interval D]
gua top [--interval D] [--fake]
gua report [--db PATH] [--since D] [--interval D] [--width N]
gua demo [--db PATH] [--ticks N] [--interval D]
--intervalondaemoncontrols sampling cadence. Default:30s.--intervalonreportis optional. New DB rows use the interval recorded by each daemon run. Use report--interval Donly as an override or for legacy rows without interval metadata.--sinceacceptsms,s,m,h, andd, with no upper bound.--foregroundis intended for systemd and debugging.
Demo Without a GPU
gua demo
The demo records deterministic fake telemetry and immediately prints the report shape.
Systemd Example
[Unit]
Description=gua daemon
After=network.target

[Service]
Type=simple
ExecStart=/usr/local/bin/gua daemon --foreground --db /var/lib/gua/gua.db --interval 30s
Restart=on-failure
User=gua

[Install]
WantedBy=multi-user.target
Then run:
systemctl enable --now gpu-usage-audit
Cloud Sync (GUA Board, optional)
gpu-usage-audit runs fully local by default. GUA Board is a separate service that folds the same telemetry from many hosts into one web view — live utilization graphs next to a reservation timeline, so a shared lab can see at a glance which GPUs are genuinely free, which are reserved, and which are reserved but sitting idle.
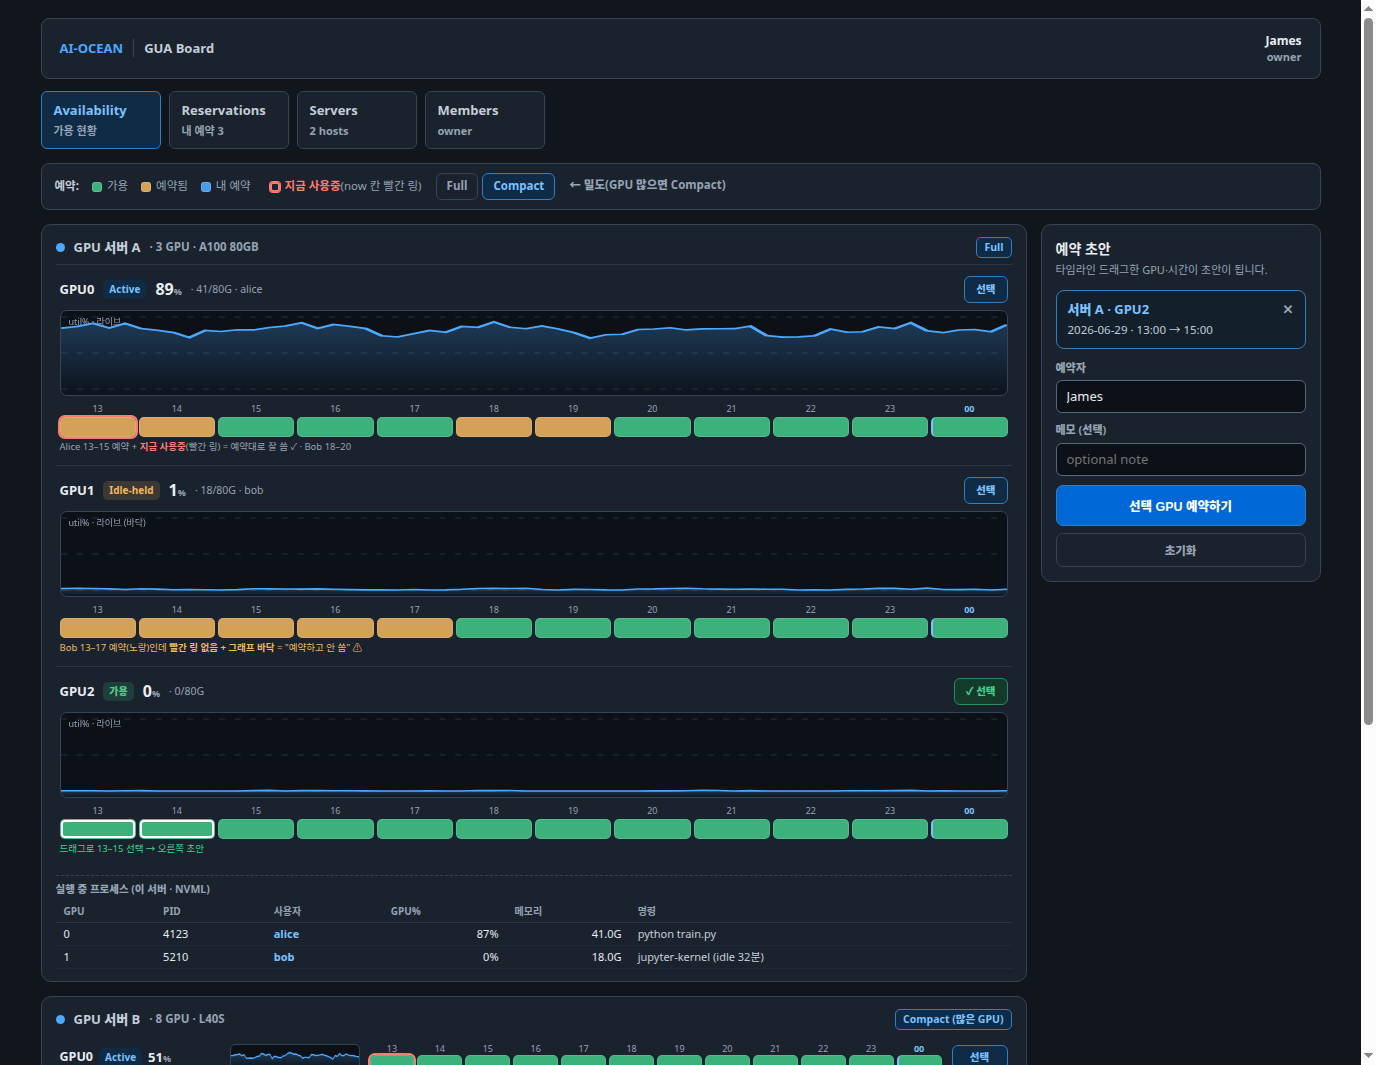
Connect a host in three steps:
# 1. In the GUA Board web UI, register a server and copy the one-time enrollment token.
# 2. On the GPU host:
gua enroll --server-url https://board.example.com --enrollment-token <TOKEN>
# 3a. Live: run the daemon in cloud mode — pushes snapshots and streams 1s util over WebSocket:
gua daemon --cloud
# 3b. Or one-shot: collect a single snapshot and push the latest state (run on a timer):
gua sync-once
How it works and what it does not do:
enrollexchanges the one-time token for a host-scoped, write-only agent token, stored in~/.gua/cloud.jsonwith mode0600. The token can only write this host's observations — it cannot read reservations, users, or other hosts.daemon --cloudkeeps writing local history as usual, and additionally streams the 1s util samples to the board (so the board's graphs scroll live) and pushes periodic snapshots. The board buffers util in memory only; it stores no per-second history.sync-oncecollects one snapshot, writes it to the local database first, then pushes only the latest state. A failed push never blocks or rolls back the local write.- Only the latest state is sent. Historical ticks are kept locally and are never replayed to the server.
- Process telemetry is limited to PID, Linux user, process name (
/proc/<pid>/comm), and GPU memory — never full command lines. - The agent only pushes outward. There is no tunnel, no pull, and no remote command execution — the board cannot reach into a host.
Override the config or database path with --config PATH / --db PATH, and use gua sync-once --fake to exercise the flow without a GPU.
Classification Rules
Each daemon tick records per-card utilization and per-process GPU memory. The report classifies each GPU card at each tick with these rules:
util >= 10                  -> active
util <  10 AND mem >  100   -> idle-held
util <  10 AND mem <= 100   -> truly-idle
The 100 MB threshold absorbs runtime baselines such as importing PyTorch or TensorFlow.
Development
git clone https://github.com/AI-Ocean/gpu-usage-audit
cd gpu-usage-audit
uv sync
uv run python -m pytest
uv run ruff check
uv run ruff format --check
uv run python -m mypy
uv run gua demo
CI runs ruff, format check, mypy, pytest, build, and wheel smoke tests. Tag pushes (v*) build release assets and publish to PyPI through Trusted Publishing.
Non-goals
This is a single-host tool — live (gua top) and retrospective (gua report) views of the GPUs on the machine it runs on. It does not integrate with cluster schedulers: no Kubernetes cluster scans, Slurm joins, quotas, Docker/Podman runtime fallback, or pod-name resolution. The agent never scans or reaches other hosts. Aggregating many hosts into one live view is the job of the optional GUA Board, which the agent only ever pushes to.
The Go v0.1.0 implementation remains available at tag v0.1.0 and branch go-archive.
License
Apache License 2.0. See LICENSE.
Project details
Verified details
These details have been verified by PyPIProject links
GitHub Statistics
Maintainers
Release history Release notifications | RSS feed


Download files
Download the file for your platform. If you're not sure which to choose, learn more about installing packages.
Source Distribution
Built Distribution
Filter files by name, interpreter, ABI, and platform.
If you're not sure about the file name format, learn more about wheel file names.
Copy a direct link to the current filters
File details
Details for the file gpu_usage_audit-1.7.2.tar.gz.
File metadata
- Download URL: gpu_usage_audit-1.7.2.tar.gz
- Upload date:
- Size: 355.4 kB
- Tags: Source
- Uploaded using Trusted Publishing? Yes
- Uploaded via: twine/6.1.0 CPython/3.13.12
File hashes
| Algorithm | Hash digest | |
|---|---|---|
| SHA256 |
5eb195b716f71c19f9ca3f92bc2dccc0a76b308d0fdd9c5e136c140113939042
|
|
| MD5 |
58bd8248cdf68ca9c8c88c84c465075b
|
|
| BLAKE2b-256 |
6760d025c2ec412a299fdb0a09b7f6661a8dc5368ea79f9ed5eafda43c66fb7d
|
Provenance
The following attestation bundles were made for gpu_usage_audit-1.7.2.tar.gz:
Publisher:
release.yml on AI-Ocean/gpu-usage-audit
-
Statement:
-
Statement type:
https://in-toto.io/Statement/v1 -
Predicate type:
https://docs.pypi.org/attestations/publish/v1 -
Subject name:
gpu_usage_audit-1.7.2.tar.gz -
Subject digest:
5eb195b716f71c19f9ca3f92bc2dccc0a76b308d0fdd9c5e136c140113939042 - Sigstore transparency entry: 2057944419
- Sigstore integration time:
-
Permalink:
AI-Ocean/gpu-usage-audit@8f9e2361164fae45f9a8ec99be98a85156c5bdb0 -
Branch / Tag:
refs/tags/v1.7.2 - Owner: https://github.com/AI-Ocean
-
Access:
public
-
Token Issuer:
https://token.actions.githubusercontent.com -
Runner Environment:
github-hosted -
Publication workflow:
release.yml@8f9e2361164fae45f9a8ec99be98a85156c5bdb0 -
Trigger Event:
push
-
Statement type:
File details
Details for the file gpu_usage_audit-1.7.2-py3-none-any.whl.
File metadata
- Download URL: gpu_usage_audit-1.7.2-py3-none-any.whl
- Upload date:
- Size: 77.6 kB
- Tags: Python 3
- Uploaded using Trusted Publishing? Yes
- Uploaded via: twine/6.1.0 CPython/3.13.12
File hashes
| Algorithm | Hash digest | |
|---|---|---|
| SHA256 |
949aeaf756dc572879392fac97287bae26df18ea7e038cd59f0d45998418835c
|
|
| MD5 |
860aedb103eb92ccb2e6933c1144179d
|
|
| BLAKE2b-256 |
9c3e2d5900bb02d16b7691faaa966101a8f49e4ebdb4779b72929464bfbc108b
|
Provenance
The following attestation bundles were made for gpu_usage_audit-1.7.2-py3-none-any.whl:
Publisher:
release.yml on AI-Ocean/gpu-usage-audit
-
Statement:
-
Statement type:
https://in-toto.io/Statement/v1 -
Predicate type:
https://docs.pypi.org/attestations/publish/v1 -
Subject name:
gpu_usage_audit-1.7.2-py3-none-any.whl -
Subject digest:
949aeaf756dc572879392fac97287bae26df18ea7e038cd59f0d45998418835c - Sigstore transparency entry: 2057944701
- Sigstore integration time:
-
Permalink:
AI-Ocean/gpu-usage-audit@8f9e2361164fae45f9a8ec99be98a85156c5bdb0 -
Branch / Tag:
refs/tags/v1.7.2 - Owner: https://github.com/AI-Ocean
-
Access:
public
-
Token Issuer:
https://token.actions.githubusercontent.com -
Runner Environment:
github-hosted -
Publication workflow:
release.yml@8f9e2361164fae45f9a8ec99be98a85156c5bdb0 -
Trigger Event:
push
-
Statement type:






