Serve NumPy data via pandas data frames to Grafana

Project description


Grafana pandas datasource
About
A HTTP API based on Flask for serving pandas data frames to Grafana, generated by NumPy. The Grafana Simple JSON Datasource is used to interface Grafana with the HTTP API.
This way, a pure Python application can be used to directly supply data to Grafana, both easily and powerfully.
The framework supports feeding both timeseries data as well as annotations through corresponding /query and /annotations endpoints and also provides /search and /panels endpoints.
Screenshots
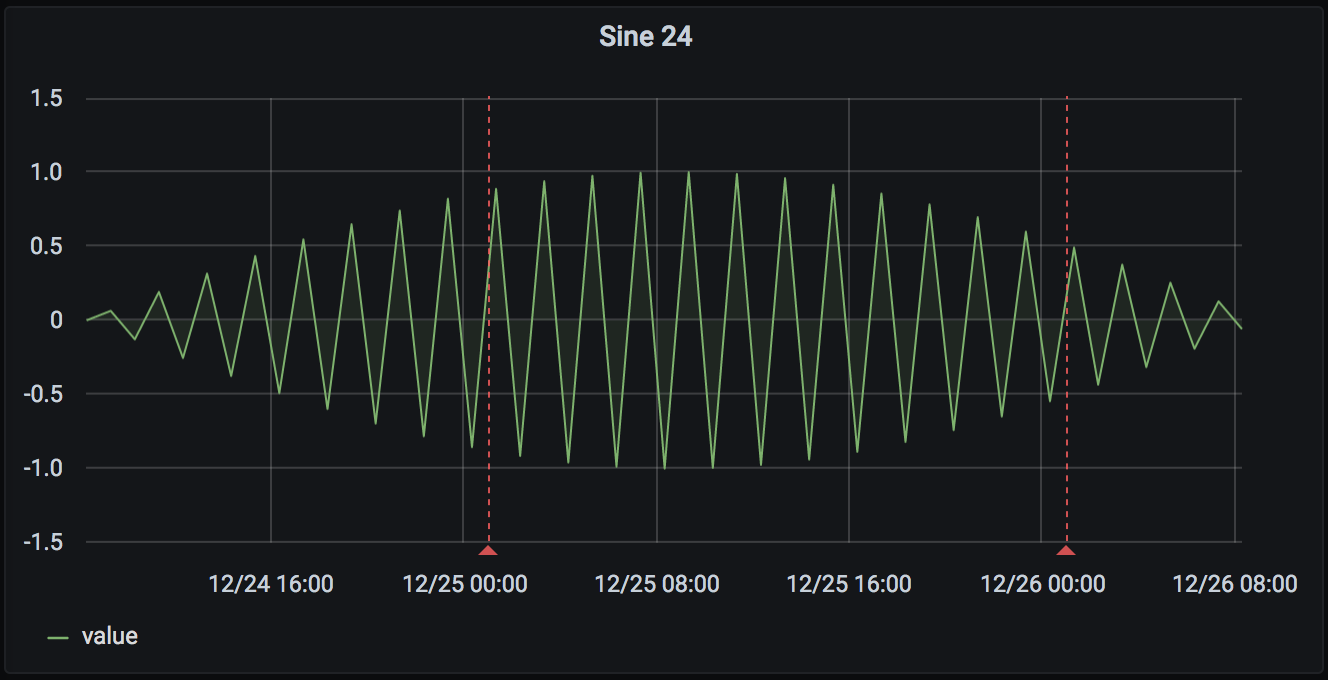
Image: Sinewave data and midnights annotations, both generated using NumPy, see Sinewave/Midnights example.
Setup
Grafana pandas datasource setup outlines how to install all software prerequisites needed to run this project. Please read this section carefully.
pip install grafana-pandas-datasource
Synopsis
Test drive:
# Run Grafana pandas datasource demo.
python examples/sinewave-midnights/demo.py

# Submit a timeseries data request.
echo '{"targets": [{"target": "sine_wave:24"}], "range": {"from": "2022-02-22T15", "to": "2022-02-22T20"}}' | http http://127.0.0.1:3003/query

# Submit an annotation data request.
echo '{"annotation": {"query": "midnights:xx"}, "range": {"from": "2022-02-20", "to": "2022-02-22"}}' | http http://127.0.0.1:3003/annotations
When the environment has been properly configured, both requests above will yield appropriate responses.
Then, configure the Grafana entities. You will need a datasource object and a dashboard object.
Examples
There are different demo programs accompanied with Grafana datasource and dashboard definition files.
After confirming the sandbox environment has been installed successfully, please head over to the Sinewave/Midnights example page in order to learn how to provision Grafana with corresponding resources.
Custom implementations
In order to conceive your own pandas-based data source, please use the Sinewave/Midnights demo.py as a blueprint. If you think it would be a valuable contribution to the community, we will be happy to add it to the repository.
Credits
Kudos to Linar, who conceived the initial version of this software the other day at https://gist.github.com/linar-jether/95ff412f9d19fdf5e51293eb0c09b850.
Other projects
Oz Tiram conceived a similar piece of software with Python. He uses the Bottle web framework.


Download files
Download the file for your platform. If you're not sure which to choose, learn more about installing packages.
Source Distribution
Built Distribution
Filter files by name, interpreter, ABI, and platform.
If you're not sure about the file name format, learn more about wheel file names.
Copy a direct link to the current filters
File details
Details for the file grafana-pandas-datasource-0.3.0.tar.gz.
File metadata
- Download URL: grafana-pandas-datasource-0.3.0.tar.gz
- Upload date:
- Size: 20.6 kB
- Tags: Source
- Uploaded using Trusted Publishing? No
- Uploaded via: twine/3.8.0 pkginfo/1.8.2 readme-renderer/32.0 requests/2.27.1 requests-toolbelt/0.9.1 urllib3/1.26.8 tqdm/4.62.3 importlib-metadata/4.10.1 keyring/23.5.0 rfc3986/2.0.0 colorama/0.4.4 CPython/3.10.1
File hashes
| Algorithm | Hash digest | |
|---|---|---|
| SHA256 |
80f24ca97134125fb9fa4f8f573dc292046efcd4b0377d9bb613b09a15aabcb4
|
|
| MD5 |
73a54ce548bff20a2b45558a55c70abf
|
|
| BLAKE2b-256 |
1170b4250e72d8414b0025f9765e75da5cd6dfe1e70d8ade990c9f6be28df034
|
File details
Details for the file grafana_pandas_datasource-0.3.0-py3-none-any.whl.
File metadata
- Download URL: grafana_pandas_datasource-0.3.0-py3-none-any.whl
- Upload date:
- Size: 31.7 kB
- Tags: Python 3
- Uploaded using Trusted Publishing? No
- Uploaded via: twine/3.8.0 pkginfo/1.8.2 readme-renderer/32.0 requests/2.27.1 requests-toolbelt/0.9.1 urllib3/1.26.8 tqdm/4.62.3 importlib-metadata/4.10.1 keyring/23.5.0 rfc3986/2.0.0 colorama/0.4.4 CPython/3.10.1
File hashes
| Algorithm | Hash digest | |
|---|---|---|
| SHA256 |
7f6ff01415bc047ede6dadc62dd9eedd4f8fcc94c56a4749c059a27bc65d5a7e
|
|
| MD5 |
f118e62ed0a50326cd7b313608ced04e
|
|
| BLAKE2b-256 |
6832d862be2dfe2ff93d3411146d23f464192d283df5c14f7fe7b586e401cac5
|


