
grafana-wtf








About
grafana-wtf - grep through all Grafana entities in the spirit of git-wtf, see also Introduction to GIT WTF.
Synopsis
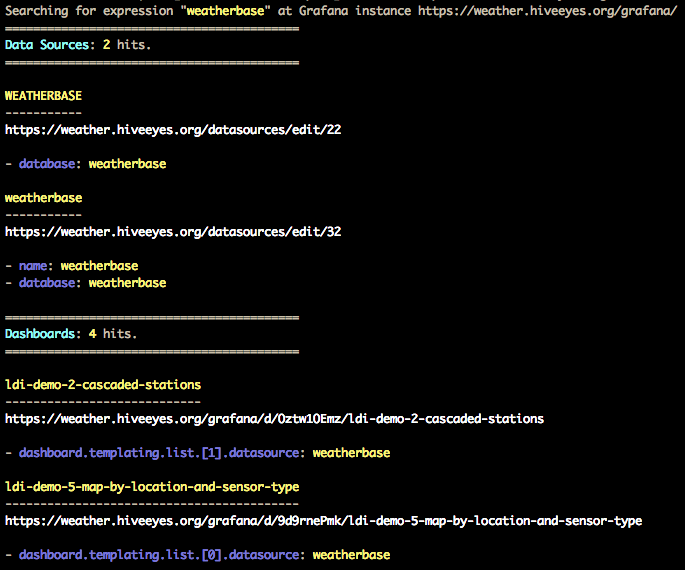
Search Grafana (dashboards and datasources) for string “weatherbase”.
grafana-wtf find weatherbase
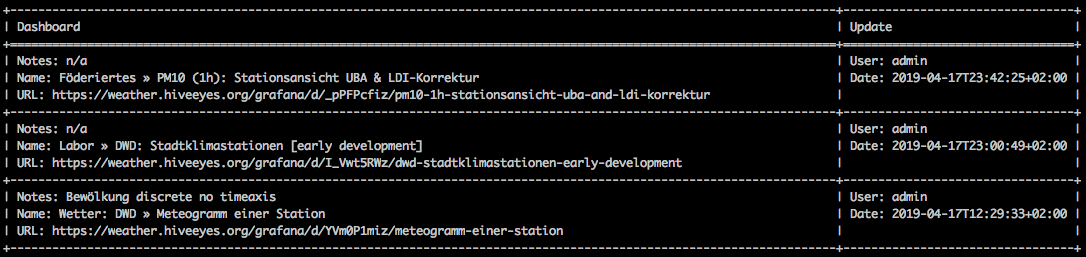
Display 50 most recent changes across all dashboards.
grafana-wtf log --number=50
Explore dashboards, datasources, and alert rules in more detail.
grafana-wtf explore dashboards
grafana-wtf explore datasources
grafana-wtf explore alerts
Explore plugins.
grafana-wtf plugins list
grafana-wtf plugins status
Run with Docker:
# Access Grafana instance on localhost, without authentication.
docker run --rm -it \
    --env GRAFANA_URL="http://host.docker.internal:3000" \
    ghcr.io/grafana-toolbox/grafana-wtf grafana-wtf info

# Access Grafana instance with authentication.
docker run --rm -it \
    --env GRAFANA_URL="https://grafana.example.org/grafana" \
    --env GRAFANA_TOKEN="eyJrIjoiWHg...dGJpZCI6MX0=" \
    ghcr.io/grafana-toolbox/grafana-wtf grafana-wtf info
Screenshots
grafana-wtf find
grafana-wtf log
Setup
Install grafana-wtf
pipx install grafana-wtf
Configure Grafana
Please take these steps to create an API key with your Grafana instance:
Go to https://daq.example.org/grafana/org/apikeys.
Choose “New API Key”.
Key name: grafana-wtf
Role: Admin
From the output curl -H "Authorization: Bearer eyJrIjoiWHg...dGJpZCI6MX0=" ..., please take note of the Bearer token. This is your Grafana API key.
Configuration
Grafana connection
To configure to which Grafana instance to connect to, and how to authenticate, use the --grafana-url and --grafana-token command line options.
Alternatively, before running grafana-wtf, you can define URL and access token of your Grafana instance by using environment variables:
export GRAFANA_URL=https://daq.example.org/grafana/
export GRAFANA_TOKEN=eyJrIjoiWHg...dGJpZCI6MX0=
In order to accept untrusted SSL certificates, append the ?verify=no query string to the GRAFANA_URL:
export GRAFANA_URL=https://daq.example.org/grafana/?verify=no
Caching
grafana-wtf will cache HTTP responses for 60 minutes by default, in order to save resources, by not hitting the server each server. You can configure that setting by using the --cache-ttl option, or the CACHE_TTL environment variable.
When invoking the program with the --drop-cache option, it will drop its cache upfront.
Usage
General information
# Display a bunch of meta information and statistics.
grafana-wtf info --format=yaml

# Display Grafana version.
grafana-wtf info --format=json | jq -r '.grafana.version'
Explore data sources
How to find unused data sources?
# Display all data sources and the dashboards using them, as well as unused data sources.
grafana-wtf explore datasources --format=yaml

# Display names of unused datasources as a flat list.
grafana-wtf explore datasources --format=json | jq -r '.unused[].datasource.name'
Explore Unified Alerting rules
Dump all alert rules (Grafana 9+):
# Display all Unified Alerting rules.
grafana-wtf explore alerts --format=json

# Display only alert rule UIDs.
grafana-wtf explore alerts --format=json | jq '.[].uid'
Explore dashboards
How to find dashboards which use non-existing data sources?
# Display some details of all dashboards, including names of missing data sources.
grafana-wtf explore dashboards --format=yaml

# Display only dashboards which have missing data sources, along with their names.
grafana-wtf explore dashboards --format=json | \
    jq '.[] | select(.datasources_missing) | .dashboard + {ds_missing: .datasources_missing[] | [.name]}'
How to find dashboards using specific data sources?
# Display all dashboards which use a specific data source, filtered by data source name.
grafana-wtf explore dashboards --format=json | jq '.[] | select(.datasources | .[].name=="<datasource_name>")'

# Display all dashboards using data sources with a specific type. Here: InfluxDB.
grafana-wtf explore dashboards --format=json | jq '.[] | select(.datasources | .[].type=="influxdb")'
How to list all queries used in all dashboards?
grafana-wtf explore dashboards --data-details --queries-only --format=json | \
    jq '.[].details | values[] | .[] | .expr,.jql,.query,.rawSql | select( . != null and . != "" )'
Searching for strings
Find the string weatherbase throughout all dashboards and data sources:
grafana-wtf find weatherbase
Replacing strings
Replace all occurrences of ldi_v2 with ldi_v3 within dashboard with UID _JJ22OZZk:
grafana-wtf --select-dashboard=_JJ22OZZk replace ldi_v2 ldi_v3
In order to preview the changes, you should use the --dry-run option beforehand:
grafana-wtf --select-dashboard=_JJ22OZZk replace ldi_v2 ldi_v3 --dry-run
Display edit history
Watching out for recent editing activity on any dashboards?
# Display 50 most recent changes across all dashboards.
grafana-wtf log --number=50
Concurrency
Use the --concurrency option, for example --concurrency=5, to enable concurrent downloading per ThreadPoolExecutor.
Examples
For discovering more command line parameters and their arguments, please invoke grafana-wtf --help and have a look at grafana-wtf examples.
Development
git clone https://github.com/grafana-toolbox/grafana-wtf
cd grafana-wtf

# Run all tests.
make test

# Run selected tests.
pytest --keepalive -vvv -k test_find_textual
1 maintainer

Metadata
1 maintainer
Release files for grafana-wtf 0.25.1
For a detailed explanation of source distributions (sdists) and built distributions (wheels), please see the package formats documentation.
Source distribution (sdist)
| File | Size | Uploaded | |
|---|---|---|---|
| grafana_wtf-0.25.1.tar.gz | 44.5 kB | Details |
Built distribution (wheel)
| File | Interpreter | ABI | Platform | Reset |
|---|---|---|---|---|
| grafana_wtf-0.25.1-py3-none-any.whl | Python 3 | none | any | Details |
Total release size: 84.3 kB
Release files / grafana_wtf-0.25.1.tar.gz
| Download URL | grafana_wtf-0.25.1.tar.gz |
|---|---|
| Size | 44.5 kB |
| Tags | Source |
|
SHA-256 checksum How to use checksums |
7bb8eca88a2c5af6a32d889cf7119655b006f02dfeebfce2cf60e0e4f08c774d
|
|
BLAKE2b-256 checksum How to use checksums |
d0380416411577e3a8be2f3851892c0132516588f23d2bf6e14752f24c6077d7
|
| Upload date | |
|
Uploaded using Trusted Publishing? What is trusted publishing? |
Yes |
| Uploaded via |
twine/7.0.0 CPython/3.13.14
|
Provenance
Provenance describes where a file came from. On PyPI, provenance is shared via attestations, which provide a verifiable record of the build or publishing details. View details, limitations and caveats.


PyPI Publish Attestation
PyPI verified that this artifact, at this checksum, originated from the publisher listed below.
Signed by GitHub Actions, verified by PyPI on Sep 30, 2026.
Transparency logRelease files / grafana_wtf-0.25.1-py3-none-any.whl
| Download URL | grafana_wtf-0.25.1-py3-none-any.whl |
|---|---|
| Size | 39.7 kB |
| Tags | Python 3 |
|
SHA-256 checksum How to use checksums |
391b516def3d968d20e0ae615e8ca4ae5853ca977c0f0a0294225dcd8c4e8128
|
|
BLAKE2b-256 checksum How to use checksums |
b52abde558085d3eb907e83052de6ae204c9faac969b6c19b588a1fd027dca0b
|
| Upload date | |
|
Uploaded using Trusted Publishing? What is trusted publishing? |
Yes |
| Uploaded via |
twine/7.0.0 CPython/3.13.14
|
Provenance
Provenance describes where a file came from. On PyPI, provenance is shared via attestations, which provide a verifiable record of the build or publishing details. View details, limitations and caveats.
PyPI Publish Attestation
PyPI verified that this artifact, at this checksum, originated from the publisher listed below.
Signed by GitHub Actions, verified by PyPI on Sep 30, 2026.
Transparency log













