
Monitor metrics in a real-time time-series line-graph (a-la perfmon.exe)

Project description
grafmon
Monitor metrics in a real-time time-series line-graph

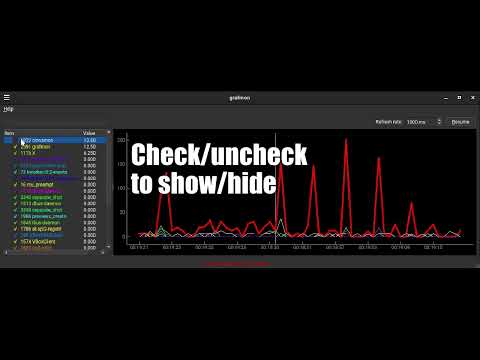
Demonstration video
Features
- Real-time time-series graph of metrics with several ways to ingest data:
- Streaming from file, socket or STDIN
- Builtin system monitors
- Custom command
- Polished graph interface
- Hover over lines to see data
- Click lines to highlight
- Pause graph updates
- Customize count of ticks along x-axis
- Customize count of labels along x-axis
- Adjustable refresh rate
- Defaults to 1000 ms
- Remembers window position/layout
Install
pip install grafmon
Usage
usage: grafmon [-h] [-m MONITOR | -c COMMAND | -s STREAM | -f [FILE]] [-r REFRESHRATE] [-t TICKS] [-l LABELS] [--list-monitors]

Monitor metrics in a real-time time-series graph

options:
  -h, --help            show this help message and exit
  -m MONITOR, --monitor MONITOR
                        Select from builtin monitors to feed data into graph [default: pcpu]
  -c COMMAND, --command COMMAND
                        User command to feed data into graph [example: ps -eo rss,pid,comm --no-headers]
  -s STREAM, --stream STREAM
                        Streaming user command to feed data into graph [example: tail -f logfile]
  -f [FILE], --file [FILE]
                        Continuously read file or STDIN to feed data into graph
  -r REFRESHRATE, --refreshrate REFRESHRATE
                        Refresh rate in milliseconds [default: 1000]
  -t TICKS, --ticks TICKS
                        Count of ticks on X axis [default: 60]
  -l LABELS, --labels LABELS
                        Count of labels on X axis [default: 10]
  --list-monitors       List available builtin monitors
Builtin monitors
avgpcpu    Average CPU% (using `ps`) over lifetime of all processes
cuc        CPU%, including dead children, in extended ##.### format of all processes
cuu        CPU% in extended ##.### format of all processes
drs        Data resident set size of all processes
pcpu       Immediate CPU% (using `top`) of all processes
pmem       Physical memory percentage of all processes
pss        Proportional share size of all processes
rbytes     Number of bytes really fetched from storage layer of all processes
rchars     Number of bytes read from storage of all processes
rops       Number of read I/O operations of all processes
rss        Resident set size (physical memory usage, in kilobytes) of all processes
sz         Physical pages used of all processes
thcount    Thread counts of all processes
trs        Text resident set (executable code memory usage) of all processes
vsz        Virtual memory usage of all processes
wbytes     Number of bytes really written to storage layer of all processes
wcbytes    Number of canceled write bytes of all processes
wchars     Number of bytes written to storage of all processes
wops       Number of write I/O operations of all processes
Custom monitors
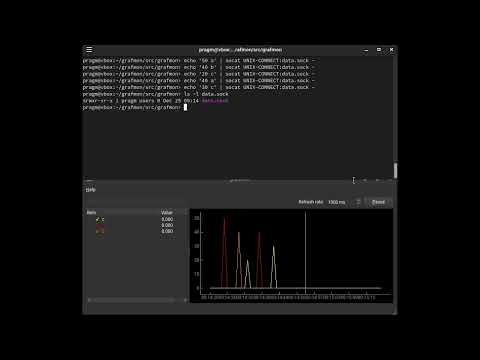
Grafmon is not limited to the builtin monitors. Grafmon also accepts user-provided commands for monitoring. Grafmon can monitor data from files, streams, sockets and STDIN. Grafmon can be used to easily monitor IoT sensors such as smart plug metrics to track power usage of appliances, and more!
Demonstration video:
Data format
The monitor must output lines in the format of <float> <string> to STDOUT. The <float>
will be the value associated with <string>. The <string> may contain spaces.
For example, a monitor for household appliance wattage consumption might output:
 110 Kitchen Refrigerator
 60 Living Room Television
 80 Office Computer
 130 Kitchen Refrigerator
 65 Living Room Television
 90 Office Computer
For system processes, it can be helpful to include the PIDs in the <string>:
10 2301 X
30 2304 python3
50 2250 qemu
15 2301 X
20 2304 python3
60 2250 qemu
Custom command
-c COMMAND, --command COMMAND
Grafmon will invoke the command every refresh-rate tick; the command must start and terminate each tick. This is ideal for executing short-lived processes to fetch data.
For example:
grafmon -c 'ps -eo pcpu,pid,comm --no-headers'
Streaming
-s STREAM, --stream STREAM
Grafmon will invoke the command once and expects the command to remain running. This is ideal for fetching data from a long-running process or log file.
For example:
 grafmon -s 'tail -f logfile -n0'
 grafmon -s 'socat UNIX-LISTEN:data.sock -'
File or STDIN
-f [FILE], --file [FILE]
Grafmon will open the file and continuously fetch data. If [FILE] is omitted, STDIN
will be opened.
For example:
socat TCP-LISTEN:1234 - | grafmon -f
Customizing ticks and labels
The count of ticks and labels along the x-axis can be customized. The default is 60 ticks and 10 labels. This is ideal for the default window size and refresh-rate, providing a graph window containing 1 minute's worth of ticks at 1000 ms per update.
If you prefer more or less ticks, use the -t TICKS, --ticks TICKS option.
If you prefer more or less labels, use the -l LABELS, --labels LABELS option.
Notes
This app is aimed at short-term use on personal laptops/desktops. For long-term monitoring of servers, you should use something like sysstat logging along with grafana/kibana.
I needed an easy-to-install local app that requires no-to-minimal set-up to graph in real-time various system metrics and custom IoT metrics, notably percentages of CPU usages for all active processes and wattage usages of my home appliances. The KDE and Gnome system monitors/task managers graph overall CPU usage rather than per-process usage.
Grafmon is inspired in part by Windows' perfmon.exe. The graph does not scroll, but instead updates in a horizontally rolling blind. A vertical line will move from left-to-right as the metrics are read each tick. When the line reaches the end, it resets back to the beginning. This allows easy hovering over of graph elements to inspect the data. A moving scrolling graph would be more difficult to hover over the lines and their peaks.
Lines may be clicked on to highlight them to more easily see them in the graph. Lines may be hovered-over to see a tooltip of their values. Their values will also appear in the status bar at the bottom of the window.
To zoom the graph in to inspect lower valued lines, you can untick the checkboxes in the list on the left. Unticking checkboxes for lines with the highest peaks will hide those lines and the graph will zoom in to fit the next highest peaks.


Download files
Download the file for your platform. If you're not sure which to choose, learn more about installing packages.
Source Distribution
Built Distribution
Filter files by name, interpreter, ABI, and platform.
If you're not sure about the file name format, learn more about wheel file names.
Copy a direct link to the current filters
File details
Details for the file grafmon-1.1.1.tar.gz.
File metadata
- Download URL: grafmon-1.1.1.tar.gz
- Upload date:
- Size: 16.9 kB
- Tags: Source
- Uploaded using Trusted Publishing? No
- Uploaded via: twine/5.1.1 CPython/3.11.10
File hashes
| Algorithm | Hash digest | |
|---|---|---|
| SHA256 |
d2078ea3ac70c74f5765b323225141d51f44632631a03bbe8cfc034cd280798b
|
|
| MD5 |
29b34ef6b5fe563a8d512490abf69273
|
|
| BLAKE2b-256 |
7c29020f7188e86a95f9c898beb6694137ba478de13d87ce358926a65e1aea09
|
File details
Details for the file grafmon-1.1.1-py3-none-any.whl.
File metadata
- Download URL: grafmon-1.1.1-py3-none-any.whl
- Upload date:
- Size: 19.7 kB
- Tags: Python 3
- Uploaded using Trusted Publishing? No
- Uploaded via: twine/5.1.1 CPython/3.11.10
File hashes
| Algorithm | Hash digest | |
|---|---|---|
| SHA256 |
d60df8987fc208dc110360eb0a267f2feb6b9cb3d90d1931ae9a12dd77357013
|
|
| MD5 |
16cc6110049d9ae2e5efc3eccf0e9bf7
|
|
| BLAKE2b-256 |
b3de481f8025c9d84e40f955f2d39a4367ce13cc633d68dd30a700bf1b084eb3
|






