An enviorment for job shop scheduling using the disjunctive graph apporach and the graph matrix datastructure.

Project description
Graph Matrix Job Shop Env
A Gymnasium Environment for Job Shop Scheduling using the Graph Matrix Representation by Błażewicz et al..
- Github: GraphMatrixJobShopEnv
- Pypi: GraphMatrixJobShopEnv
- Documentation: GraphMatrixJobShopEnv Docs
Description
A Gymnasium Environment for Job Shop Scheduling using the Graph Matrix Representation by Błażewicz et al.. It can be used to solve the Job Shop Scheduling Problem (JSP) using Reinforcement Learning with libraries like Stable Baselines3 or RLlib. A minimal working example is provided in the Quickstart section.
Quickstart
pip install <<todo>>
Visualizations
The environment offers multiple visualisation options. There are four visualisations that can be mixed and matched:
human(default): prints a Gantt chart visualisation to the console.ansi: prints a visualisation of the graph matrix and the Gantt chart to the console.debug: prints a visualisation of the graph matrix. The debugs visualisation is maps the elements of the successor lists and unknown list to the original graph indices of the takes ad uses colors to separate the different elements. It also prints the Gantt chart and some additional information.window: creates a Gantt chart visualisation in a separate window.rgb_array: creates a Gantt chart visualisation as a RGB array. This mode return the RGB array of thewindowvisualisation. This can be used to create a video of the Gantt chart visualisation.
Examples
For the following Job Shop Scheduling Problem (JSP) instance:
from graph_matrix_jsp_env.disjunctive_jsp_env import DisjunctiveGraphJspEnv
import numpy as np

if __name__ == '__main__':
    custom_jsp_instance = np.array([
        [
            [0, 1, 2, 3],  # job 0
            [0, 2, 1, 3]  # job 1
        ],
        [
            [11, 3, 3, 12],  # task durations of job 0
            [5, 16, 7, 4]  # task durations of job 1
        ]

    ], dtype=np.int32)
    env = DisjunctiveGraphJspEnv(
        jsp_instance=custom_jsp_instance,
    )
    obs, info = env.reset()
    mode = 'debug' # replace with 'human', 'ansi', 'window', 'rgb_array' for different visualizations
    env.render(mode=mode)

    for a in [5, 1, 2, 6, 3, 7, 4, 8]:
        obs, reward, done, info, _ = env.step(a)
        env.render(mode=mode)

    env.render()
The individual rendering modes result in the following visualisations:
ANSI
Debug
Defualt (Human)
State of the Project
This project is complementary material for a research paper. It will not be frequently updated.
Minor updates might occur.
Significant further development will most likely result in a new project. In that case, a note with a link will be added in the README.md of this project.
Dependencies
This project specifies multiple requirements files.
requirements.txt contains the dependencies for the environment to work. These requirements will be installed automatically when installing the environment via pip.
requirements_dev.txt contains the dependencies for development purposes. It includes the dependencies for testing, linting, and building the project on top of the dependencies in requirements.txt.
requirements_examples.txt contains the dependencies for running the examples inside the project. It includes the dependencies in requirements.txt and additional dependencies for the examples.
In this Project the dependencies are specified in the pyproject.toml file with as little version constraints as possible.
The tool pip-compile translates the pyproject.toml file into a requirements.txt file with pinned versions.
That way version conflicts can be avoided (as much as possible) and the project can be built in a reproducible way.
Development Setup
If you want to check out the code and implement new features or fix bugs, you can set up the project as follows:
Clone the Repository
clone the repository in your favorite code editor (for example PyCharm, VSCode, Neovim, etc.)
git clone <<todo>>
if you are using PyCharm, I recommend doing the following additional steps:
- mark the
srcfolder as source root (by right-clicking on the folder and selectingMark Directory as->Sources Root) - mark the
testsfolder as test root (by right-clicking on the folder and selectingMark Directory as->Test Sources Root) - mark the
resourcesfolder as resources root (by right-clicking on the folder and selectingMark Directory as->Resources Root)
at the end your project structure should look like this:
todo
Create a Virtual Environment (optional)
Most Developers use a virtual environment to manage the dependencies of their projects.
I personally use conda for this purpose.
When using conda, you can create a new environment with the name 'my-graph-jsp-env' following command:
conda create -n my-graph-jsp-env python=3.11
Feel free to use any other name for the environment or an more recent version of python. Activate the environment with the following command:
conda activate my-graph-jsp-env
Replace my-graph-jsp-env with the name of your environment, if you used a different name.
You can also use venv or virtualenv to create a virtual environment. In that case please refer to the respective documentation.
Install the Dependencies
To install the dependencies for development purposes, run the following command:
pip install -r requirements_dev.txt
pip install tox
The testing package tox is not included in the requirements_dev.txt file, because it sometimes causes issues when
using github actions.
Github Actions uses an own tox environment (namely 'tox-gh-actions'), which can cause conflicts with the tox environment on your local machine.
Reference: Automated Testing in Python with pytest, tox, and GitHub Actions.
Install the Project in Editable Mode
To install the project in editable mode, run the following command:
pip install -e .
This will install the project in editable mode, so you can make changes to the code and test them immediately.
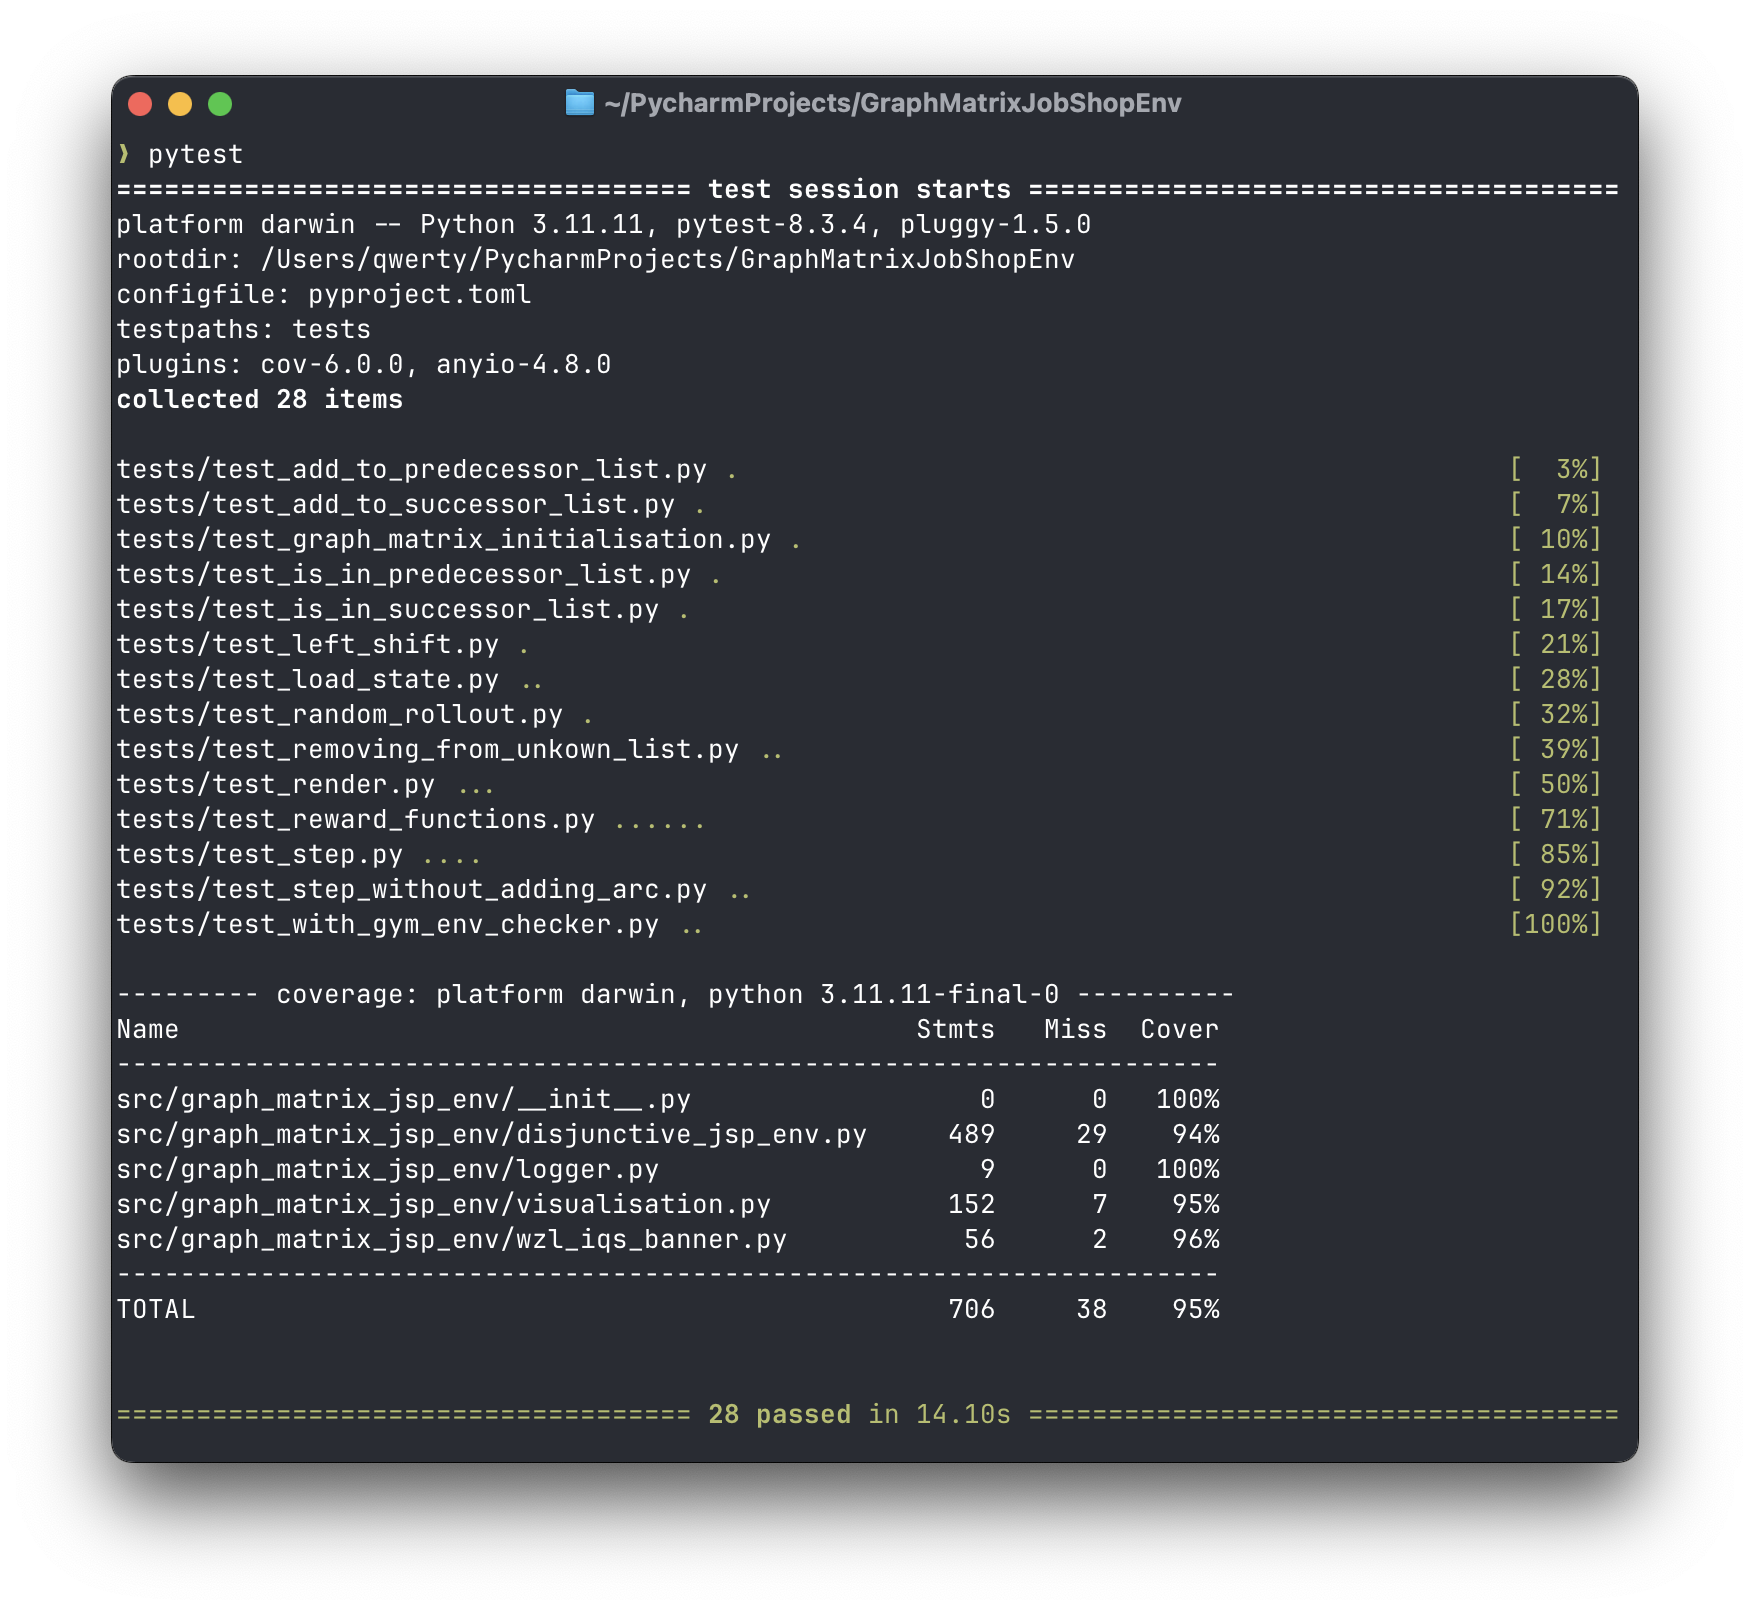
Run the Tests
This project uses pytest for testing. To run the tests, run the following command:
pytest
Here is a screenshot of what the output might look like:
For testing with tox run the following command:
tox
Here is a screenshot of what the output might look like:
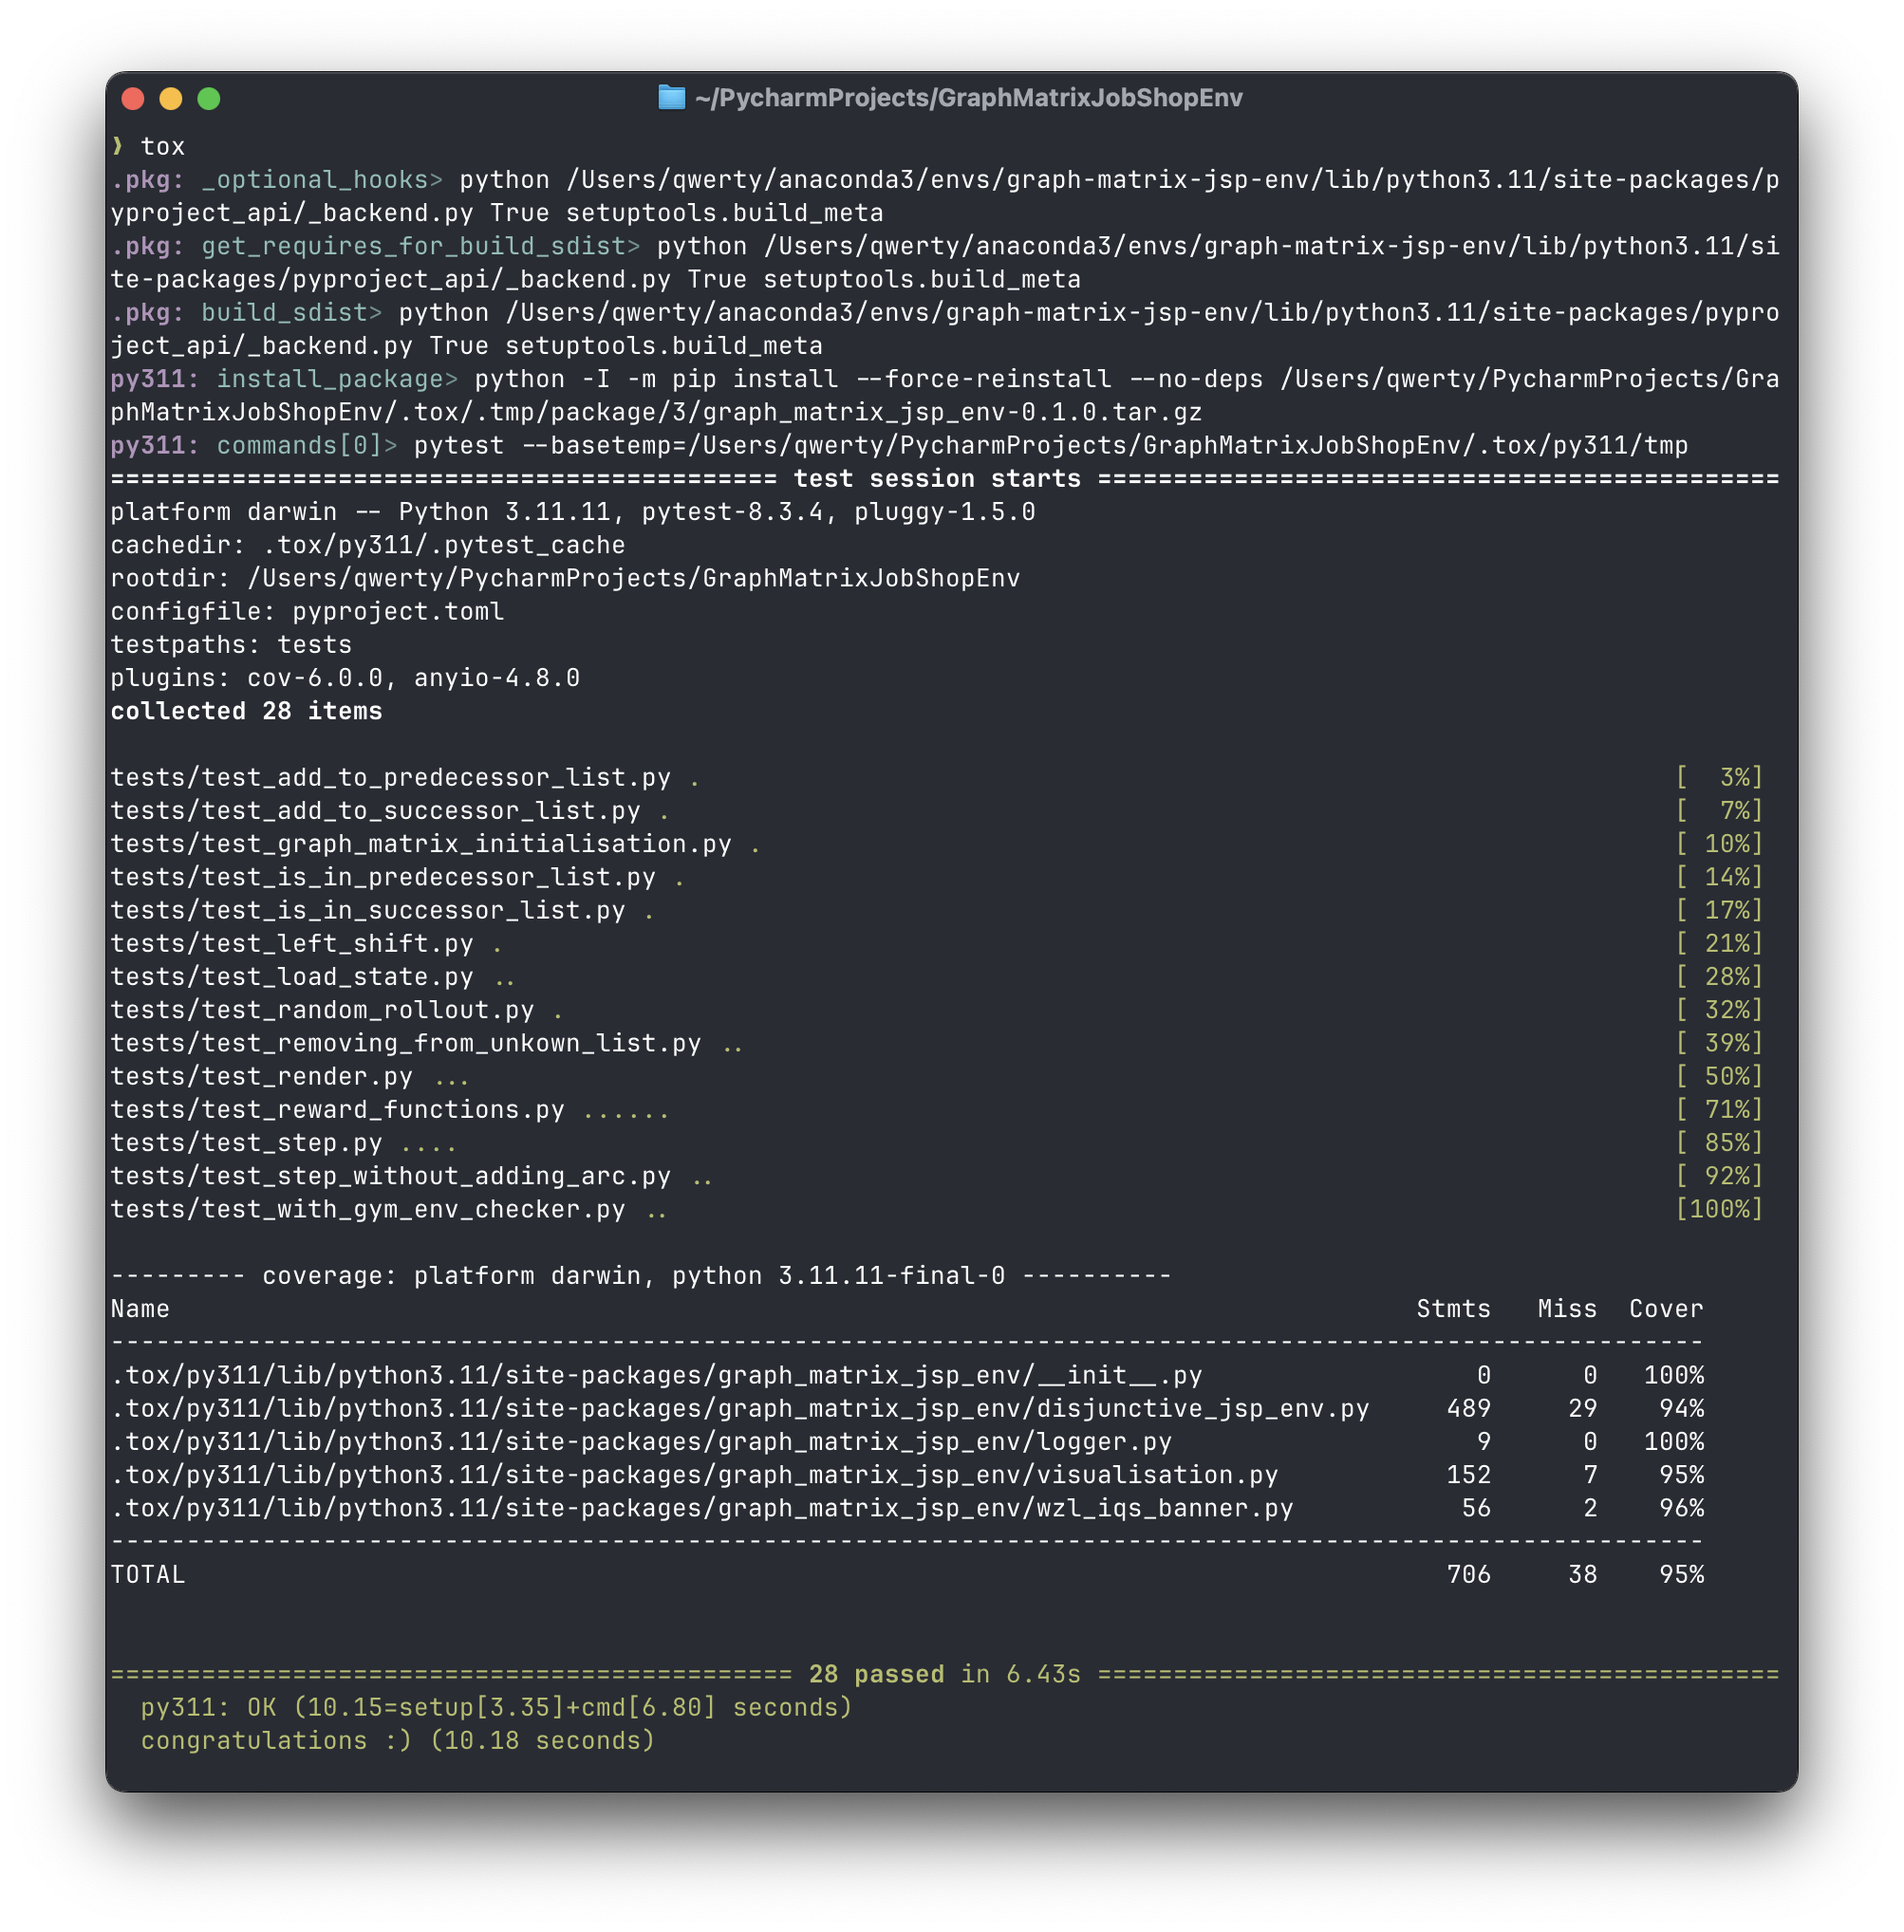
Tox will run the tests in a separate environment and will also check if the requirements are installed correctly.
Builing and Publishing the Project to PyPi
In order to publish the project to PyPi, the project needs to be built and then uploaded to PyPi.
To build the project, run the following command:
python -m build
It is considered good practice use the tool twine for checking the build and uploading the project to PyPi.
By default the build command creates a dist folder with the built project files.
To check all the files in the dist folder, run the following command:
twine check dist/**
If the check is successful, you can upload the project to PyPi with the following command:
twine upload dist/**
Documentation
This project uses sphinx for generating the documentation.
It also uses a lot of sphinx extensions to make the documentation more readable and interactive.
For example the extension myst-parser is used to enable markdown support in the documentation (instead of the usual .rst-files).
It also uses the sphinx-autobuild extension to automatically rebuild the documentation when changes are made.
By running the following command, the documentation will be automatically built and served, when changes are made (make sure to run this command in the root directory of the project):
sphinx-autobuild ./docs/source/ ./docs/build/html/
This project features most of the extensions featured in this Tutorial: Document Your Scientific Project With Markdown, Sphinx, and Read the Docs | PyData Global 2021.
Contact
If you have any questions or feedback, feel free to contact me via email or open an issue on repository.


Download files
Download the file for your platform. If you're not sure which to choose, learn more about installing packages.
Source Distribution
Built Distribution
Filter files by name, interpreter, ABI, and platform.
If you're not sure about the file name format, learn more about wheel file names.
Copy a direct link to the current filters
File details
Details for the file graph_matrix_jsp_env-0.1.0.tar.gz.
File metadata
- Download URL: graph_matrix_jsp_env-0.1.0.tar.gz
- Upload date:
- Size: 31.1 kB
- Tags: Source
- Uploaded using Trusted Publishing? No
- Uploaded via: twine/6.0.1 CPython/3.11.11
File hashes
| Algorithm | Hash digest | |
|---|---|---|
| SHA256 |
465468090f98ed2bbadf4a9436119babbfdde02e45915c7e168a3d02cb16e5cb
|
|
| MD5 |
b93e34990ea4480d7620ca2896784faa
|
|
| BLAKE2b-256 |
72a6b8bd294b5dddf89b2d0ac0a638daf84310a49c8d865f93bd235f9c804c35
|
File details
Details for the file graph_matrix_jsp_env-0.1.0-py3-none-any.whl.
File metadata
- Download URL: graph_matrix_jsp_env-0.1.0-py3-none-any.whl
- Upload date:
- Size: 18.2 kB
- Tags: Python 3
- Uploaded using Trusted Publishing? No
- Uploaded via: twine/6.0.1 CPython/3.11.11
File hashes
| Algorithm | Hash digest | |
|---|---|---|
| SHA256 |
6b08b381bca5fe28106fc4c81ad7fb9df0d8d5021f472c2dcabf054f7eecc511
|
|
| MD5 |
7dc19259ed3c765bdf6311171b1c8777
|
|
| BLAKE2b-256 |
3623d2da53879af5bfebab1db82902a09853f2fb04712ded67c6eaed7c238f20
|


