
graphsight


See which retrieved documents your agent actually used — and which it ignored.
Your agent answered a question. Which documents did it actually pull? Which of those did the answer come from? What scores did they get, and how are they connected? Most stacks make you dig through logs. Graphsight renders the run as an interactive graph in your browser — one command, zero dependencies, nothing leaves your machine.
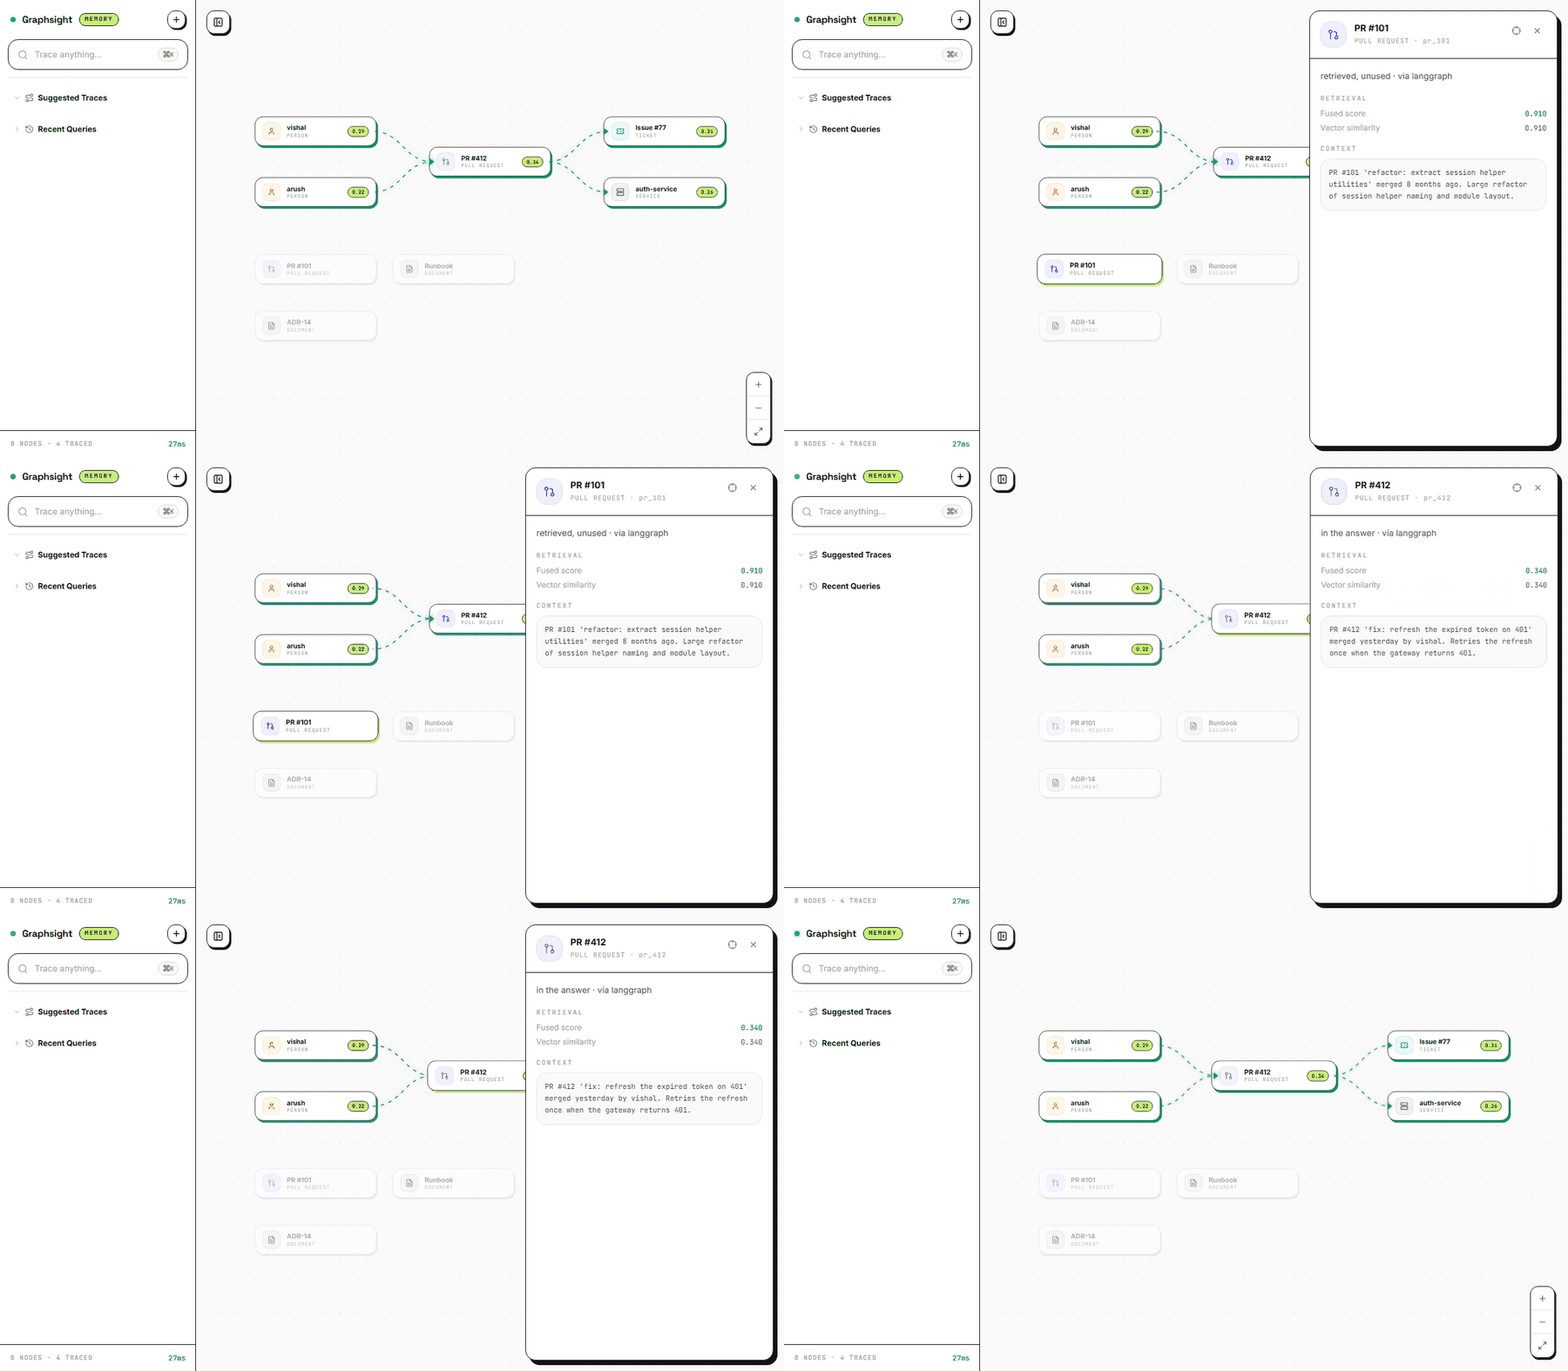
A real run. PR #101 scored 0.910 — the highest of anything retrieved — and the answer
never used it. PR #412 scored 0.340 and is the one that answered.
pip install graphsight
graphsight path/to/trace_state.json
Retrieved vs. used
The signal that isn't in your logs. When a trace carries the final answer, every retrieved item is scored by lexical overlap against it and rendered either highlighted (surfaced in the answer) or dimmed with the label "retrieved, unused." That splits the two classic retrieval failures at a glance:
- Right document retrieved, ignored by the model → a dimmed node with a high retrieval score. Your retriever worked; your prompt or context order didn't.
- Wrong document trusted → a highlighted node that shouldn't be.
The overlap is a lexical heuristic, labeled as such (threshold 0.2). No LLM re-reads your evidence, and no score is invented — a trace with no answer attached makes no usage claims at all.
What else you get
- Every retrieved item as a typed node — PR, Service, Person, Ticket, Document, Repo, Library, Team, Tool — with its retrieval score.
- Relational paths between results — person → authored → PR → resolves → issue — the chain of evidence, not just a ranked list.
- An inspector on every node: underlying content, score, source link.
- The execution timeline of the run: each agent step, each retriever call, per-span timings, and which retrieval arm (vector / graph) produced the results.
Requirements
| Python | ≥ 3.10 |
| Runtime dependencies | none (stdlib only) |
| Platforms | Windows, macOS, Linux |
| Browser | any modern browser |
Usage
graphsight [trace] [--port PORT] [--no-browser]
| Argument | Default | Description |
|---|---|---|
trace |
— | A trace_state.json file, or a directory of them (e.g. .graphsight/) to browse run history. Optional — omit to open the import page and drag-and-drop or paste JSON instead. |
--port |
4630 |
Local port to serve on. |
--no-browser |
off | Start the server without opening a browser window. |
The server binds to 127.0.0.1 only and runs until you press Ctrl+C.
Run history
Point graphsight at a directory and it becomes a run browser — every
trace listed by query and time, one click to open:
graphsight .graphsight/
The graphsight-langgraph
capture() helper appends every agent run there automatically, so your
debugging history accumulates with zero ceremony — no setup, no database.
Because the history is a directory of plain files, you can compare two runs side by side: what the retrieval returned before a prompt change and after it, which items appeared or vanished, and which flipped between used and ignored. That is usually the fastest way to answer "what did my edit actually do to retrieval?"
Sharing traces with your team
A trace is one self-contained JSON file — no account or backend needed to share it:
- Send the file. A teammate with
graphsightinstalled runsgraphsight trace.json. Works in a DM, a ticket attachment, a CI artifact. - Link it. A deployed Graphsight frontend opens any publicly reachable
trace via
…/memory/import?src=<url-to-json>— host the JSON on a gist or artifact store and share the link. (The host must allow cross-origin GETs; raw gists do.) - Commit it. Trace files in the repo next to the incident or PR they explain make retrieval debugging part of the review record.
Producing traces
Graphsight renders any file matching its trace JSON contract. Current producers:
-
graphsight-langgraph — instrument any LangGraph agent with a single callback handler, or trace a GitHub repository in one command:
pip install "graphsight-langgraph[example]"
graphsight-github-trace langchain-ai/langgraph "who fixed the recent streaming bugs?"
graphsight graphsight_out/trace_state.json
-
The Graphsight graph-memory engine — the backend this project grew out of: GitHub events become a live knowledge graph with typed, timestamped edges (
AUTHORED,RESOLVES,TOUCHES), queried by a hybrid vector + graph router. Its/api/traceresponses are the same shape. See the main repository.
Adapters for LlamaIndex and raw OpenTelemetry spans are planned; all producers emit the same schema and render in this same viewer.
Writing your own producer
The minimum contract is small — a JSON object with:
{
  "query": "the question that was asked",          // required, string
  "graph": {
    "nodes": [{ "id", "label", "type", "score", "meta": { "snippet", "sourceUrl" } }],
    "edges": [{ "id", "source", "target", "relation", "confidence" }]
  },
  "steps":   [ /* execution timeline, optional */ ],
  "metrics": { "queryTimeSec": 0.004 }             // optional
}
Node positions are computed client-side; emitters never deal with layout. The complete schema and a reference emitter live in the graphsight-langgraph source.
Security and privacy
- The dependency list is empty by design: the UI is a bundled static build
(Vite + React + React Flow) served by Python's stdlib
http.server. - Binds to
127.0.0.1— not reachable from other machines. - No accounts, no telemetry, no outbound network calls. Your traces stay on your disk.
Troubleshooting
| Symptom | Cause / fix |
|---|---|
Address already in use |
Another process holds the port — pass --port 4631. |
| Browser doesn't open | Some environments (SSH, WSL, containers) can't launch one — start with --no-browser and open the printed URL yourself. |
Bundled UI missing error |
Broken installation — pip install --force-reinstall graphsight. |
| Page loads but trace doesn't | The JSON didn't match the contract — the import page shows the specific validation error. |
Links
- Source & issue tracker: github.com/Kcodess2807/graphsight
- LangGraph adapter: graphsight-langgraph on PyPI
- Beta test script: BETA.md
License
MIT © Arush Karnatak
1 maintainer

Release files for graphsight 0.3.1
For a detailed explanation of source distributions (sdists) and built distributions (wheels), please see the package formats documentation.
Source distribution (sdist)
| File | Size | Uploaded | |
|---|---|---|---|
| graphsight-0.3.1.tar.gz | 1.2 MB | Details |
Built distribution (wheel)
| File | Interpreter | ABI | Platform | Reset |
|---|---|---|---|---|
| graphsight-0.3.1-py3-none-any.whl | Python 3 | none | any | Details |
Total release size: 2.4 MB
Release files / graphsight-0.3.1.tar.gz
| Download URL | graphsight-0.3.1.tar.gz |
|---|---|
| Size | 1.2 MB |
| Tags | Source |
|
SHA-256 checksum How to use checksums |
bcb801a345a6901a06141af93ebc3b9c1a4ba71cd31119dfdc1c0ec70bfe1c4f
|
|
BLAKE2b-256 checksum How to use checksums |
45d69ebc82b31c70e405c09320033fee7d19f701f00d751e605d1e36de3d3ff6
|
| Upload date | |
|
Uploaded using Trusted Publishing? What is trusted publishing? |
No |
| Uploaded via |
twine/6.2.0 CPython/3.13.7
|
Release files / graphsight-0.3.1-py3-none-any.whl
| Download URL | graphsight-0.3.1-py3-none-any.whl |
|---|---|
| Size | 1.2 MB |
| Tags | Python 3 |
|
SHA-256 checksum How to use checksums |
5fbba8bab4f3f2cf719925ab68ead791b8fccc07ab4421f201e5937a8f2923ca
|
|
BLAKE2b-256 checksum How to use checksums |
6d8729facec22c95dd8d4b2103357fd6a9f7270f3cf158f2fc9f5ce3d5152f99
|
| Upload date | |
|
Uploaded using Trusted Publishing? What is trusted publishing? |
No |
| Uploaded via |
twine/6.2.0 CPython/3.13.7
|














