GriTS metrics

Project description
GriTS: Grid Table Similarity
GriTS is a Python package for evaluating table extraction (TE) and table structure recognition (TSR) using the Grid Table Similarity (GriTS) metric.
$$\text{GriTS}f(\mathbf{A}, \mathbf{B}) = \frac{2\sum{i,j} f(\mathbf{\tilde{A}}{i,j}, \mathbf{\tilde{B}}{i,j})} {{|\mathbf{A}|} + {|\mathbf{B}|}}$$
About
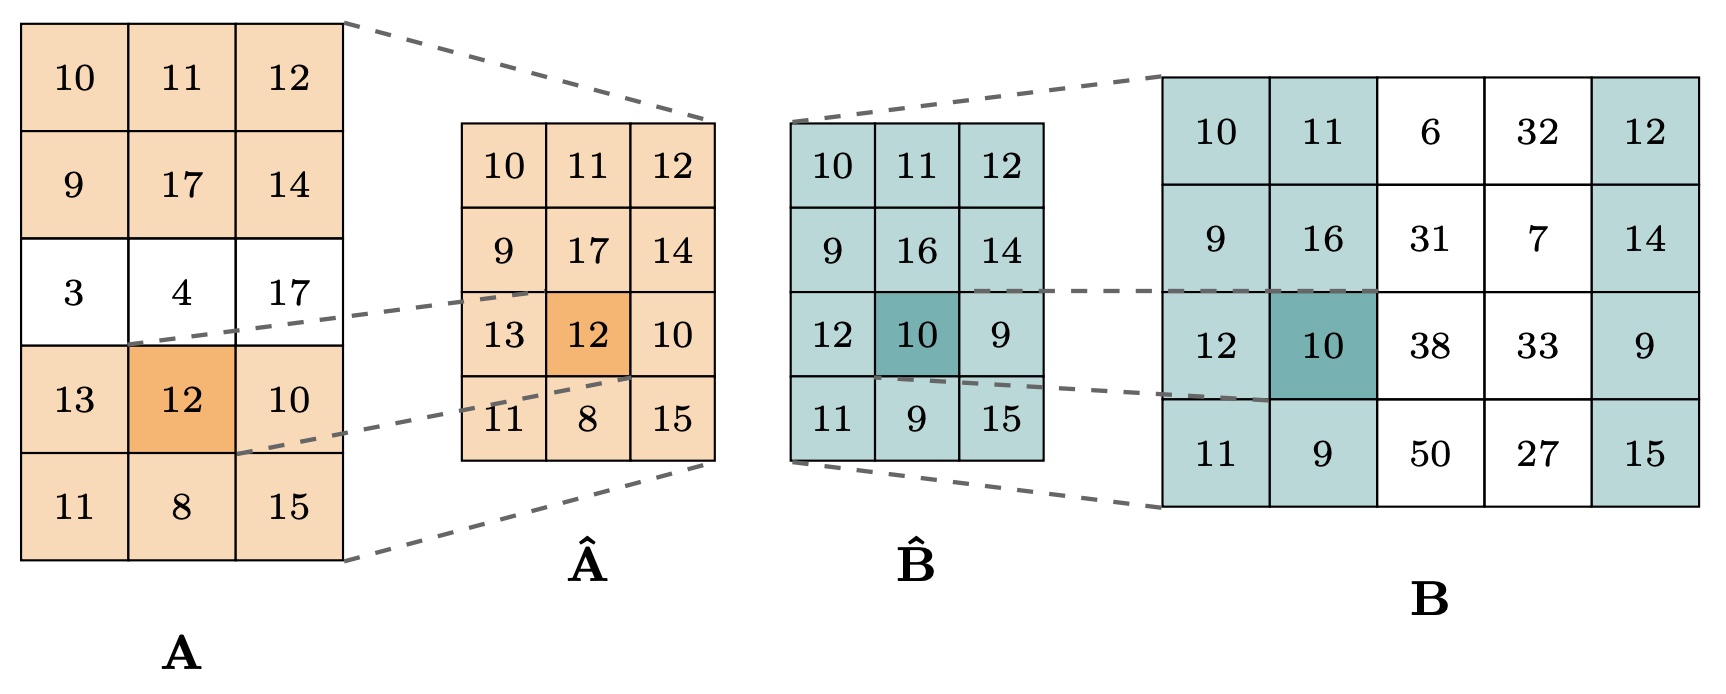
The original GriTS metric was proposed in GriTS: Grid Table Similarity Metric for Table Structure Recognition for measuring the similarity between one predicted table and one ground truth table (the traditional TSR task). It treats each table as a matrix (grid) and computes a similarity between matrices (grids). Different versions of GriTS use different choices of function f(A_ij, B_ij) for computing the similarity between two individual elements in the grids.
Subsequent work PubTables-v2: A new large-scale dataset for full-page and multi-page table extraction generalized GriTS for table extraction (TE), including at the single-page and full-document level. In this general case, GriTS evaluates a list of predicted tables against a list of ground truth tables, assuming no correspondence is given between the two. GriTS determines the one-to-one correspondence that maximizes their aggregate similarity using the Hungarian algorithm.
In the special case of one predicted table and one ground truth table (traditional TSR task), GriTS for TE is equivalent to GriTS for TSR.
But there are now two different ways to aggregate the score for an entire ground truth dataset.
- Original way (macro F1 score): compute GriTS (which is a pseudo-F1 score) for each individual sample, then average the GriTS score over all samples.
- New way (micro F1 score): compute the true positive score for each individual sample, then compute GriTS as the pseudo-F1 score for the total true positive score for the entire dataset.
We recommend aggregating GriTS the new way, which is the default choice in this package. The old way is supported for reproducing prior TSR work.
Installation
pip install grits-metric
Requires Python >= 3.10.
Quick start
Computing GriTSTop (GriTS-Top) and GriTSCon (GriTS-Con) for two tables in HTML format (traditional TSR task)
Here we illustrate a basic example converting two tables in HTML format to their grid representations, then calculating GriTS-Top and GriTS-Con.
from grits import grits_con, grits_top, html_to_grids

# Define ground-truth and predicted tables as HTML strings
true_html = "<table><tr><td>Name</td><td>Score</td></tr><tr><td>Alice</td><td>95</td></tr></table>"
pred_html = "<table><tr><td>Name</td><td>Score</td></tr><tr><td>Alice</td><td>90</td></tr></table>"

# Convert each HTML table to a dictionary containing content (grid-con) and topology (grid-top) grids
true_grids = html_to_grids(true_html)
pred_grids = html_to_grids(pred_html)

# Compute GriTS-Top between the two topology grids
grits_top_score, _, _ = grits_top(true_grids["top"], pred_grids["top"])

# Compute GriTS-Con between the two content grids
grits_con_score, _, _ = grits_con(true_grids["con"], pred_grids["con"])

print(f"GriTS_Top: {grits_top_score:.4f}") # GriTS_Top: 1.0000
print(f"GriTS_Con: {grits_con_score:.4f}") # GriTS_Con: 0.8750
Computing GriTS-Top and GriTS-Con for two lists of tables in HTML format (general TE task)
When evaluating table extraction for a single input, such as a single page of a document, where there are potentially multiple predicted and ground truth tables with no known correspondence, GriTS uses the Hungarian algorithm to find the optimal one-to-one matching between ground-truth and predicted tables to maximize their aggregate score.
from grits import hungarian_grits_con, hungarian_grits_top, html_to_grids

# Two ground-truth tables on a single page
true_htmls = [
    "<table><tr><td>Name</td><td>Score</td></tr><tr><td>Alice</td><td>95</td></tr></table>",
    "<table><tr><td>City</td><td>Pop</td></tr><tr><td>NYC</td><td>8M</td></tr></table>",
]

# Two predicted tables on a single page (order may differ from ground truth)
pred_htmls = [
    "<table><tr><td>City</td><td>Pop</td></tr><tr><td>NYC</td><td>8M</td></tr></table>",
    "<table><tr><td>Name</td><td>Score</td></tr><tr><td>Alice</td><td>90</td></tr></table>",
]

# Convert each HTML table in each list to a dictionary containing content (grid-con) and topology (grid-top) grids
true_grids = [html_to_grids(html) for html in true_htmls]
pred_grids = [html_to_grids(html) for html in pred_htmls]

# Use the Hungarian algorithm to find the optimal matching and compute GriTS
grits_top_score, _, _ = hungarian_grits_top(
    [grid["top"] for grid in true_grids], [grid["top"] for grid in pred_grids]
)
grits_con_score, _, _ = hungarian_grits_con(
    [grid["con"] for grid in true_grids], [grid["con"] for grid in pred_grids]
)

print(f"GriTS_Top: {grits_top_score:.4f}") # GriTS_Top: 1.0000
print(f"GriTS_Con: {grits_con_score:.4f}") # GriTS_Con: 0.9375
Benchmarking table extraction with GritsEvaluator
The above examples are useful to debug individual samples and get comfortable with using the GriTS metric.
Once you are comfortable with computing GriTS for individual samples, you should switch to using GritsEvaluator for benchmarking TE and TSR.
GritsEvaluator handles:
- Table format conversion
- Scoring individual samples with multiple metrics
- Computing aggregate metrics over a collection of samples
Using GritsEvaluator to aggregate GriTS across a collection of samples in HTML format
In this example, we aggregate GriTS-Top and GriTS-Con over a dataset containing two samples. The first sample has a 3x3 table that is predicted correctly. The second sample has a 1x2 table where the predictions have wrong content and wrong structure.
from grits import GritsEvaluator

evaluator = GritsEvaluator(metrics=["top", "con"])

# Each sample is a pair of (true_htmls, pred_htmls) lists
samples = [
    # Sample 1: large table (3x3), prediction is correct
    (
        ["<table><tr><td>A</td><td>B</td><td>C</td></tr><tr><td>D</td><td>E</td><td>F</td></tr><tr><td>G</td><td>H</td><td>I</td></tr></table>"],
        ["<table><tr><td>A</td><td>B</td><td>C</td></tr><tr><td>D</td><td>E</td><td>F</td></tr><tr><td>G</td><td>H</td><td>I</td></tr></table>"],
    ),
    # Sample 2: one ground-truth table (1x2), but two predicted tables with wrong content and structure
    (
        ["<table><tr><td>X</td><td>Y</td></tr></table>"],
        [
            "<table><tr><td>A</td></tr><tr><td>B</td></tr></table>",
            "<table><tr><td>P</td><td>Q</td></tr><tr><td>R</td><td>S</td></tr></table>",
        ],
    ),
]

# Evaluate each sample (conversion from HTML to grid representation is handled within this function)
for true_htmls, pred_htmls in samples:
    evaluator.eval_htmls(true_htmls, pred_htmls)

results = evaluator.compute_grits()

print(f"GriTS_Top: {results['grits_top']:.4f}") # GriTS_Top: 0.8462
print(f"GriTS_Con: {results['grits_con']:.4f}") # GriTS_Con: 0.6923
New aggregate metrics versus old aggregate metrics
To compute the new aggregate metrics for TE and TSR, use evaluator.compute_grits() like above.
results = evaluator.compute_grits()

print(f"GriTS_Top:           {results['grits_top']:.4f}") # 0.8462
print(f"GriTS_Top Precision: {results['grits_top_precision']:.4f}") # 0.7333
print(f"GriTS_Top Recall:    {results['grits_top_recall']:.4f}") # 1.0000
print(f"GriTS_Con:           {results['grits_con']:.4f}") # 0.6923
print(f"GriTS_Con Precision: {results['grits_con_precision']:.4f}") # 0.6000
print(f"GriTS_Con Recall:    {results['grits_con_recall']:.4f}") # 0.8182
In the new way, we sum the true positive score over all table cells in all samples, and compute GriTS as the pseudo-F1 score (along with precision and recall).
To compute the old aggregate metrics used previously for TSR, use evaluator.compute_mean_grits_per_sample().
results = evaluator.compute_mean_grits_per_sample()

print(f"Mean GriTS_Top per sample:           {results['mean_grits_top_per_sample']:.4f}") # 0.7500
print(f"Mean GriTS_Top Precision per sample: {results['mean_grits_top_precision_per_sample']:.4f}") # 0.6667
print(f"Mean GriTS_Top Recall per sample:    {results['mean_grits_top_recall_per_sample']:.4f}") # 1.0000
print(f"Mean GriTS_Con per sample:           {results['mean_grits_con_per_sample']:.4f}") # 0.5000
print(f"Mean GriTS_Con Precision per sample: {results['mean_grits_con_precision_per_sample']:.4f}") # 0.5000
print(f"Mean GriTS_Con Recall per sample:    {results['mean_grits_con_recall_per_sample']:.4f}") # 0.5000
In the old way, each of the metrics is first computed for each individual sample. Then we take the mean value of each metric over all samples.
Table representations
The GriTS code evaluates tables in their grid (matrix) representations.
Converting from HTML to grids
Tables in HTML format can be converted to grid-top and grid-con.
from grits import html_to_grids

grids = html_to_grids("<table><tr><td>A</td><td>B</td></tr></table>")

print(grids["con"]) # [['A', 'B']]
print(grids["top"]) # [[[0, 0, 1, 1], [0, 0, 1, 1]]]
Converting from TableCell to grids
Tables in HTML format do not contain bounding box information for cells.
To compute GriTS-Loc in addition to GriTS-Top and GriTS-Con, you can use the TableCell format to represent a table, then convert to all three grid types.
from grits import TableCell, cell_list_to_grid_top, cell_list_to_grid_con, cell_list_to_grid_loc

# Define a table as a list of TableCells with bounding boxes
table_cell_list = [
    TableCell(row_nums=[0], column_nums=[0], cell_text="Name", bbox=[0, 0, 50, 20], is_column_header=True),
    TableCell(row_nums=[0], column_nums=[1], cell_text="Score", bbox=[50, 0, 100, 20], is_column_header=True),
    TableCell(row_nums=[1], column_nums=[0], cell_text="Alice", bbox=[0, 20, 50, 40]),
    TableCell(row_nums=[1], column_nums=[1], cell_text="95", bbox=[50, 20, 100, 40]),
]

# Convert table in TableCell list format to topology grid (grid-top), content grid (grid-con), and location grid (grid-loc).
grid_top = cell_list_to_grid_top(table_cell_list)
print(grid_top) # [[[0, 0, 1, 1], [0, 0, 1, 1]], [[0, 0, 1, 1], [0, 0, 1, 1]]]

grid_con = cell_list_to_grid_con(table_cell_list)
print(grid_con) # [['Name', 'Score'], ['Alice', '95']]

grid_loc = cell_list_to_grid_loc(table_cell_list)
print(grid_loc) # [[[0, 0, 50, 20], [50, 0, 100, 20]], [[0, 20, 50, 40], [50, 20, 100, 40]]]
Computing all three GriTS metrics simultaneously using the TableCell format
The following example illustrates computing all three metrics for two tables in TableCell format using GritsEvaluator. The evaluator handles the conversion from TableCell lists to grids internally.
from grits import GritsEvaluator, TableCell

evaluator = GritsEvaluator(metrics=["top", "con", "loc"])

# Define ground-truth and predicted tables as lists of TableCells with bounding boxes
true_table = [
    TableCell(row_nums=[0], column_nums=[0], cell_text="Name", bbox=[0, 0, 50, 20]),
    TableCell(row_nums=[0], column_nums=[1], cell_text="Score", bbox=[50, 0, 100, 20]),
    TableCell(row_nums=[1], column_nums=[0], cell_text="Alice", bbox=[0, 20, 50, 40]),
    TableCell(row_nums=[1], column_nums=[1], cell_text="95", bbox=[50, 20, 100, 40]),
]
pred_table = [
    TableCell(row_nums=[0], column_nums=[0], cell_text="Name", bbox=[0, 0, 50, 20]),
    TableCell(row_nums=[0], column_nums=[1], cell_text="Score", bbox=[50, 0, 100, 20]),
    TableCell(row_nums=[1], column_nums=[0], cell_text="Alice", bbox=[0, 20, 55, 42]),
    TableCell(row_nums=[1], column_nums=[1], cell_text="90", bbox=[55, 20, 100, 42]),
]

# Evaluate the sample (conversion from TableCell to grid representation is handled internally)
evaluator.eval_table_cell_lists([true_table], [pred_table])

results = evaluator.compute_grits()

print(f"GriTS_Top: {results['grits_top']:.4f}") # GriTS_Top: 1.0000
print(f"GriTS_Con: {results['grits_con']:.4f}") # GriTS_Con: 0.8750
print(f"GriTS_Loc: {results['grits_loc']:.4f}") # GriTS_Loc: 0.9130
Table extraction (TE) versus table structure recognition (TSR)
GritsEvaluator evaluates table extraction (TE) performance.
Evaluation for TSR is a special case of evaluation for TE.
In all cases, we use GritsEvaluator and evaluate a list of ground truth tables with a list of predicted tables.
TSR corresponds to the case where there is exactly one ground truth table in the list and one predicted table in the list.
evaluator.eval_table_cell_lists([true_table], [pred_table]) # TSR evaluation, a special case of TE evaluation
Metrics
| Metric | Function | Measures |
|---|---|---|
| GriTSCon | grits_con |
Cell text content similarity (using LCS) |
| GriTSTop | grits_top |
Cell topology / spanning structure (using IoU of relative spans) |
| GriTSLoc | grits_loc |
Cell spatial location similarity (using IoU of bounding boxes) |
These functions return a tuple of (F1-score, precision, recall). For more detailed results, use grits_con_matching, grits_top_matching, and grits_loc_matching, which return a GritsMatchingResult dataclass with named fields such as true_positive_score, true_grid_scores, and is_exact_match.
For evaluating multiple tables on a page with optimal matching, use hungarian_grits_con_matching, hungarian_grits_top_matching, and hungarian_grits_loc_matching. These return a HungarianGritsMatchingResult dataclass with named fields such as true_positive_score, matched_true_indices, and num_exact_grid_matches.
References
- B. Smock, R. Pesala, R. Abraham. GriTS: Grid Table Similarity Metric for Table Structure Recognition. ICDAR 2023.
- B. Smock, V. Faucon-Morin, M. Sokolov, L. Liang, T. Khanam, A. Ramesh, M. Courtland. PubTables-v2: A New Large-Scale Dataset for Full-Page and Multi-Page Table Extraction. 2025.
License
Licensed under the MIT License. See LICENSE for details.
Copyright 2025-present Kensho Technologies, LLC.
Release history Release notifications | RSS feed

Download files
Download the file for your platform. If you're not sure which to choose, learn more about installing packages.
Source Distribution
Built Distribution
Filter files by name, interpreter, ABI, and platform.
If you're not sure about the file name format, learn more about wheel file names.
Copy a direct link to the current filters
File details
Details for the file grits_metric-0.6.0.tar.gz.
File metadata
- Download URL: grits_metric-0.6.0.tar.gz
- Upload date:
- Size: 39.3 kB
- Tags: Source
- Uploaded using Trusted Publishing? No
- Uploaded via: twine/6.2.0 CPython/3.10.13
File hashes
| Algorithm | Hash digest | |
|---|---|---|
| SHA256 |
e9145ad1bba89b924dac63e27320467af53471bb9c86dd7014ffdb9ed273f10a
|
|
| MD5 |
6baa135406da79f32e8068bb5b306ab1
|
|
| BLAKE2b-256 |
ab82a93148af14ffb5bb5aaf2ca282a142e65f7eeb5141806d32732016bfaadd
|
File details
Details for the file grits_metric-0.6.0-py3-none-any.whl.
File metadata
- Download URL: grits_metric-0.6.0-py3-none-any.whl
- Upload date:
- Size: 20.0 kB
- Tags: Python 3
- Uploaded using Trusted Publishing? No
- Uploaded via: twine/6.2.0 CPython/3.10.13
File hashes
| Algorithm | Hash digest | |
|---|---|---|
| SHA256 |
bf03c0fa0a4018cc0df7d8ec84a90c6969ada8435a35bde6d99c24030fa86ba2
|
|
| MD5 |
7a83b9397fce27caf94a811808be2113
|
|
| BLAKE2b-256 |
939726ccdc574bad2944e1665cc0aa3ba1341c72a44ac90830f24467282ecee8
|


