No project description provided

Project description

A One-Stop Large-Scale Graph Computing System from Alibaba


GraphScope is a unified distributed graph computing platform that provides a one-stop environment for performing diverse graph operations on a cluster of computers through a user-friendly Python interface. GraphScope makes multi-staged processing of large-scale graph data on compute clusters simple by combining several important pieces of Alibaba technology: including GRAPE, MaxGraph, and Graph-Learn (GL) for analytics, interactive, and graph neural networks (GNN) computation, respectively, and the Vineyard store that offers efficient in-memory data transfers.
Visit our website at graphscope.io to learn more.
Getting Started
We provide a Playground with a managed JupyterLab. Try GraphScope straight away in your browser!
GraphScope supports run in standalone mode or on clusters managed by Kubernetes within containers. For quickly getting started, let's begin with the standalone mode.
Installation for Standalone Mode
GraphScope pre-compiled package is distributed as a python package and can be easily installed with pip.
pip3 install graphscope
Note that graphscope requires Python >= 3.6 and pip >= 19.0. The package is built for and tested on the most popular Linux (Ubuntu 18.04+ / CentOS 7+) and macOS (version 10.15+) distributions. For Windows users, you may want to install Ubuntu on WSL2 to use this package.
Next, we will walk you through a concrete example to illustrate how GraphScope can be used by data scientists to effectively analyze large graphs.
Demo: Node Classification on Citation Network
ogbn-mag is a heterogeneous network composed of a subset of the Microsoft Academic Graph. It contains 4 types of entities(i.e., papers, authors, institutions, and fields of study), as well as four types of directed relations connecting two entities.
Given the heterogeneous ogbn-mag data, the task is to predict the class of each paper. Node classification can identify papers in multiple venues, which represent different groups of scientific work on different topics. We apply both the attribute and structural information to classify papers. In the graph, each paper node contains a 128-dimensional word2vec vector representing its content, which is obtained by averaging the embeddings of words in its title and abstract. The embeddings of individual words are pre-trained. The structural information is computed on-the-fly.
Loading a graph
GraphScope models graph data as property graph, in which the edges/vertices are labeled and have many properties.
Taking ogbn-mag as example, the figure below shows the model of the property graph.
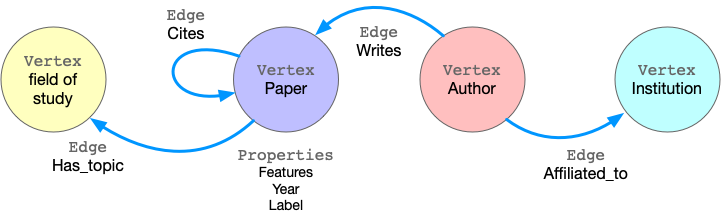
This graph has four kinds of vertices, labeled as paper, author, institution and field_of_study. There are four kinds of edges connecting them, each kind of edges has a label and specifies the vertex labels for its two ends. For example, cites edges connect two vertices labeled paper. Another example is writes, it requires the source vertex is labeled author and the destination is a paper vertex. All the vertices and edges may have properties. e.g., paper vertices have properties like features, publish year, subject label, etc.
To load this graph to GraphScope with our retrieval module, please use these code:
import graphscope
from graphscope.dataset import load_ogbn_mag

g = load_ogbn_mag()
We provide a set of functions to load graph datasets from ogb and snap for convenience. Please find all the available graphs here. If you want to use your own graph data, please refer this doc to load vertices and edges by labels.
Interactive query
Interactive queries allow users to directly explore, examine, and present graph data in an exploratory manner in order to locate specific or in-depth information in time. GraphScope adopts a high-level language called Gremlin for graph traversal, and provides efficient execution at scale.
In this example, we use graph traversal to count the number of papers two given authors have co-authored. To simplify the query, we assume the authors can be uniquely identified by ID 2 and 4307, respectively.
# get the endpoint for submitting Gremlin queries on graph g.
interactive = graphscope.gremlin(g)

# count the number of papers two authors (with id 2 and 4307) have co-authored
papers = interactive.execute("g.V().has('author', 'id', 2).out('writes').where(__.in('writes').has('id', 4307)).count()").one()
Graph analytics
Graph analytics is widely used in real world. Many algorithms, like community detection, paths and connectivity, centrality are proven to be very useful in various businesses. GraphScope ships with a set of built-in algorithms, enables users easily analysis their graph data.
Continuing our example, below we first derive a subgraph by extracting publications in specific time out of the entire graph (using Gremlin!), and then run k-core decomposition and triangle counting to generate the structural features of each paper node.
Please note that many algorithms may only work on homogeneous graphs, and therefore, to evaluate these algorithms over a property graph, we need to project it into a simple graph at first.
# extract a subgraph of publication within a time range
sub_graph = interactive.subgraph("g.V().has('year', inside(2014, 2020)).outE('cites')")

# project the projected graph to simple graph.
simple_g = sub_graph.project(vertices={"paper": []}, edges={"cites": []})

ret1 = graphscope.k_core(simple_g, k=5)
ret2 = graphscope.triangles(simple_g)

# add the results as new columns to the citation graph
sub_graph = sub_graph.add_column(ret1, {"kcore": "r"})
sub_graph = sub_graph.add_column(ret2, {"tc": "r"})
In addition, users can write their own algorithms in GraphScope. Currently, GraphScope supports users to write their own algorithms in Pregel model and PIE model.
Graph neural networks (GNNs)
Graph neural networks (GNNs) combines superiority of both graph analytics and machine learning. GNN algorithms can compress both structural and attribute information in a graph into low-dimensional embedding vectors on each node. These embeddings can be further fed into downstream machine learning tasks.
In our example, we train a GCN model to classify the nodes (papers) into 349 categories, each of which represents a venue (e.g. pre-print and conference). To achieve this, first we launch a learning engine and build a graph with features following the last step.
# define the features for learning
paper_features = []
for i in range(128):
    paper_features.append("feat_" + str(i))

paper_features.append("kcore")
paper_features.append("tc")

# launch a learning engine.
lg = graphscope.graphlearn(sub_graph, nodes=[("paper", paper_features)],
                  edges=[("paper", "cites", "paper")],
                  gen_labels=[
                      ("train", "paper", 100, (0, 75)),
                      ("val", "paper", 100, (75, 85)),
                      ("test", "paper", 100, (85, 100))
                  ])
Then we define the training process, and run it.
# Note: Here we use tensorflow as NN backend to train GNN model. so please
# install tensorflow.
import graphscope.learning
from graphscope.learning.examples import GCN
from graphscope.learning.graphlearn.python.model.tf.trainer import LocalTFTrainer
from graphscope.learning.graphlearn.python.model.tf.optimizer import get_tf_optimizer

# supervised GCN.

def train(config, graph):
    def model_fn():
        return GCN(
            graph,
            config["class_num"],
            config["features_num"],
            config["batch_size"],
            val_batch_size=config["val_batch_size"],
            test_batch_size=config["test_batch_size"],
            categorical_attrs_desc=config["categorical_attrs_desc"],
            hidden_dim=config["hidden_dim"],
            in_drop_rate=config["in_drop_rate"],
            neighs_num=config["neighs_num"],
            hops_num=config["hops_num"],
            node_type=config["node_type"],
            edge_type=config["edge_type"],
            full_graph_mode=config["full_graph_mode"],
        )
    graphscope.learning.reset_default_tf_graph()
    trainer = LocalTFTrainer(
        model_fn,
        epoch=config["epoch"],
        optimizer=get_tf_optimizer(
            config["learning_algo"], config["learning_rate"], config["weight_decay"]
        ),
    )
    trainer.train_and_evaluate()


config = {
    "class_num": 349,  # output dimension
    "features_num": 130,  # 128 dimension + kcore + triangle count
    "batch_size": 500,
    "val_batch_size": 100,
    "test_batch_size": 100,
    "categorical_attrs_desc": "",
    "hidden_dim": 256,
    "in_drop_rate": 0.5,
    "hops_num": 2,
    "neighs_num": [5, 10],
    "full_graph_mode": False,
    "agg_type": "gcn",  # mean, sum
    "learning_algo": "adam",
    "learning_rate": 0.0005,
    "weight_decay": 0.000005,
    "epoch": 20,
    "node_type": "paper",
    "edge_type": "cites",
}

train(config, lg)
A python script with the entire process is availabe here, you may try it out by yourself.
Processing Large Graph on Kubernetes Cluster
GraphScope is designed for processing large graphs, which are usually hard to fit in the memory of a single machine. With Vineyard as the distributed in-memory data manager, GraphScope supports run on a cluster managed by Kubernetes(k8s).
To continue this tutorial, please ensure that you have a k8s managed cluster and know the credentials for the cluster.
(e.g., address of k8s API server, usually stored a ~/.kube/config file.)
Alternatively, you can set up a local k8s cluster for testing with Kind. We provide a script for setup this environment.
# for usage, type -h
./scripts/install_deps.sh --k8s
If you did not install the graphscope package in the above step, you can install a subset of the whole package with client functions only.
pip3 install graphscope-client
Next, let's revisit the example by running on a cluster instead.
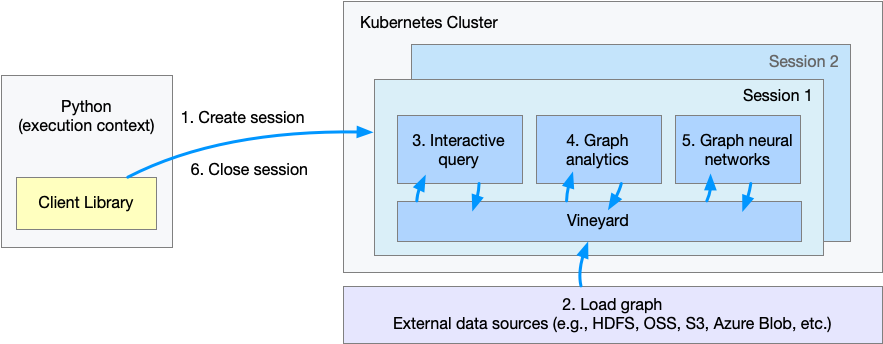
The figure shows the flow of execution in the cluster mode. When users run code in the python client, it will:
- Step 1. Create a session or workspace in GraphScope.
- Step 2 - Step 5. Load a graph, query, analysis and run learning task on this graph via Python interface. These steps are the same to local mode, thus users process huge graphs in a distributed setting just like analysis a small graph on a single machine.(Note that
graphscope.gremlinandgraphscope.graphlearnneed to be changed tosess.gremlinandsess.graphlearn, respectively.sessis the name of theSessioninstance user created.) - Step 6. Close the session.
Creating a session
To use GraphScope in a distributed setting, we need to establish a session in a python interpreter.
For convenience, we provide several demo datasets, and an option mount_dataset to mount the dataset in the graphscope cluster. The datasets will be mounted to location you assigned in the pods. If you want to use your own data on k8s cluster, please refer to this.
import graphscope

sess = graphscope.session(mount_dataset="/dataset")
For macOS, the session needs to establish with the LoadBalancer service type (which is NodePort by default).
import graphscope

sess = graphscope.session(mount_dataset="/dataset", k8s_service_type="LoadBalancer")
A session tries to launch a coordinator, which is the entry for the back-end engines. The coordinator manages a cluster of resources (k8s pods), and the interactive/analytical/learning engines ran on them. For each pod in the cluster, there is a vineyard instance at service for distributed data in memory.
Loading a graph and processing computation tasks
Similar to the standalone mode, we can still use the functions to load a graph easily.
from graphscope.dataset import load_ogbn_mag

# Note we have mounted the demo datasets to /dataset,
# There are several datasets including ogbn_mag_small,
# User can attach to the engine container and explore the directory.
g = load_ogbn_mag(sess, "/dataset/ogbn_mag_small/")
Here, the g is loaded in parallel via vineyard and stored in vineyard instances in the cluster managed by the session.
Next, we can conduct graph queries with Gremlin, invoke various graph algorithms, or run graph-based neural network tasks like we did in the standalone mode.
We do not repeat code here, but a .ipynb processing the classification task on k8s is available on the Playground.
Closing the session
Another additional step in the distribution is session close. We close the session after processing all graph tasks.
sess.close()
This operation will notify the backend engines and vineyard to safely unload graphs and their applications, Then, the coordinator will dealloc all the applied resources in the k8s cluster.
Please note that we have not hardened this release for production use and it lacks important security features such as authentication and encryption, and therefore it is NOT recommended for production use (yet)!
Development
Building on local
To build graphscope Python package and the engine bineries, you need to install some dependencies and build tools.
./scripts/install_deps.sh --dev

# With argument --cn to speed up the download if you are in China.
./scripts/install_deps.sh --dev --cn
Then you can build GraphScope with pre-configured make commands.
# to make graphscope whole package, including python package + engine binaries.
make graphscope

# or make the engine components
# make gie
# make gae
# make gle
Building Docker images
GraphScope ships with a Dockerfile that can build docker images for releasing. The images are built on a builder image with all dependencies installed and copied to
a runtime-base image. To build images with latest version of GraphScope, go to the root directory and run this command.
# by default, the built image is tagged as graphscope/graphscope:SHORTSHA
make graphscope-image
Building client library
GraphScope python interface is separate with the engines image. If you are developing python client and not modifying the protobuf files, the engines image doesn't require to be rebuilt.
You may want to re-install the python client on local.
make client
Note that the learning engine client has C/C++ extensions modules and setting up the build environment is a bit tedious. By default the locally-built client library doesn't include the support for learning engine. If you want to build client library with learning engine enabled, please refer Build Python Wheels.
Testing
To verify the correctness of your developed features, your code changes should pass our tests.
You may run the whole test suite with commands:
make test
Documentation
Documentation can be generated using Sphinx. Users can build the documentation using:
# build the docs
make graphscope-docs

# to open preview on local
open docs/_build/latest/html/index.html
The latest version of online documentation can be found at https://graphscope.io/docs
License
GraphScope is released under Apache License 2.0. Please note that third-party libraries may not have the same license as GraphScope.
Publications
- Wenfei Fan, Tao He, Longbin Lai, Xue Li, Yong Li, Zhao Li, Zhengping Qian, Chao Tian, Lei Wang, Jingbo Xu, Youyang Yao, Qiang Yin, Wenyuan Yu, Jingren Zhou, Diwen Zhu, Rong Zhu. GraphScope: A Unified Engine For Big Graph Processing. The 47th International Conference on Very Large Data Bases (VLDB), industry, 2021.
- Jingbo Xu, Zhanning Bai, Wenfei Fan, Longbin Lai, Xue Li, Zhao Li, Zhengping Qian, Lei Wang, Yanyan Wang, Wenyuan Yu, Jingren Zhou. GraphScope: A One-Stop Large Graph Processing System. The 47th International Conference on Very Large Data Bases (VLDB), demo, 2021
Contributing
Any contributions you make are greatly appreciated!
- Join in the Slack channel for discussion.
- Please report bugs by submitting a GitHub issue.
- Please submit contributions using pull requests.
Release history Release notifications | RSS feed


Download files
Download the file for your platform. If you're not sure which to choose, learn more about installing packages.
Source Distributions
Built Distributions
Filter files by name, interpreter, ABI, and platform.
If you're not sure about the file name format, learn more about wheel file names.
Copy a direct link to the current filters
File details
Details for the file gs_lib-0.13.0-py2.py3-none-manylinux_2_17_x86_64.manylinux2014_x86_64.whl.
File metadata
- Download URL: gs_lib-0.13.0-py2.py3-none-manylinux_2_17_x86_64.manylinux2014_x86_64.whl
- Upload date:
- Size: 101.9 MB
- Tags: Python 2, Python 3, manylinux: glibc 2.17+ x86-64
- Uploaded using Trusted Publishing? No
- Uploaded via: twine/4.0.0 CPython/3.9.12
File hashes
| Algorithm | Hash digest | |
|---|---|---|
| SHA256 |
c0e721bbcde1cdd22d40630102d5eb1a444cd494719468ee7cd84a246b4c6b03
|
|
| MD5 |
912c8a754052de8b2a54838ffa58ea6c
|
|
| BLAKE2b-256 |
12c91a3abcbc5d87b3346c252de50c9242ad4ec6eb31c8df55534a29bde6cf16
|
File details
Details for the file gs_lib-0.13.0-py2.py3-none-macosx_10_9_x86_64.whl.
File metadata
- Download URL: gs_lib-0.13.0-py2.py3-none-macosx_10_9_x86_64.whl
- Upload date:
- Size: 73.6 MB
- Tags: Python 2, Python 3, macOS 10.9+ x86-64
- Uploaded using Trusted Publishing? No
- Uploaded via: twine/4.0.0 CPython/3.9.12
File hashes
| Algorithm | Hash digest | |
|---|---|---|
| SHA256 |
df535175001cb6b3ccaa820fc53884dace64007269e300fb3f4c360fd1c769f7
|
|
| MD5 |
f471857bf374bd78fe328d0855f9b177
|
|
| BLAKE2b-256 |
91a790bde185468e1525302d380f248dd1219f166adaffcaba7b7694997f1f59
|


