Geostatistics tools for interpolation and simulation.


Project description


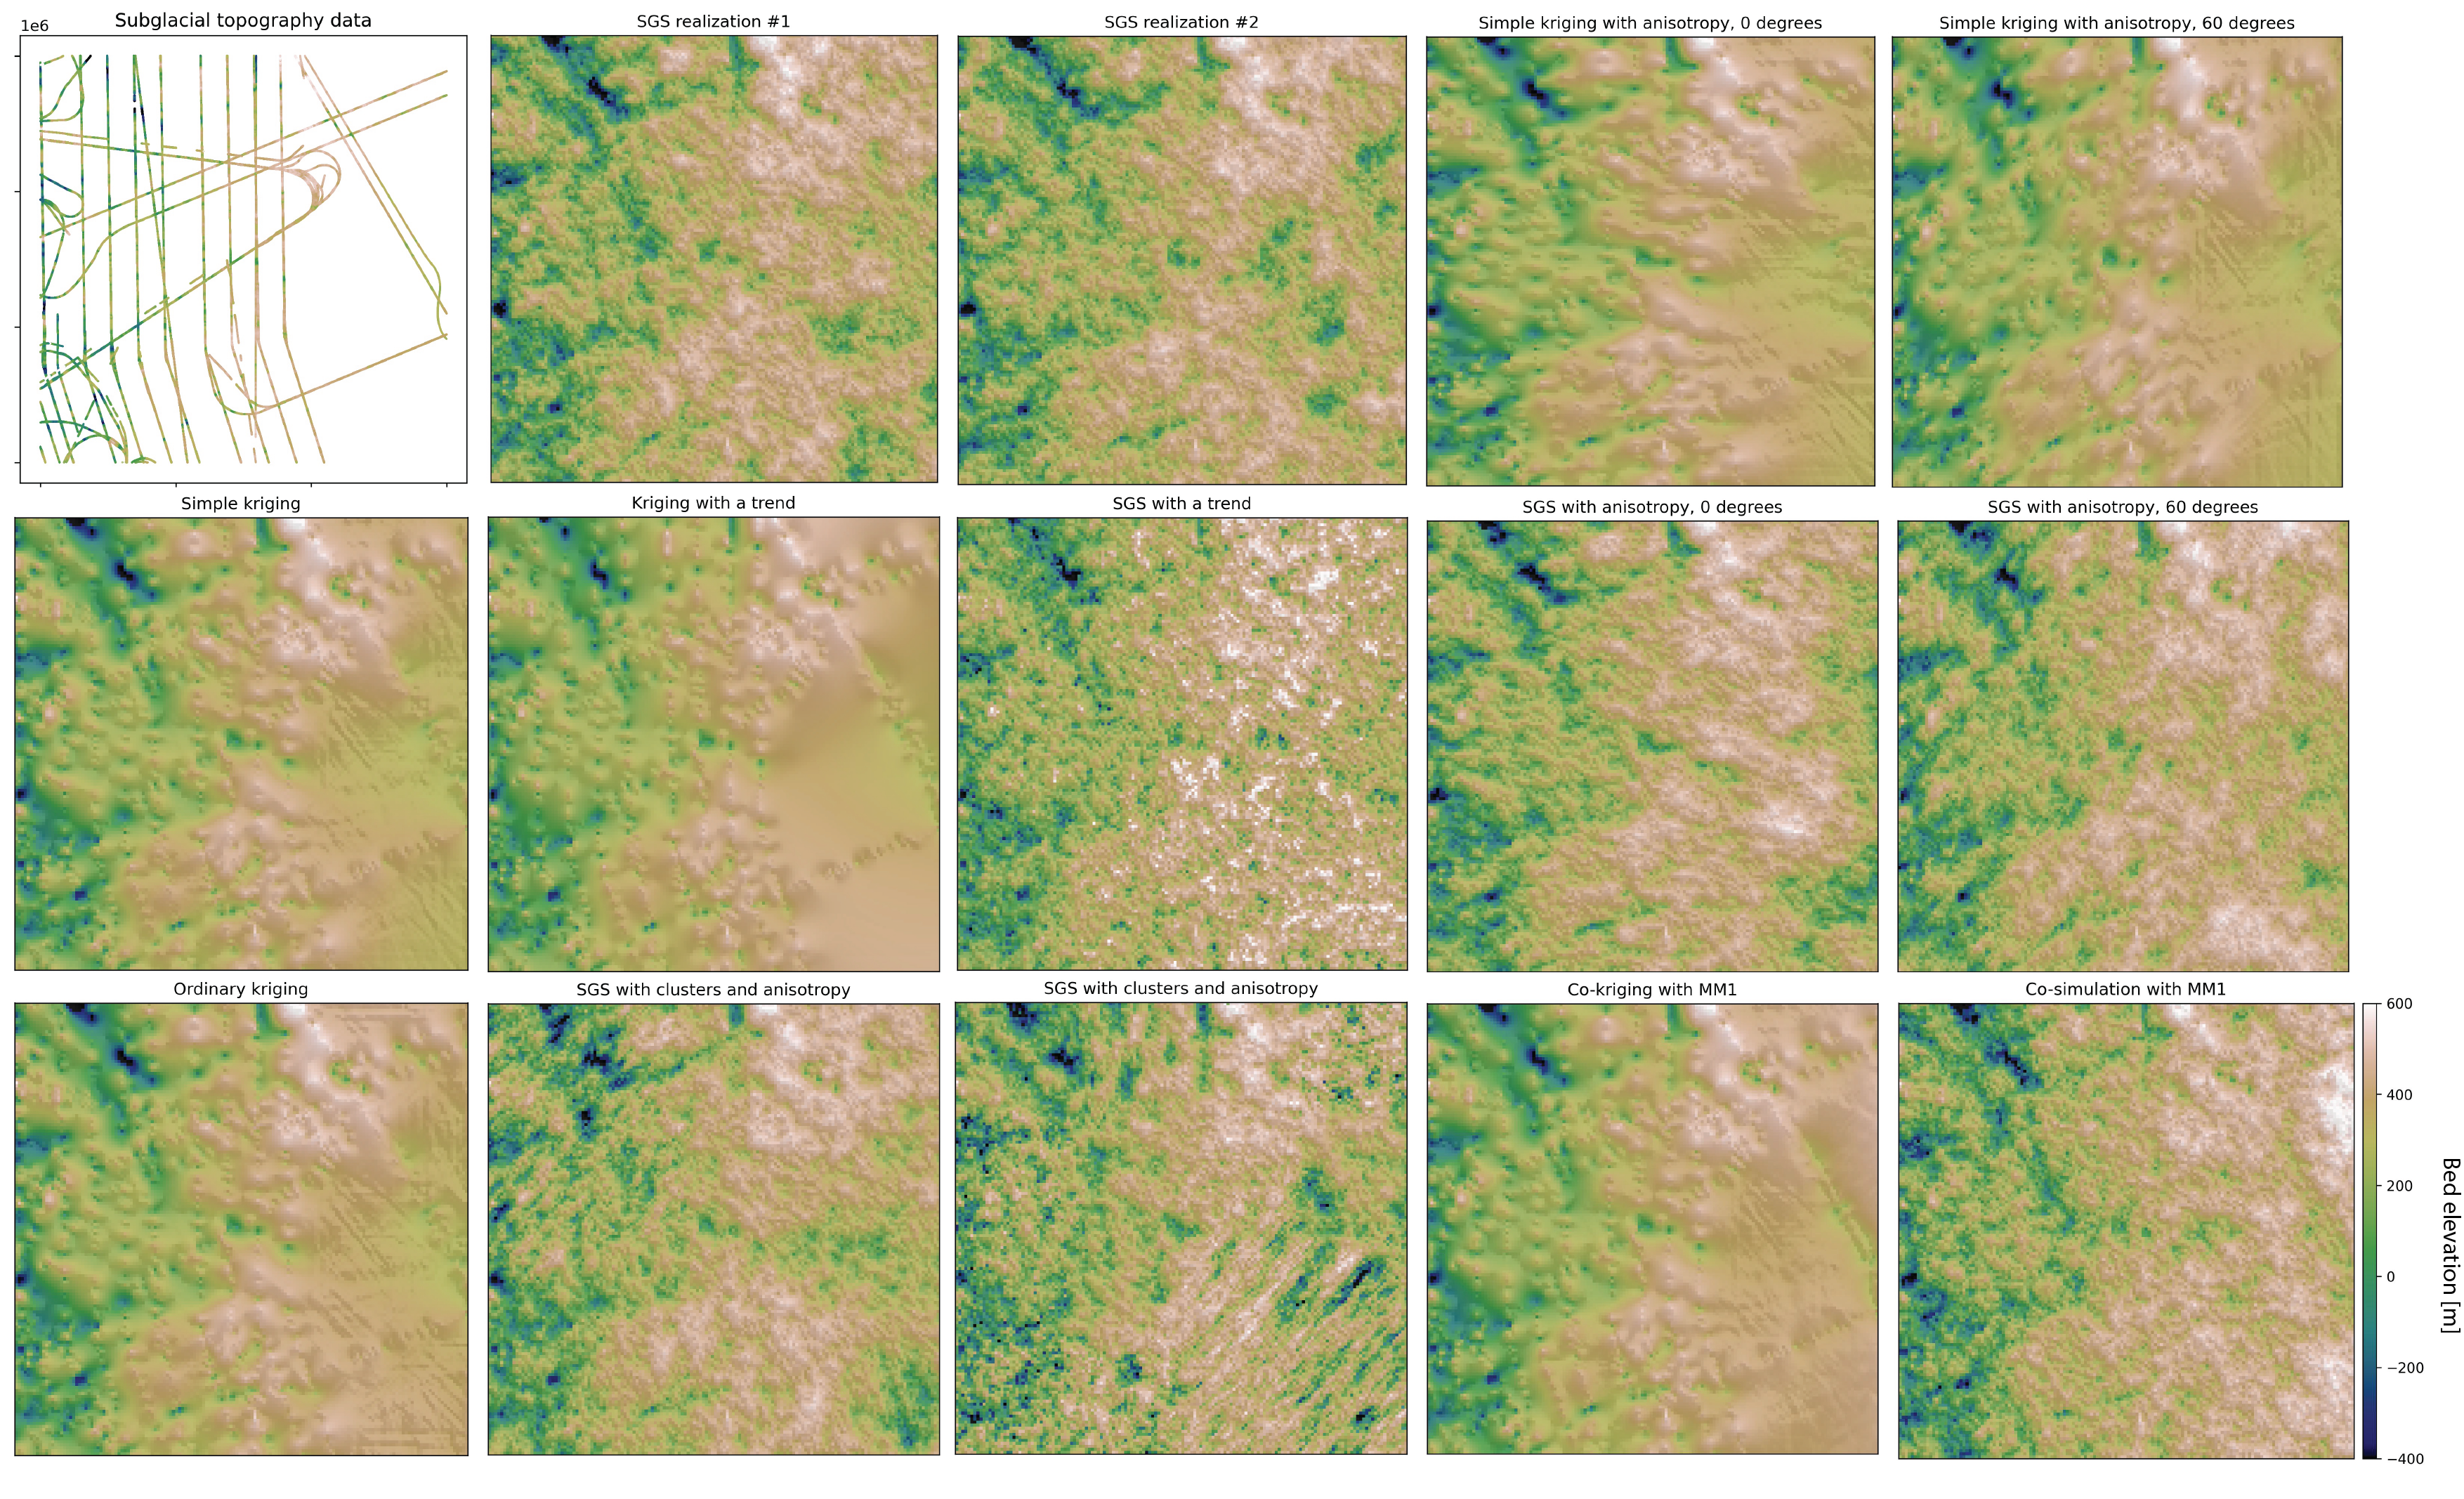
GStatSim
GStatSim is a Python package specifically designed for geostatistical interpolation and simulation. It is inspired by open source geostatistical resources such as GeostatsPy and SciKit-GStat. The functions are intended to address the challenges of working with large data sets, non-linear trends, variability in measurement density, and non-stationarity. These tools are part of our ongoing effort to develop and adapt open-access geostatistical functions.
We have created Jupyter Book tutorials here: https://gatorglaciology.github.io/gstatsimbook/intro.html
See our paper here: https://doi.org/10.5194/gmd-16-3765-2023
In its current state, the demos focus on the geostatistical simulation of subglacial topography. However, these protocols could be applied to a number geoscientific topics.
We will continuously develop new tools and tutorials to address specific technical challenges in geostatistics. Do you have feedback or suggestions? Specific things that we should account for? Feel free to contact me at emackie@ufl.edu. Our goal is to create tools that are useful and accessible, so we welcome your thoughts and insight.
Features
Functions
Some of the tools in GStatSim:
- skrige - Simple kriging
- okrige - Ordinary kriging
- skrige_sgs - Sequential Gaussian simulation using simple kriging
- okrige_sgs - Sequential Gaussian simulation using ordinary kriging
- cluster_sgs - Sequential Gaussian simulation where different variograms are used in different areas
- cokrige_mm1 - Cokriging (kriging with a secondary constraint) under Markov assumptions
- cosim_mm1 - Cosimulation under Markov assumptions
Demos
We have created tutorials that are designed to provide an intuitive understanding of geostatistical methods and to demonstrate how these methods are used. The current demos are:
- 1_Experimental_Variogram.ipynb - Demonstration of experimental variogram calculation to quantify spatial relationships.
- 2_Variogram_model.ipynb - A tutorial on fitting a variogram model to an experimental variogram.
- 3_Simple_kriging_and_ordinary_kriging.ipynb - Demonstration of simple kriging and ordinary kriging interpolation.
- 4_Sequential_Gaussian_Simulation.ipynb - An introduction to stochastic simulation.
- 5_Variogram_interpolation_comparison.ipynb - A demonstration of kriging and SGS with different variogram models.
- 6_interpolation_with_anisotropy.ipynb - A demonstration of kriging and SGS with anisotropy.
- 7_non-stationary_SGS_example1.ipynb - A tutorial on SGS with multiple variograms. This demo uses k-means clustering to divide the conditioning data into groups that are each assigned their own variogram.
- 8_non-stationary_SGS_example2.ipynb - SGS using multiple variograms where the clusters are determined automatically.
- 9_interpolation_with_a_trend.ipynb - Kriging and SGS in the presence of a large-scale trend.
- 10_cokriging_and_cosimulation_MM1.ipynb - Kriging and SGS using secondary constraints.
Contributors
(Emma) Mickey MacKie, University of Florida
Michael Field, University of Florida
Lijing Wang, Lawrence Berkeley National Laboratory
(Zhen) David Yin, Stanford University
Nathan Schoedl, University of Florida
Matthew Hibbs, University of Florida
Mirko Malicke, Karlsruhe Institute of Technology
Usage
Install GStatSim with pip install gstatsim
or
git clone https://github.com/GatorGlaciology/GStatSim
Package dependencies
- Numpy
- Pandas
- Scipy
- tqdm
- Sklearn
Requirements for visualization and variogram analysis
- Matplotlib
- SciKit-GStat
These can all be installed using the command pip install (package name).
Educational use
GStatSim is well-suited for educational use. Please contact us if you plan on using GStatSim material in a course so we can track the impact of our work.
Cite as
MacKie, E. J., Field, M., Wang, L., Yin, Z., Schoedl, N., Hibbs, M., & Zhang, A. (2023). GStatSim V1. 0: a Python package for geostatistical interpolation and conditional simulation. Geoscientific Model Development, 16(13), 3765-3783.
or
@article{mackie2023gstatsim, title={GStatSim V1. 0: a Python package for geostatistical interpolation and conditional simulation}, author={MacKie, Emma J and Field, Michael and Wang, Lijing and Yin, Zhen and Schoedl, Nathan and Hibbs, Matthew and Zhang, Allan}, journal={Geoscientific Model Development}, volume={16}, number={13}, pages={3765--3783}, year={2023}, publisher={Copernicus Publications G{"o}ttingen, Germany} }
Datasets
The demos use radar bed measurements from the Center for the Remote Sensing of Ice Sheets (CReSIS, 2020).
CReSIS. 2020. Radar depth sounder, Lawrence, Kansas, USA. Digital Media. http://data.cresis.ku.edu/.
Release history Release notifications | RSS feed


Download files
Download the file for your platform. If you're not sure which to choose, learn more about installing packages.
Source Distribution
Built Distribution
Filter files by name, interpreter, ABI, and platform.
If you're not sure about the file name format, learn more about wheel file names.
Copy a direct link to the current filters
File details
Details for the file gstatsim-1.2.0.tar.gz.
File metadata
- Download URL: gstatsim-1.2.0.tar.gz
- Upload date:
- Size: 15.4 kB
- Tags: Source
- Uploaded using Trusted Publishing? No
- Uploaded via: twine/6.1.0 CPython/3.10.14
File hashes
| Algorithm | Hash digest | |
|---|---|---|
| SHA256 |
3763fd8ad94961d4dd00b3f9652214917a51f41d6e3dccdf4dfab40be877ca55
|
|
| MD5 |
fb69db37ebd74ed0b40ea649b831e927
|
|
| BLAKE2b-256 |
f8d8ddb66f6ef360cb9f5def0ccbe42a3d55b0f5679f034fa677eda38989c30f
|
File details
Details for the file gstatsim-1.2.0-py3-none-any.whl.
File metadata
- Download URL: gstatsim-1.2.0-py3-none-any.whl
- Upload date:
- Size: 13.3 kB
- Tags: Python 3
- Uploaded using Trusted Publishing? No
- Uploaded via: twine/6.1.0 CPython/3.10.14
File hashes
| Algorithm | Hash digest | |
|---|---|---|
| SHA256 |
c7a37789656840d6793126b2e777bde92180166dc0bbb1bf705217b93d9db35a
|
|
| MD5 |
b35b4190862257d2bd9bb094441e5dd9
|
|
| BLAKE2b-256 |
2a4753a31047484ec6a697549e2e5945ea9ebe1b52e2dbf3b1749eabf721acde
|


