Guidepost. An overview visualization for understanding supercomputer queue data.

Project description
Guidepost
Guidepost is a Python library designed for seamless integration into Jupyter notebooks to visualize High Performance Computing (HPC) job data. It simplifies the process of understanding HPC workloads by providing a single, interactive visualization that offers an intuitive overview of job performance, resource usage, and other critical metrics.
Features
- Jupyter Notebook Integration: Designed for your existing workflow. Load and interact with the visualization directly in your Jupyter environment.
- HPC Job Data Insights: Visualize key metrics, including job runtimes, resource usage, and queue performance.
- Interactive Exploration: Export selections of specific jobs or groups of jobs for deeper analysis.
- Lightweight and Easy to Use: Focused on simplicity and efficiency for HPC users.
Installation
Guidepost is available on PyPI. You can install it using pip:
pip install guidepost
Quick Start
1. Import and Initialize Guidepost
from guidepost import Guidepost
gp = Guidepost()
2. Load Your Data
import pandas as pd
jobs_data = pd.read_parquet("data/jobs_data.parquet")
gp.load_data(jobs_data)
Guidepost supports input data in a Pandas DataFrame format.
At least three numerical and 2 categorical columns are required. Datetime columns are also supported for encoding on the x axis.
Here is a sample table containg jobs-related data from a supercomputer scheduling system:
| job_id | start_time | queue_wait | nodes_requested | partition | status | user |
|---|---|---|---|---|---|---|
| 12345 | 2023-11-01 21:19:33 | 5.2 | 10 | short | Complete | User1 |
| 12346 | 2023-11-01 21:20:01 | 12.0 | 20 | long | Running | User2 |
In this example, the three data values we will use for our x, y and color variables are: start_time, queue_wait and nodes_requested. We would also like to use parition to facet my data and user as an additional categorical variable to filter on. In the next section, we show how to specify which columns in your dataset correspond to parts of the visualizaiton.
The load_data() function will format your data for json serialization and will update the visualization if it has already been run. This function will report out any columns or rows which are dropped from the original dataset due to conainting null/NaN/None values or unallowed datatypes like timedeltas.
3. Configure Visualization
gp.vis_configs = {
        'x': 'start_time',
        'y': 'queue_wait',
        'color': 'nodes_requested',
        'color_agg': 'avg',
        'categorical': 'user',
        'facet_by': 'partition'
}
Configuration Descriptions:
x: Name of the column in the dataframe which will be shown on the x axis of Guidepost's subcharts.y: Name of the column in the dataframe which will be shown on the y axis of Guidepost's subcharts.color: Name of the column in the dataframe which will be shown by the darkness of each square's color.color_agg: The aggregation method used to determine the color. Can be: 'avg', 'variance', 'std', 'sum', or 'median'categorical: Name of the column containing categorical data values which will be shown on a bar chart associated with each group of the data.facet_by: Name of the column containing categorical data values which dictate the highest level grouping of the data. Dictates how many sub charts are produced in the visualization.
See the Vis Configs Section for more details on datatype restrictions for each configuration.
4. Run Visualization
gp
Run the above command in a Jupyter notebook cell to start the visualization.
Here is an example of what the viusalization will look like:
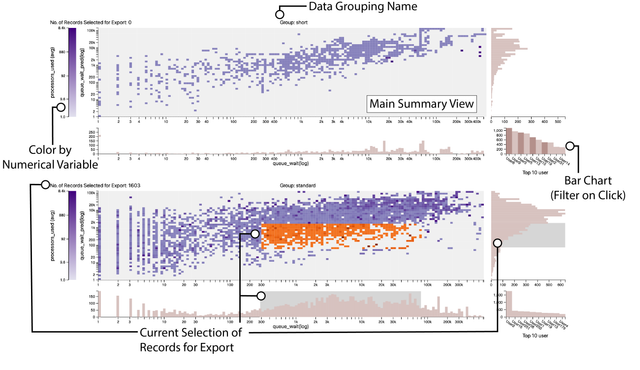
Here we explain some elements of the visualization:
Data Grouping Name:
This is name of the high level groups which are dictated by the facet_by configuration. If your data only logically contains one group, adding a synthetic column is advised and specifying that column name for the facet_by cofiguration.
Main Summary View:
The main summary view is the primary view associated with each group of data specified by facet_by configuration. This view shows the data organized by the x and y axes. Data values at similar locations along the x and y axes are grouped into squares at that location. The amount of data in each row and column are shown with the histograms framing this view. The color of each square shows an aggregrate of a third numerical variable that exists on each data value.
Color by Numerical Variable:
Each square in the main summary view is an aggregrate of datapoints at that x and y location. The color of a given square is dictated by the variable shown here. For example, in the bottom subchart, we see that there is a correlation between higher queue_waits, queue_wait_predictions and processor counts. The darker squares indicate higher processor counts on average.
Bar Chart (Filter on Click):
The bar chart in the lower right hand corner of each row of subcharts shows the top ten instances of the column passed to the categorical configuration. It will filter the dataset when a bar is hovered over. Clicking a bar will fix that filter in place. Clicking again will remove the filter when the mouse leaves the bar.
Current Seleciton of Records for Export:
Records can be selected for export from the visualization by brushing over the right and bottom histograms. The area of selected data is indicated by the orange coloring on the main summary view. The amont of records selected is indicated at the top left for each chart. Selections can be made across multiple charts. The final selection is returned as one dataframe containg all selections.
5. Retrieve Selections from Visualization
df = gp.retrieve_selected_data()
After selecting data by brushing over either the bottom or right histograms associated with a subchart, you can retrieve selected data using the above method.
This will return a pandas dataframe containing all your subselected rows from the original dataset.
Example Dataset
Below is an example of the kind of data Guidepost works with:
| job_id | start_time | queue_wait | nodes_requested | partition | status | user |
|---|---|---|---|---|---|---|
| 12345 | 2023-11-01 21:19:33 | 5.2 | 10 | short | Complete | User1 |
| 12346 | 2023-11-01 21:20:01 | 12.0 | 20 | long | Running | User2 |
API Reference
load_data
- Description: Loads a pandas dataframe into the guidepost system for visualizaiton. Will report data dropped from the dataframe if it contains NaNs,
timedeltas,arraysin cells, or other invalid values. - Arguments:
in_df(Pandas Dataframe): The dataframe containing data to be visualized.supress_warnings(Boolean): Specifies whether to suppress warnings when loading data. Defaults toFalse
vis_data
- Description: Holds the vis data to passed to the visualization. Updates to this variable will automatically update the visualization.
vis_configs
- Description: Holds the vis configurations to passed to the visualization. Updates to this variable will automatically update the visualization.
Vis configurations must be specified as a python dictonary with the following fields:
- 'x': The column from the pandas dataframe which will be shown on the x axis. This can be a integer, float or datetime variable.
- 'y': The column from the pandas dataframe which will be shown on the y axis of this visualization. This can be an integer or float.
- 'color': The column from the pandas dataframe which will determine the color of squares in the main summary view. This can be an integer or float.
- 'color_agg': This is a specification for what aggregation is used for the color variable. It can be: 'avg', 'variance', 'std', 'sum', or 'median'
- 'categorical': A categorical variable from the dataset. The data column must be a string datatype. The visualization will show the top 10 instances of this variable.
- 'facet_by': A categorical variable from the dataset. Automatically looks for 'queue' or 'partition' if this config is not specified.
retrieve_selected_data()
- Description: Returns selected data back from the visualization.
- Returns:
subselection(DataFrame or str): A Pandas DataFrame that contains subselected data specified from selections made to the visualization.
Contributing
Contributions to Guidepost are welcome! To contribute:
- Fork the repository.
- Create a new branch for your feature or bugfix.
- Submit a pull request with a detailed description of your changes.
License
Guidepost is licensed under the MIT License. See the LICENSE file for details.
Acknowledgments
Guidepost was developed under the auspices and with funding provided by the National Renewable Energy Laboratory (NREL).
Contact
For questions or feedback, please reach out to the maintainer at [cscullyallison@sci.utah.edu].
Release history Release notifications | RSS feed


Download files
Download the file for your platform. If you're not sure which to choose, learn more about installing packages.
Source Distribution
Built Distribution
Filter files by name, interpreter, ABI, and platform.
If you're not sure about the file name format, learn more about wheel file names.
Copy a direct link to the current filters
File details
Details for the file guidepost-0.2.10.tar.gz.
File metadata
- Download URL: guidepost-0.2.10.tar.gz
- Upload date:
- Size: 438.4 kB
- Tags: Source
- Uploaded using Trusted Publishing? No
- Uploaded via: twine/6.1.0 CPython/3.11.7
File hashes
| Algorithm | Hash digest | |
|---|---|---|
| SHA256 |
732798f708a8159a209f6c1d883d849bbebbd8e8387b6439aadeea9addf9de4d
|
|
| MD5 |
309a520e5eb9a4f1191d748f65306109
|
|
| BLAKE2b-256 |
3eb829d28175a580a93aa352d99c841b193b4f9ca7eafb53023d7e233718ac88
|
File details
Details for the file guidepost-0.2.10-py3-none-any.whl.
File metadata
- Download URL: guidepost-0.2.10-py3-none-any.whl
- Upload date:
- Size: 433.6 kB
- Tags: Python 3
- Uploaded using Trusted Publishing? No
- Uploaded via: twine/6.1.0 CPython/3.11.7
File hashes
| Algorithm | Hash digest | |
|---|---|---|
| SHA256 |
165972251662eaf7c688cc2453efbdf662cae445951f728fa68f775d7beb793b
|
|
| MD5 |
1b75b5660263126f01909ae4cc01ea09
|
|
| BLAKE2b-256 |
6c75dd40b30ea730d6028b1bc9a4491892d3fd5e8aa3cb447037fb23f639ebcb
|


