
HAlphaAnomalyzer
(Part of the MLEcoFi Project)
HAlphaAnomalyzer is a software for detecting anomalies in H-Alpha full-disk solar observations. Leveraging a grid-based approach and advanced statistical analysis, it computes optimal pixel average range values for each grid cell to identify anomalies effectively.



Try the demo online

Table of Contents
- Installation
- Importing Required Library
- Initializing Anomalyzer
- Computing Best Ranges
- Finding Corrupt Images
- Plotting Image Likelihoods with Corrupt Cells
- Example Outputs
User Manual
Installation
To install the required library, run:
pip install HAlphaAnomalyzer
Importing Required Class
Import the Anomalyzer class from the library's anomalyzer module into your Python script with:
from HAlphaAnomalyzer.anomalyzer import Anomalyzer
Initializing Anomalyzer Object
Create an instance of Anomalyzer with a specified grid size:
anomalyzer = Anomalyzer(grid_size=8)
Computing Best Ranges
Calculate optimal range values for each grid cell using your image paths.
anomalyzer.compute_best_ranges(
    non_anomalous_paths=['path/to/non-anomalous/image1.png', 'path/to/non-anomalous/image2.png'],
    anomalous_paths=['path/to/anomalous/image1.png', 'path/to/anomalous/image2.png']
)
Parameters:
non_anomalous_paths: List of paths to non-anomalous image files.anomalous_paths: List of paths to anomalous image files.lower_range_end: End of candidate lower ranges, default is 20.upper_range_start: Start of candidate upper ranges, default is 80.step_size: Step size for candidate ranges, default is 2.
Finding Corrupt Images
Detect corrupt images based on computed best ranges, with options to set likelihood thresholds and minimum corrupt cells:
corrupt_images_labels = anomalyzer.find_corrupt_images(
    image_paths=['path/to/image1.png', 'path/to/image2.png'],
    likelihood_threshold=0.6,
    min_corrupt_cells=1,
    verbose=True
)
Parameters:
image_paths: List of paths to image files.likelihood_threshold: Threshold for considering a cell as corrupt, default is 0.5.min_corrupt_cells: Minimum number of corrupt cells required to classify an image as corrupt, default is 0.verbose: If True, prints the number of detected corrupt images, default is False.
Plotting Image Likelihoods with Corrupt Cells
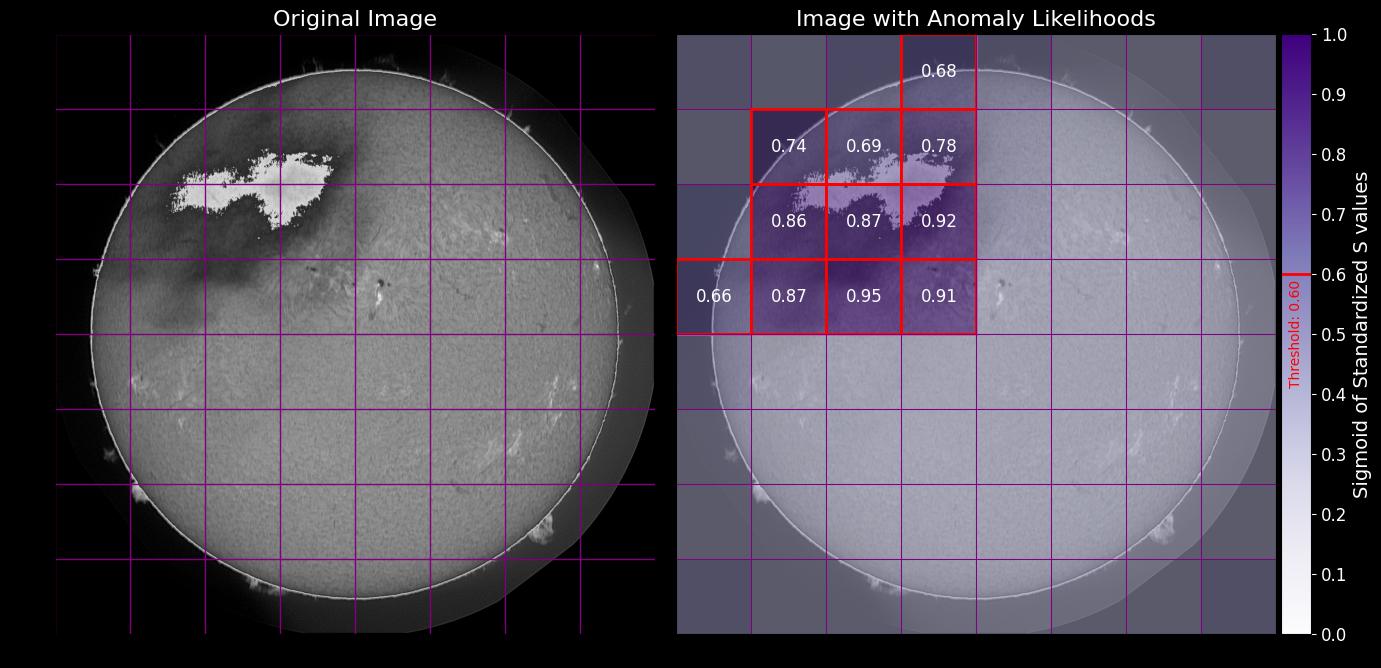
Visualize the anomaly likelihoods with an option to highlight corrupt cells:
anomalyzer.plot_image_likelihoods(
    image_path='path/to/image.png',
    likelihood_threshold=0.6
)
Parameters:
image_path: Path to the image file.likelihood_threshold: Optional threshold for identifying corrupt cells. If provided, corrupt cells will be outlined.
Example Outputs


Release files for HAlphaAnomalyzer 1.1.0
For a detailed explanation of source distributions (sdists) and built distributions (wheels), please see the package formats documentation.
Source distribution (sdist)
| File | Size | Uploaded | |
|---|---|---|---|
| HAlphaAnomalyzer-1.1.0.tar.gz | 11.4 kB | Details |
Release files / HAlphaAnomalyzer-1.1.0.tar.gz
| Download URL | HAlphaAnomalyzer-1.1.0.tar.gz |
|---|---|
| Size | 11.4 kB |
| Tags | Source |
|
SHA-256 checksum How to use checksums |
e23ec1c5c444ca1da94a2993886f4234b4c2c26015e19a90df2bbf44dc858cbf
|
|
BLAKE2b-256 checksum How to use checksums |
f91b333a120a4aad73d01eae717ec862a67f7b5ff84f74f32fac4c9a145be1ae
|
| Upload date | |
|
Uploaded using Trusted Publishing? What is trusted publishing? |
No |
| Uploaded via |
twine/1.12.1 pkginfo/1.6.0 requests/2.24.0 setuptools/50.3.2 requests-toolbelt/0.9.1 tqdm/4.50.2 CPython/3.7.9
|














