

harness-arena
Benchmark agent harnesses against one model, on Terminal-Bench 2.
The premise, from Harrison Kinsley's The right harness is all you need: hold the model fixed, swap the harness, and the pass rate moves a lot. A model that looks mediocre under one harness can look near-frontier under another. This repo makes that measurement repeatable on your own hardware and puts every run on one page.
-
Model: whatever your endpoint serves. Anything OpenAI-compatible (llama-server, vLLM, Ollama, LM Studio, TGI, SGLang) or OpenRouter. Swap the weights and re-run; the rig fingerprints them so runs can't be mislabeled.
-
Harnesses: six out of the box: hermes-agent, minion, oh-my-pi, opencode, Claude Code, and Codex CLI. Adding another is one YAML block, plus a Python adapter only when the harness needs one.
The last two are the vendor CLIs, pointed at your model rather than at Anthropic or OpenAI, no account, no key, no proxy. That works because they are the only two here that do not speak OpenAI-on-
/v1, and llama.cpp happens to serve all three dialects: Claude Code uses the Anthropic Messages API on/v1/messages, Codex uses the Responses API on/responses. See Pointing the vendor CLIs at a local model. -
Benchmark: Terminal-Bench 2 via Harbor, the official harness, in Docker.
Orchestration runs on Linux, macOS and Windows; task containers are Linux.
What it looks like
The dashboard is the whole interface: results, launching and stopping runs, endpoint setup, the harness catalog and maintenance, across five tabs.
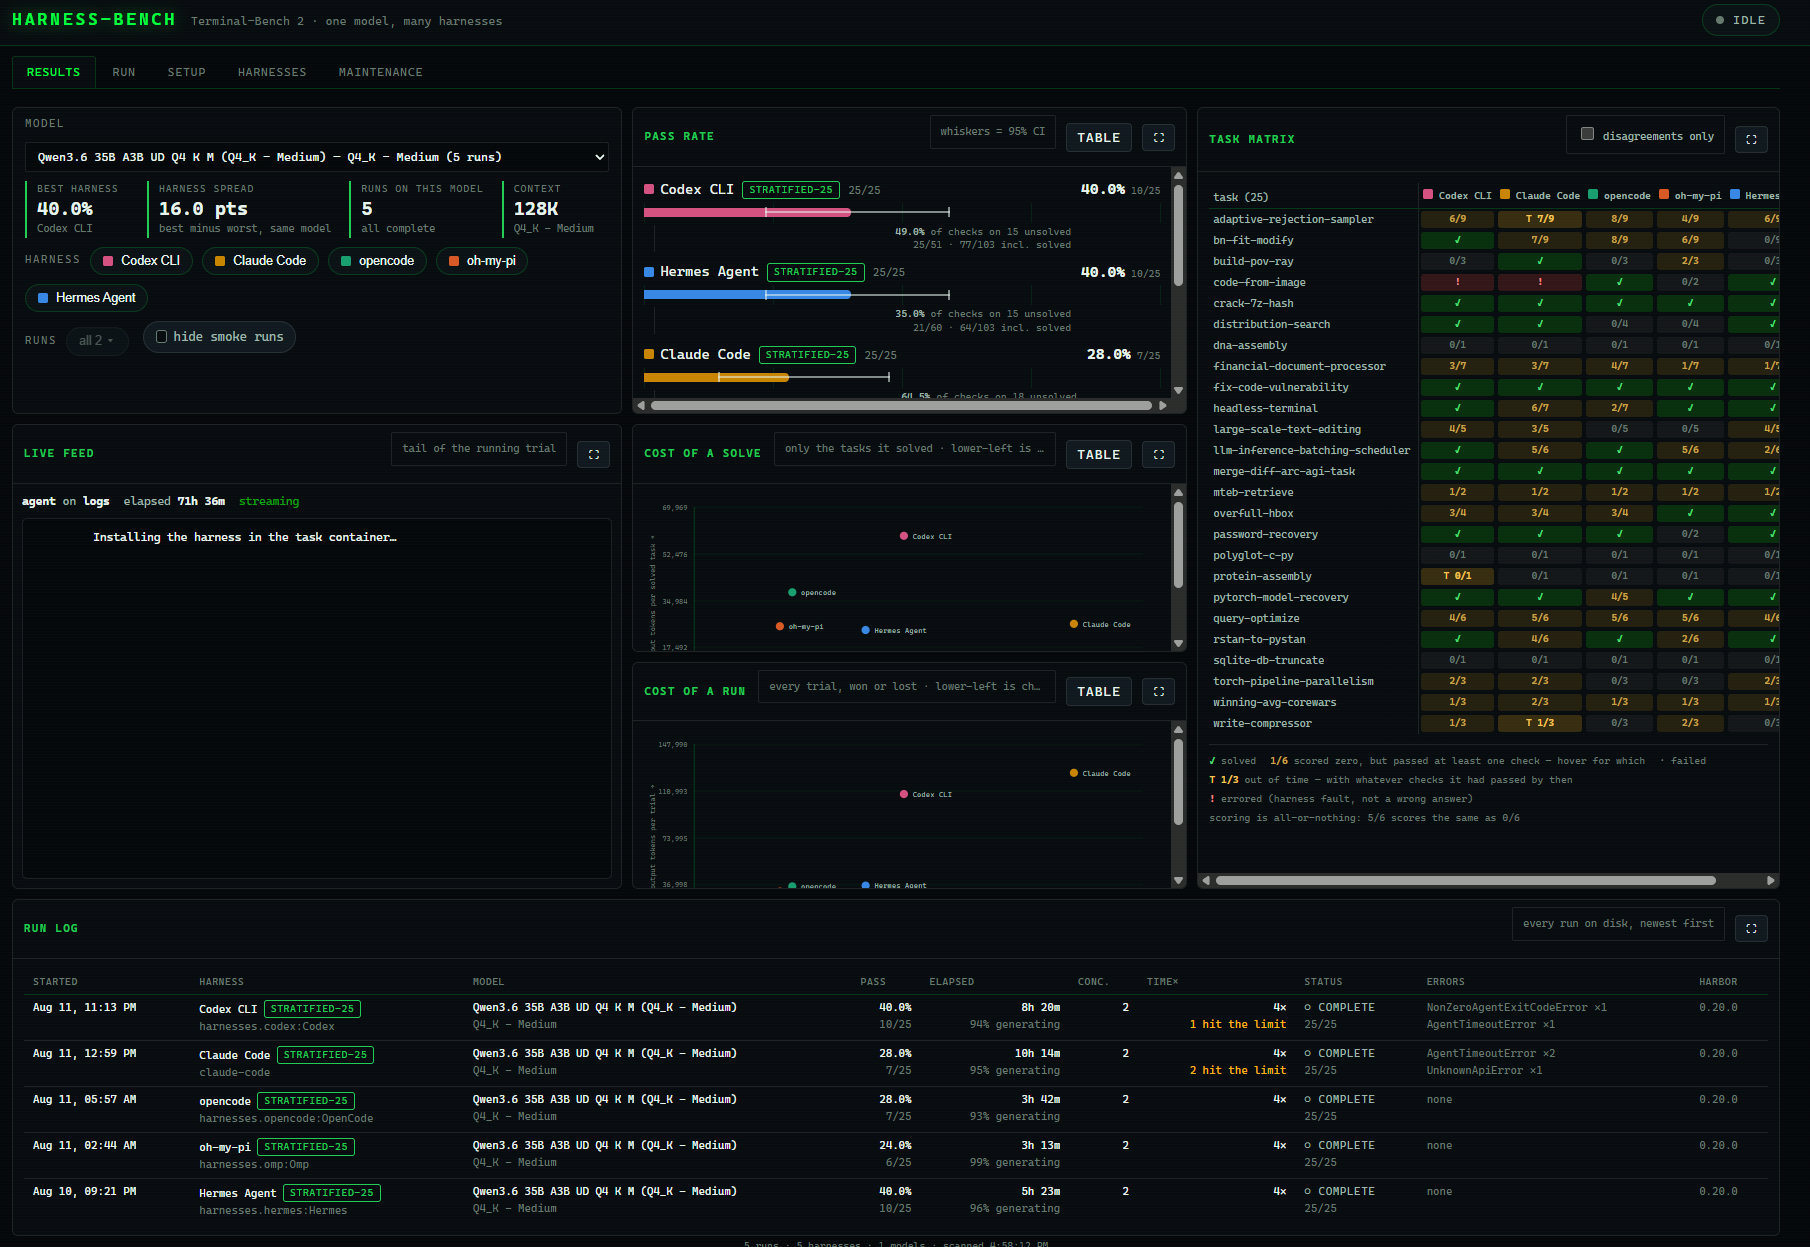
Results. Pass rates carry 95 % Wilson intervals, because at 89 tasks a
five-point gap is usually noise. If the whiskers overlap you have not shown a
difference, so the disagreement set is what actually carries the comparison:
tick disagreements only to filter the matrix to the tasks they differ on.
The task matrix distinguishes states that all score
zero but mean different things: ✓ solved, 5/6 checks passed, T 1/3 out of
time carrying whatever it had earned by then, ! errored. Hovering a cell
breaks down which checks failed. The live
feed tails the running agent, and says so when a long reasoning block produces
no output rather than looking hung.
Note the warning under the model selector: these two runs used different concurrency, so the dashboard says wall-clock is not comparable across them instead of quietly ranking them together.
Checks passed sits beside each pass rate, deliberately quieter and set apart. Scoring is all-or-nothing, so a run that passes five of six checks on twenty tasks scores zero twenty times, indistinguishable from one that wrote nothing. Counting the individual checks recovers that difference. On one smoke run here, two harnesses both scored 0%: one had passed 5 of 12 checks, the other 1 of 12.
It is measured over the tasks the run did not solve, and that detail is the whole value of it. A solved task passes every check by definition, so including those contributes a guaranteed 100% and the figure collapses into the pass rate wearing a different denominator. On four runs here the all-inclusive number read 62.1%, 60.2% and 56.3%, but 43 of the leader's 103 checks came from tasks it had already solved, and on the ones it missed it managed 35.0% against 44.6% for the run the all-inclusive figure ranked second. The ordering inverts. So the panel leads with partial credit on the misses and keeps the all-inclusive total beside it as context:
35.0% of checks on 15 unsolved
21/60 · 64/103 incl. solved
Neither is a score, and neither is comparable to the pass rate. Tasks carry different numbers of checks, so this weights a nine-check task nine times a one-check task, and the checks are not equally hard. It answers "how close did the misses come", not "how good is this harness", which is why it is never ranked on and never replaces the rate.
Choosing what to look at. The runs filter is a checkbox menu of every
run for the selected model, grouped by scope (stratified-25, smoke, full
dataset) and labelled with when each started, because selecting by name alone
stops working the moment you re-run a subset, which is the normal case here.
Pick one run, a whole group, or everything. Every panel follows it, including
the run log, so what you selected and what you are looking at cannot disagree.
Elapsed in the run log is wall clock: the run's own start to its last finished trial, or to now while it is going. Not the sum of trial durations, which double-counts whenever two trials overlap and would report a 2-concurrent run as taking twice as long as it did. Beneath it is the share of that time the model spent generating. The rest is image pulls, harness installs and verifiers, and it is what pipelining exists to hide.
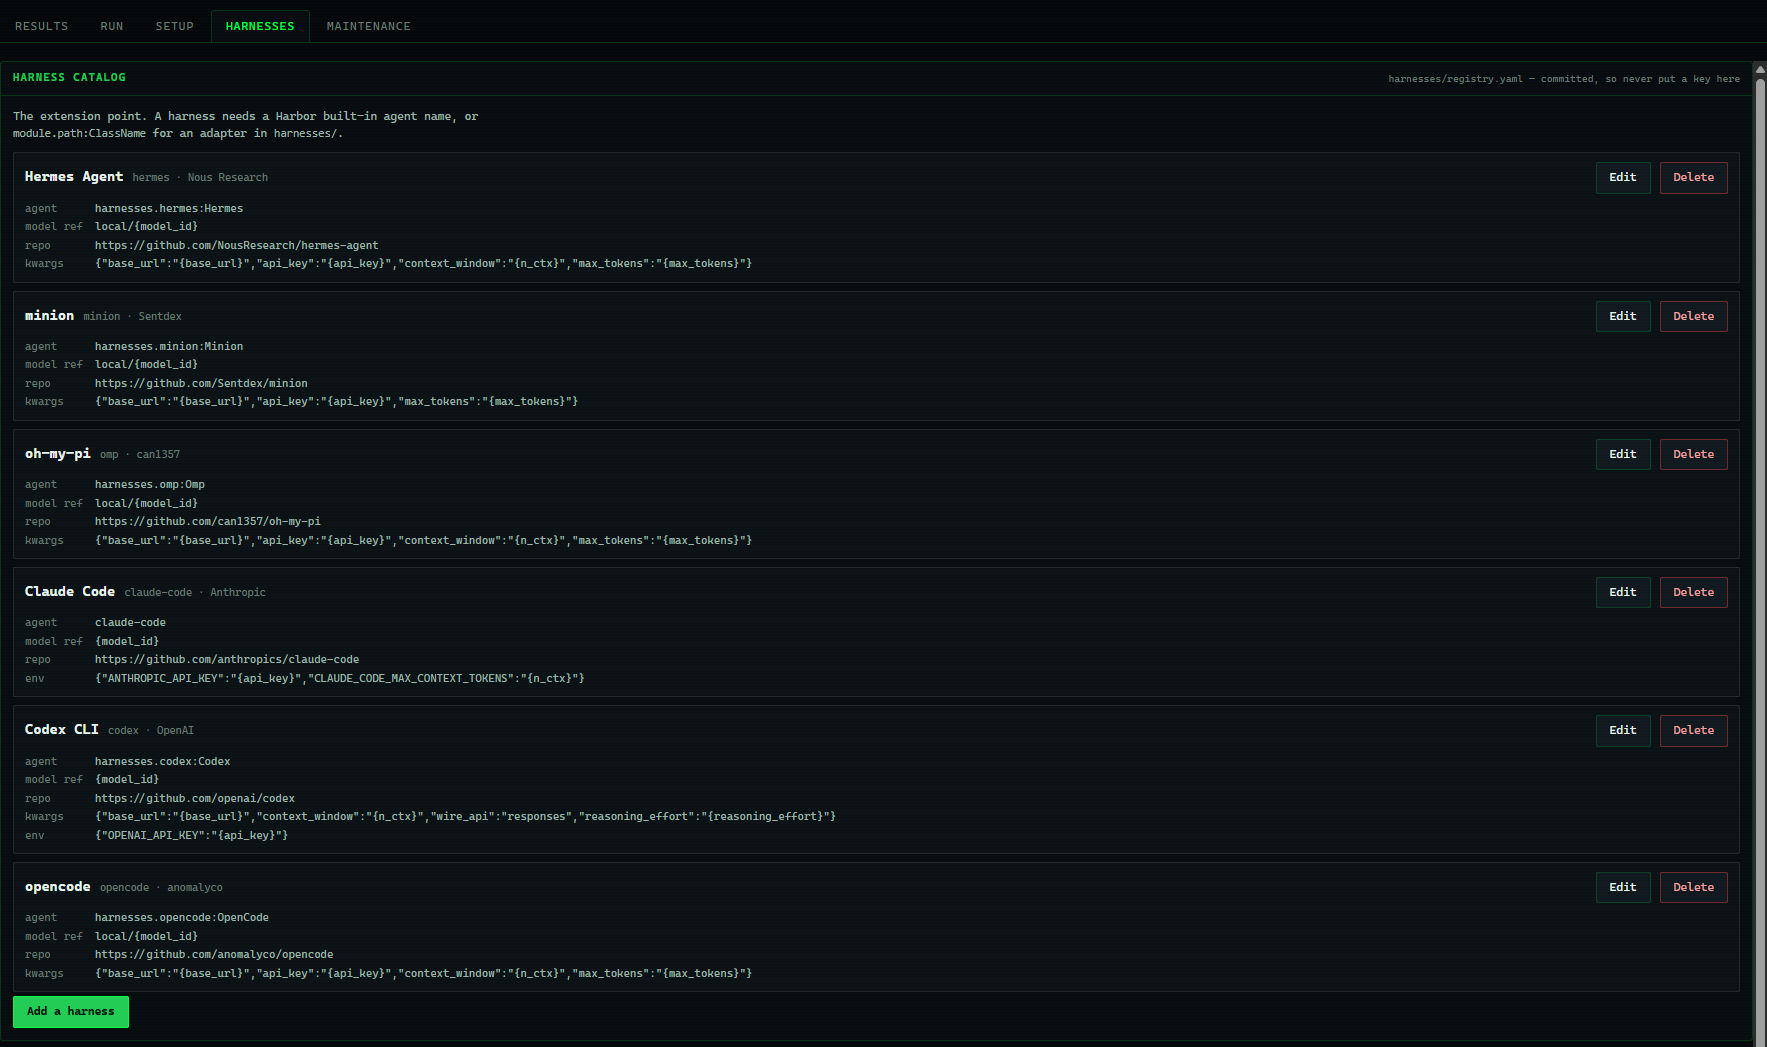
Harnesses. The extension point, and the ones that ship. Each entry is a
Harbor built-in agent name or an adapter in harnesses/, with {placeholders}
resolved at run time, so registry.yaml never contains a credential, and the
UI refuses to write one into it. The same tab carries the run defaults, which
are bounded because every one of them changes what a run measures.
Quick start
Install it, point it at a model, open the browser.
Everything after harness-arena dash happens in the UI: the endpoint URL,
the model, context sizes, timeouts, pre-pulling the task images, starting and
stopping runs. There is no config file to write by hand.
pip install harness-arena

mkdir my-bench && cd my-bench            # your config, runs and caches live here
The directory you run from is the one it works out of, so make one for the purpose rather than running from your home directory. Nothing is written beside the installed package.
Prefer to read or change the code, or add a harness? Clone instead, and every path moves next to the checkout:
git clone https://github.com/danaug23/harness-arena
cd harness-arena

conda env create -f environment.yml      # or: python -m venv .venv
conda activate harness-arena             #     .venv\Scripts\Activate.ps1
pip install -e .
environment.yml pins only Python 3.12 and pip. Every dependency lives in
pyproject.toml, so pip install -e . is the step that actually installs
Harbor, and it is not optional.
Next, serve the model. What that takes depends on which server you run, and the differences do not announce themselves:
- llama.cpp, the setup this is developed against
- Ollama
- Hosted providers, OpenRouter and other OpenAI-compatible APIs
Then start the dashboard and do the rest in the browser:
harness-arena dash # http://127.0.0.1:8420/
| Tab | What you do there |
|---|---|
| Setup | Provider, endpoint URL, model, API key; test the connection and measure speed |
| Maintenance | Health checks, pre-pull the task images, snapshots, delete runs |
| Harnesses | The harness catalog and its kwargs, plus the run defaults, concurrency, timeout multipliers |
| Run | Start and stop benchmarks, toggle diagnostics capture, watch the console |
| Results | Pass rates, task matrix, what a solve and a trial cost, live agent output |
The dashboard is safe to leave open during a run. It re-reads results every 5 s and streams the running agent's output.
Pre-pull before the first benchmark. Harbor otherwise pulls each task image
inside that trial's environment-start budget, and one of them is 21.6 GB, a
cold pull can lose a task to EnvironmentStartTimeoutError instead of scoring
it. Budget ~60 GB and do it once per machine.
Serving with llama.cpp
The setup this is developed against, and the one that needs the least telling:
llama-server reports what it is serving, so the rig reads the context window
and the slot count rather than being handed them.
-
Bind to all interfaces and give the dashboard the machine's LAN address,
http://192.0.2.10:8080/v1, notlocalhost. That string is injected into every task container, wherelocalhostmeans the container itself.llama-server --host 0.0.0.0 --port 8080 \ --model /path/to/model.gguf \ --alias my-model \ --ctx-size 65536 \ --parallel 1
Allow the port through your firewall, then confirm the path end to end rather than from the host only:
docker run --rm busybox wget -qO- http://192.0.2.10:8080/v1/models
The URL works with or without the
/v1suffix; both are tried. -
Serve at least 64K of context (
--ctx-size 65536). hermes-agent refuses to initialise below 64,000 tokens, so a smaller window loses that harness entirely. The run is refused up front rather than failing once per task, but refused is still refused.Keep it inside VRAM. Once the model spills to CPU, throughput collapses and tasks start dying on time rather than on capability. If 64K does not fit, quantize the KV cache rather than lowering the window:
--cache-type-k q8_0 --cache-type-v q8_0roughly halves it and is close to lossless. -
Leave the context window box empty on the Setup tab. llama-server serves
/props, so the probe reads the realn_ctx, readstotal_slots, and fingerprints the weights from the model path. The manifest then records the window as detected rather than assumed, which is a different claim about a run and is why the box is worth leaving alone.--parallelsets how many requests generate at once. The rig defaultsn_concurrent_agentsto the slot count it read, so a single-slot server is never handed queued requests that would be measured as its own latency.
Swapping the loaded weights is enough for the rig to treat it as a different
model. The fingerprint covers the weights rather than the alias, so reloading
the same --alias with a different quant registers as a new model instead of
quietly mixing two sets of results into one label.
Serving with Ollama
Three things differ, and none of them announce themselves:
-
Bind to all interfaces (
OLLAMA_HOST=0.0.0.0) and give the dashboard your machine's LAN address,http://192.0.2.10:11434/v1, notlocalhost. That same string is injected into every task container, wherelocalhostmeans the container itself. Allow the port through your firewall, then confirm the path end to end rather than from the host only:docker run --rm busybox wget -qO- http://192.0.2.10:11434/v1/models
-
Raise the context (
OLLAMA_CONTEXT_LENGTH). The default is 4096 and anything past it is truncated silently, which scores as a reasoning failure rather than as a configuration error.64K is a floor, not a preference. hermes-agent refuses to initialise below 64,000 tokens and exits, so anything less loses that harness entirely. The run is now refused up front rather than failing once per task, but refused is still refused. Serve at least
65536.Keep it inside VRAM: once the model spills to CPU, throughput collapses and tasks start dying on time rather than on capability. If 64K does not fit, quantize the KV cache rather than lowering the window,
OLLAMA_KV_CACHE_TYPE=q8_0roughly halves it and is close to lossless. On one 8 GB card that is the difference between 64K not fitting at all and fitting in 6.4 GB, and it measured faster, since a smaller cache moves less memory per token. -
Set the context window on the Setup tab to match
OLLAMA_CONTEXT_LENGTH. Ollama serves neither/propsnormeta.n_ctx, so the probe reportsn_ctx: 0and every harness would otherwise be handed the conservative fallback. One box covers every harness; there is no need to edit any harness entry. Ollama's/api/showdoes report a context length, but it is the model's architectural maximum rather than what the server was configured to serve, so reading it would trade an obvious failure for a silent one.
Hosted providers
OpenRouter, or any other OpenAI-compatible API, needs no server of your own. Set the key in the shell you launch from, then pick the provider and model on the Setup tab:
export OPENROUTER_API_KEY=...
There is no /props to read, so the model id you choose is the identity and
the context window comes from the provider's catalog rather than from the
server. The key is never written to harnesses/registry.yaml, which is
committed; see API keys.
A hosted run measures an endpoint rather than a file you hold. The weights behind a model id can change without notice, which is worth knowing when you compare runs made weeks apart.
Prefer a terminal? Everything the UI does has a command:
harness-arena init                       # point it at your model server
harness-arena doctor                     # check Docker, Harbor, endpoint, disk
harness-arena prepull                    # cache task images (once per machine)
harness-arena bench --subset stratified-25
From a clone, the same commands run without installing anything:
.\run.ps1 <command> on Windows PowerShell, ./run.sh <command> elsewhere.
| Doc | What's in it |
|---|---|
| This file | Install, configure, run, add a harness, read results |
| docs/ARCHITECTURE.md | How it works internally, module by module |
| docs/TROUBLESHOOTING.md | Every failure hit so far and its fix |
| CONTRIBUTING.md | Adding a harness, tests, the two rules CI enforces |
Contents
- Quick start
- Installation
- Configuration
- Commands
- Choosing a time budget
- Swapping models
- The context window
- Adding a harness
- Pointing the vendor CLIs at a local model
- How scoring works
- Reading results honestly
- The dashboard
- Tests
- Project layout
Installation
Prerequisites
| Requirement | Notes |
|---|---|
| Docker | Linux containers, running. Task images total ~60 GB; budget 100 GB free. |
| Python 3.12+ | Any environment, venv, conda, uv. |
| A model endpoint | Anything serving OpenAI-compatible /v1, or an OpenRouter key. |
| Node.js | Only for the dashboard test suite. Not needed to run benchmarks. |
Install
pip install harness-arena
That is the whole install. Work from a directory of your own, because that is where it keeps your files:
| installed from PyPI | cloned | |
|---|---|---|
config.yaml |
the directory you run from | beside the checkout |
runs/ |
the directory you run from | beside the checkout |
| model label cache | .harness-arena/ there |
bench/models.json |
| harness catalog | the packaged one, until you edit it; your copy after | harnesses/registry.yaml, committed |
Nothing is ever written next to the installed package, so an upgrade cannot take your runs with it and a read-only or shared install still works.
Clone instead when you want to change the code, add an adapter, or keep the harness catalog under version control with the rest of your setup:
git clone https://github.com/danaug23/harness-arena
cd harness-arena

python -m venv .venv
source .venv/bin/activate          # Windows: .\.venv\Scripts\Activate.ps1
pip install -e .
Or with conda:
conda env create -f environment.yml
conda activate harness-arena
pip install -e .
Harbor is pinned. It is the measuring instrument, and an upgrade can change agent defaults or reward handling underneath you. Every run records the version it used, so bumping the pin is safe as long as you re-run the comparisons you care about.
Verify
harness-arena doctor
That checks configuration, Harbor, the Docker daemon, disk space, and whether the endpoint answers, printing the specific fix for whatever fails. Then prove the benchmark plumbing itself works:
harbor run -d terminal-bench@2.0 -a oracle --n-tasks 2 --yes
The oracle agent runs each task's reference solution. It should score 2/2 in under a minute. If it does, Docker, the dataset, and the verifier all work.
First-run setup
harness-arena prepull # cache all task images (~60 GB, one time per machine)
Do this before your first benchmark. Harbor otherwise pulls each task image
inside that trial's environment-start budget, and the images are not small.
One task image is 21.6 GB. A cold pull can blow the 600 s default and lose a
task to EnvironmentStartTimeoutError rather than scoring it.
Configuration
harness-arena init writes config.yaml, which is gitignored.
config.example.yaml documents every setting.
Precedence: defaults → config.yaml → environment → command-line flags.
Pointing at a model
endpoint:
  provider: openai-compatible      # or: openrouter
  base_url: http://localhost:8080/v1
| Server | Typical base_url |
|---|---|
| llama-server, LM Studio | http://localhost:8080/v1 |
| vLLM | http://localhost:8000/v1 |
| Ollama | http://localhost:11434/v1 |
| Another machine | http://<host>:<port>/v1 |
| OpenRouter | https://openrouter.ai/api/v1 (set provider: openrouter) |
A local server has one model loaded and is detected automatically. OpenRouter
serves hundreds, so name the one you mean with endpoint.model.
API keys
Never put a key in harnesses/registry.yaml, that file is committed.
The supported path is indirection. Keep the key in your environment and let the config name the variable:
export OPENROUTER_API_KEY=...
That is all. Each provider's conventional variable is picked up automatically.
To use a different variable, set endpoint.api_key_env.
harness-arena init can also store a literal key in config.yaml. That file is
gitignored and written 0600, but once you do that, treat it as a credential.
Keys are scrubbed out of run manifests, printed commands, and exported snapshots, tested explicitly, because a leak here is silent.
Run defaults
harnesses/registry.yaml holds the harness catalog and the run defaults.
| Key | Default | Why |
|---|---|---|
dataset |
terminal-bench@2.0 |
Harbor dataset reference |
n_concurrent |
2 |
Trials in flight. One generating + one staged is enough to hide setup; more just sit blocked holding containers. |
n_concurrent_agents |
1 |
How many may generate. Keep at the server's slot count or requests queue. |
n_attempts |
1 |
Attempts per task |
max_retries |
1 |
Extra attempts for a trial that died of an infrastructure failure. Set 0 to disable, see below |
agent_timeout_multiplier |
4.0 |
Scales each task's agent budget, see below |
environment_build_timeout_multiplier |
4.0 |
The 600 s default is too short for multi-GB images |
The two concurrency knobs
These are different and the distinction matters:
n_concurrent: trials in flight. Their image pulls, harness installs, verifiers and teardowns all overlap.n_concurrent_agents: how many may generate. Harbor enforces this with a semaphore taken onAGENT_STARTand released onAGENT_END, so the model sees one request stream regardless of how many trials are open.
Pipelining is close to free. On a single-slot server a meaningful slice of wall
clock, often around a tenth, is non-LLM work: harness installs, image pulls
and verifiers, with the GPU idle throughout. Overlapping that changes nothing
the model sees, so pass rates stay comparable to runs made without it. Measure
your own share with harness-arena throughput.
Raising n_concurrent_agents above your server's slot count does not buy
throughput: requests queue rather than share, and the degradation is severe
enough to dominate everything else. Worse, the penalty is unfair: it falls
hardest on whichever harness makes more calls, which is the variable under
test. For real parallelism, start the server with matching parallel slots
(llama-server: -np), raise both knobs together, and re-baseline.
Left unset, n_concurrent_agents defaults to the slot count the endpoint
reports, so a self-hosted single-slot server is safe by default.
When a harness cannot reach the model
A trial can die because its HTTP request never got sent. Most harnesses report only that sending failed, not why, the underlying cause (refused, reset, timed out) is discarded before it reaches the log. So the evidence a run leaves behind cannot, on its own, tell you whether the endpoint was down or the client misbehaved.
That matters because the two have opposite fixes, and the tempting reading, "the endpoint dropped", is the one that hides a bug in the client or the adapter. In a 89-task run observed here, 37 trials failed this way while 50 succeeded interleaved with them, with the longest failure streak being 3: the endpoint was demonstrably up throughout, and most failures landed on the very next request after a successful one.
Turn on "Capture diagnostics" on the Run tab (or --debug-capture) for any
run you intend to trust. It samples the endpoint on a fixed cadence for the life
of the run and writes endpoint-health.jsonl beside the trials, so a failure
timestamp can be checked against independent evidence rather than guessed at. It
is read-only, takes no generation slot, and cannot perturb the measurement, a
watchdog that competed for the one slot would manufacture the failures it exists
to observe.
It also sets RUST_LOG so the Rust harnesses report connection-level detail.
Most ignore it and pay nothing; Codex does not. It logs one line per
streamed event, which came to 97 % of a 24.9 MB trial log. That costs disk, and
it is the intended trade: the record exists to attribute a transport failure
afterwards. The live feed filters it out of the view, so leaving diagnostics on
does not cost you a readable panel.
Without it, the dashboard says so: a trial marked ~ reports that the request
never reached the model and that diagnostics were off, so the cause is
unrecorded. That is deliberately weaker than blaming the endpoint.
When the endpoint drops a connection
Endpoints fail. A connection is refused, reset, or times out mid-turn, the agent process dies, and Harbor records a non-zero exit. That is not evidence about the harness, but scored naively it costs the harness a task, and a working adapter starts to look broken.
harness-arena handles it in two places:
- During the run. A trial that dies of an infrastructure failure is retried
once (
max_retries). Nothing at retry time can tell a dropped connection from a harness crashing on its own bug, so the retry list is kept narrow and the budget is written into the run manifest, a run that retried is not the same experiment as one that did not, and the dashboard says so. - Afterwards.
bench.collectre-reads the trial log. A transport error naming a model-API path is classified as an endpoint fault: it shows in the task matrix as~, is excluded from the pass rate rather than counted as a loss, and is left out of the run-to-run comparison, a task one harness never got a fair attempt at is not a disagreement between harnesses. The count is always shown next to the rate; the denominator never shrinks silently.
The classifier is deliberately strict. It wants both a transport signature and an API path on the same line, because an agent curling a dead port is ordinary Terminal-Bench work. A missed endpoint fault is scored the way it always was; a false one would quietly remove a real harness failure from the denominator, which is the more damaging mistake.
When every task fails in seconds
If a run dies instantly on every task with a Docker compose error like:
Error response from daemon: all predefined address pools have been fully subnetted
failed to create network <task>__<id>__env_default
Docker has run out of subnets, not memory or disk. Each task runs as a compose project, and each project creates its own bridge network. Docker's built-in default address pools carve two private ranges into /16 and /20 blocks, 32 networks total. A stopped or killed run used to leave its network behind, so they accumulated silently until nothing could be allocated.
Nothing in the error says "subnet", and it fires before the image or the model is touched, so it looks like the benchmark is broken rather than the host being out of a resource nobody thinks about.
Stopping a run now reaps its networks along with its containers, and Maintenance reports both. To clear a backlog by hand:
docker network ls --format '{{.Name}}' | grep '__env_default$' | xargs -r docker network rm
If you legitimately want many trials in flight, raise the ceiling instead by
adding a pool to Docker's daemon.json. Pick a private range that does not
collide with your own network, and carve it small enough to yield plenty of
blocks:
{"default-address-pools": [{"base": "<your-private-range>/16", "size": 24}]}
A /16 at size: 24 yields 256 networks. See Docker's dockerd reference for
the current built-in defaults.
Choosing a time budget
This is the setting most likely to make your results meaningless, and it is the one nobody can pick for you. It depends entirely on how fast your model generates.
Terminal-Bench gives each task 900-1800 s of agent time, sized for frontier
APIs. A trajectory spends 30k, 150k output tokens. At 25 tok/s that is 20-100
minutes of pure generation, so at the stock 1.0× budget almost everything
times out mid-task, and a timeout scores exactly like a wrong answer, so
the benchmark silently measures your hardware instead of the harness.
Measure it:
harness-arena probe --speed
That times one uncontended request and recommends a multiplier. Roughly:
| Output speed | agent_timeout_multiplier |
|---|---|
| ~25 tok/s, large dense model, one consumer GPU | 16.0 |
| ~50 tok/s | 8.0 |
| ~140 tok/s, small MoE, few active params | 4.0 |
| hosted frontier API | 1.0 |
Treat the recommendation as a floor. The arithmetic covers generation only, while the agent budget also has to absorb prompt processing on every turn, which grows with the context, plus the wall clock of the commands the agent actually runs. Doubling it is a reasonable starting point.
Err high. Over-budgeting costs wall clock on tasks the agent would have abandoned anyway; under-budgeting kills tasks mid-solve.
The default 4.0× gives the 900 s tasks 1 h and the 1800 s tasks 2 h.
Raising it has narrower reach than it looks. Once the budget is roughly
right, very few failures are actually timeouts. Most end with no exception
at all, meaning the agent stopped on its own. It had decided it was finished,
and more time would have changed nothing. Those are correctness failures
wearing a timeout's clothes. Check the T count in the matrix before spending
wall clock on a bigger multiplier.
Runs at different multipliers are not comparable and the dashboard will not pair them.
Commands
harness-arena init          Create config.yaml interactively
harness-arena doctor        Check everything needed to run
harness-arena probe         Identify the model (--speed to time it)
harness-arena bench         Run the benchmark, one harness after another
harness-arena dash          Serve the live dashboard
harness-arena export        Write a standalone snapshot HTML
harness-arena collect       Print a text summary of all runs
harness-arena throughput    Wall clock and LLM utilization per run
harness-arena prepull       Cache task images ahead of a run
harness-arena subset        Regenerate a stratified task subset
harness-arena <command> --help shows that command's own options.
bench flags
| Flag | Default | Meaning |
|---|---|---|
--harness <name> |
all in registry | Run only these harnesses (repeatable) |
--subset <name> |
none | Named task list from bench/subsets/<name>.txt |
--n-tasks <n> |
none | Smoke-test with the first N tasks |
--task <name> |
none | Run one specific task (repeatable) |
--agent-timeout-multiplier <n> |
4 |
Scale each task's agent time budget |
--n-concurrent <n> |
2 |
Trials in flight at once |
--n-concurrent-agents <n> |
slot count | How many may generate at once |
--base-url <url> |
from config | Override the endpoint |
--model <id> |
from config | Override the model |
--label <text> |
auto | Override the model's display label |
--dry-run |
off | Print the harbor run command without executing |
--allow-hosts |
off | Send the egress allowlist (network-restricted datasets only) |
Anything not covered goes straight through to Harbor after --:
harness-arena bench --subset stratified-25 -- --max-retries 2
Swapping models
Load different weights on your server and re-run. Nothing else changes.
The runner probes /v1/models and /props and fingerprints the weights,
id, parameter count, file size, ftype, trained context, and file path, not the
alias. Reload the same alias with a different quant and it is correctly treated
as a new model, prompting once for a display label (pre-filled from the weights
filename, so it is usually one Enter). Labels are cached in bench/models.json,
keyed by fingerprint.
/props is the better endpoint: it reports model_path, model_ftype,
n_ctx, build_info and, critically, total_slots, which is what
n_concurrent_agents should match.
Hosted providers have no /props and their weights can change without notice,
so a hosted run is a measurement of an endpoint, not of a file you hold. The
fingerprint is derived from the model id, and runs are labeled accordingly.
To compare across models, hold the timeout multiplier constant.
The context window
Every harness is told the same window, resolved once. {max_tokens} is an
eighth of it, which leaves room for a long reply without letting one response
eat the history the next turn needs.
Three sources, most authoritative first:
| Source | When |
|---|---|
Configured, endpoint.context_window, or the Context window box on the Setup tab |
Whenever it is non-zero. Set it once and every harness gets it |
| Detected, what the server reports | llama.cpp publishes the loaded window on /props, and that is the right answer |
| Fallback, 4096 | Nothing else knew. The run says so on the console and the dashboard labels it |
Which one was used is recorded per run, because "128K, detected" and "4K, because nothing knew" are not the same claim about a result.
Ollama cannot be detected. It publishes no /props, and /api/show reports
only the model's architectural maximum, not the window the server was
started with. /api/ps reports none at all. Its own default has moved around
(2048 historically, later VRAM-dependent) and OLLAMA_CONTEXT_LENGTH or a
Modelfile num_ctx overrides it, so there is no number worth assuming. Set it
on the Setup tab to match what you started the server with.
Harness minimums
A harness may refuse to run below some window, and hermes-agent does: under 64,000 tokens it exits during initialisation. Harbor sees only a non-zero exit, the same thing a crash produces, and that exception is on the retry list, so an 89-task run would reproduce one knowable refusal 178 times with the reason buried in per-trial agent logs.
Claude Code reaches the same place by a different route. It does not refuse anything; it simply sends 22,208 tokens of system prompt and tool schemas before the task is mentioned, so under about 24K every first request overflows the window and every trial fails identically. Its floor is 32768, the point below which the fixed prompt leaves no room to work in.
Such a floor is declared in the catalog as min_context_window and checked
once, while the command is built:
hermes needs a context window of at least 64,000 tokens, but this run
would give it 32,768 (configured).
Note what this interacts with: the floor is only reachable because the window is accurate. A harness told nothing will guess, and guess high. The refusal is the harness being honest about what it needs, not a regression. Raising the configured number without raising what the server actually serves converts a loud refusal into silent truncation, which is strictly worse.
The fallback is deliberately small. Overshooting is the dangerous direction: the server truncates in silence and the run scores it as a reasoning failure rather than a configuration error.
It matters because the window is what a harness measures itself against: it decides when compression fires and when history gets truncated. A harness left to guess is not running the same experiment as one that was told, and the difference shows up as a capability gap that isn't one.
Each harness is given it in the key that harness actually reads:
| Harness | Key | Notes |
|---|---|---|
| hermes | model.context_length, model.max_tokens |
Auto-detects otherwise, and its own example config names a local server with a custom num_ctx as a case where that goes wrong |
| oh-my-pi | contextWindow, maxTokens |
In the generated models.yml |
| opencode | limit.context, limit.output |
In the generated opencode.json |
| minion | MINION_MAX_TOKENS only |
Reads /v1/models and /props from the server itself, the same source this rig probes, so there is nothing to pass and no second setting to disagree with it |
| Claude Code | CLAUDE_CODE_MAX_CONTEXT_TOKENS, CLAUDE_CODE_MAX_OUTPUT_TOKENS |
Sizes auto-compaction from a built-in table of model ids. A self-hosted model is not in it, so it assumes 200K and says so, set this or it works to a window the server does not have |
| Codex | model_context_window |
Config file only; there is no environment variable for it, which is the entire reason harnesses/codex.py exists |
No adapter carries a fallback constant. A hardcoded window would be a second
answer that goes silently wrong the moment you load a different model, so when
no value is supplied the setting is omitted and the harness decides. A
window of 0, what a server that advertises nothing yields, counts as no
value.
Both numbers are recorded in each run's manifest and shown in the dashboard, so a run made at a different window is visible rather than something you have to ask about.
Adding a harness
- If Harbor already ships an agent for it (
harbor run --helplists them) and that agent can reach your endpoint, you need no Python, just a registry block. - Otherwise drop an adapter in
harnesses/<name>.py: aBaseInstalledAgentsubclass withinstall(),run(), and optionallypopulate_context_post_run()for token accounting.harnesses/omp.pyis the worked example;harnesses/hermes.pyshows how to subclass a built-in agent to change only its config. - Add the block to
harnesses/registry.yaml:
  mycli:
    label: "My Harness"
    vendor: "someone"
    repo: "https://github.com/..."
    agent: "harnesses.mycli:MyCli"   # or a Harbor built-in name
    model_ref: "local/{model_id}"    # what --model receives
    agent_kwargs:                    # passed as --ak key=value
      base_url: "{base_url}"
      api_key: "{api_key}"
    agent_env:                       # passed as --ae KEY=VALUE
      SOME_FLAG: "1"
Placeholders filled from the live probe: {model_id}, {base_url},
{base_url_root}, {host}, {n_ctx}, {max_tokens}, {label}, {api_key}.
{base_url_root} is {base_url} without a trailing /v1, for a harness whose
client appends its own version segment, Anthropic's does, OpenAI's does not.
Getting it the wrong way round fails every trial at the first request; see
Pointing the vendor CLIs at a local model.
{api_key} resolves at run time and is scrubbed out of manifests and logs.
Never write a literal key here. This file is committed.
Nothing else in the codebase knows harness names. See docs/ARCHITECTURE.md for the adapter contract.
Expect one non-obvious detail per harness, and expect it to be undocumented. Every adapter here needed something the README of its own project did not mention, found by running the CLI and reading the source:
| Harness | What it needed |
|---|---|
| hermes-agent | model.base_url plus a local-server provider; it discards a non-loopback base URL otherwise, and an empty key aborts before the request is built. |
| minion | A named source (MINION_SOURCE_<NAME>_BASE_URL), not a single base URL, and --yolo for approvals. One-shot saves no session, so usage comes from its traffic log. |
| oh-my-pi | Install the release binary; the npm package needs Bun. Every model role must be pinned or a subagent calls a cloud provider. |
| opencode | --auto and --pure. Its token stream can end without the final step_finish, so the exported session is the fallback. |
| Claude Code | ANTHROPIC_BASE_URL must not end in /v1, the client appends /v1/messages itself, and it has to be set on the harbor process, because the built-in agent reads that one straight from os.environ. |
| Codex | base_url must keep /v1: it appends only /responses. A custom provider block also fails to load without a name field, with provider name must not be empty. |
The pattern: the failures are silent. A harness that is not allowed to use tools still produces a transcript, still burns wall clock, and still scores zero, it just looks like a model that cannot code.
Pointing the vendor CLIs at a local model
Claude Code and Codex ship as products for their vendor's own API, and the common assumption is that using either with a self-hosted model means running a translating proxy. On llama.cpp it does not: the server implements all three dialects directly, so both CLIs talk to your endpoint the same way every other harness here does. No proxy is involved, which matters. A proxy would be a second implementation sitting inside the thing being measured.
What each one needs, verified against this rig's endpoint rather than inferred from documentation:
| Claude Code | Codex | |
|---|---|---|
| API | Anthropic Messages | OpenAI Responses |
| Path | POST <root>/v1/messages |
POST <base_url>/responses |
| Base URL | /v1 removed ({base_url_root}) |
/v1 kept ({base_url}) |
| Credential | ANTHROPIC_API_KEY (any value) |
OPENAI_API_KEY via the provider's env_key |
| Adapter | none, Harbor's built-in plus env | harnesses/codex.py |
The base URL is spelled two different ways on purpose, and that is the one
thing most likely to bite. Both are correct: the Anthropic client owns the
version segment and appends /v1/messages itself, so a URL ending in /v1
becomes /v1/v1/messages; OpenAI's client does not, so the same URL must keep
it. That is why there is a {base_url_root} placeholder alongside {base_url}
rather than a fixup inside one harness. The distinction belongs to the SDK, and
the next Anthropic-shaped harness will want the same thing. tests/test_local_agents.py
asserts both spellings together, because the bug is the pair disagreeing.
Neither CLI needs an account. A local server ignores the key, but both refuse to
start without one, so the rig passes the literal local when the endpoint wants
no credential.
Check your server actually serves the dialect. llama.cpp does; most others
serve only OpenAI's. Two curls settle it:
# Claude Code needs this to be 200 (note: /v1/messages, not /messages)
curl -s -o /dev/null -w '%{http_code}\n' -X POST "$BASE/v1/messages" \
  -H 'content-type: application/json' \
  -d '{"model":"m","max_tokens":16,"messages":[{"role":"user","content":"hi"}]}'

# Codex needs this to be 200
curl -s -o /dev/null -w '%{http_code}\n' -X POST "$BASE/v1/responses" \
  -H 'content-type: application/json' -d '{"model":"m","input":"hi"}'
A 404 on the first means Claude Code cannot run against that server without a
proxy. A 404 on the second means Codex cannot, set wire_api: chat in its
registry block to fall back to /v1/chat/completions, which every
OpenAI-compatible server implements.
A 200 on the second is necessary but not sufficient: Codex always asks for
reasoning, and a server can serve /v1/responses while refusing an effort. Add
"reasoning":{"effort":"low"} to that body to see which you have, the rig
probes exactly this and adapts, but it is the difference between a Codex run
that works and one that fails on every task.
Two further notes worth knowing before reading results:
- Claude Code's fixed prompt is large. Measured at 22,208 tokens before the
task is mentioned, 18,455 of that is the schemas for its 26 built-in tools.
That is a real part of what the harness is, not overhead to subtract, but it
is why its
min_context_windowis 32768: below that there is no room left to work in. An image carrying MCP servers pays more (33,182 tokens across 88 tools on a developer machine). - Both are told the window explicitly. Left alone, Claude Code assumes 200K for a model it does not recognise and Codex falls back to its own metadata, each would then be running a different experiment from the other four.
- Codex's reasoning effort is probed, not fixed. It sends a
reasoningobject on every request and gives no way to omit the effort, leaving the setting out still sends{"summary":"auto"}. Servers disagree about what they will accept: llama.cpp takes any effort from any model, Ollama answers 400does not support thinkingfor a model that cannot, and that reply kills every trial at its first request. So the endpoint is asked once and the effort is set tononewhen it refuses one. Both the value and where it came from land in the manifest asreasoning_effortandreasoning_effort_source, because a run that reasoned and one that did not are not two measurements of the same thing. Pin it withendpoint.reasoning_effortwhen you need one effort across an experiment.
How scoring works
Per task, after the agent phase ends (finished or timed out):
- Harbor copies the task's
tests/into the container, after the agent is done, so the agent never sees the tests during its run. tests/test.shrunspytest, emitting a CTRF report.- The decisive line:
if [ $? -eq 0 ]; then echo 1 > /logs/verifier/reward.txt
else                  echo 0 > /logs/verifier/reward.txt; fi
- Harbor reads that into
verifier_result.rewards; a task counts as resolved only if every reward is ≥ 1.0.
Scoring is binary and all-or-nothing. One failing assertion out of the whole file scores zero. There is no partial credit, 5/6 checks scores exactly the same as 0/6.
That is why the matrix shows the check ratio: the reward alone cannot distinguish a harness that nearly solved something from one that had no idea.
The verifier runs even when the agent times out. Harbor grades whatever is on disk, so a trial can time out and pass. The reward is ground truth; such a cell renders as a pass with an amber underline.
Reading results honestly
Confidence intervals. Terminal-Bench 2 is 89 tasks, and a subset is fewer. At that size a 5-point gap is often noise. Every pass rate is drawn with its 95 % Wilson interval; if the whiskers overlap, you have not shown a difference. Compare the disagreement set instead: tick disagreements only on the task matrix, which leaves just the tasks the harnesses did not agree on.
Errors are not wrong answers. A trial that dies on
ApiConnectionClosedError or EnvironmentStartTimeoutError scores zero but
says something about plumbing, not reasoning. Those get their own ! cell and
are broken out in the run log.
Timeouts are not wrong answers either. A T cell means the agent was still
working when the budget expired. That is a statement about your hardware and the
multiplier, not the harness's ability.
Subsets vs smoke tests. bench/subsets/stratified-25.txt is a deliberate
experiment: 25 of the 89 tasks, difficulty-stratified to match the full set's
mix, stride-sampled over sorted names so it is deterministic and not
alphabetically biased. Every harness runs that identical list, which is what
keeps the harness comparison valid even though the absolute pass rate is not
leaderboard-comparable. Regenerate or resize with harness-arena subset.
An ad-hoc --n-tasks 3 run is a different animal. It gets a smoke badge.
Named subsets keep their name as the badge instead.
hide smoke runs is off by default: nothing disappears unless you ask it to.
Switch it on and it reports what it is holding back (1 hidden), so a missing
run is always accounted for on screen. Note that a smoke run is excluded from
run-to-run comparisons regardless of that checkbox, because it did not run
the same task list, re-run it with --subset <name> to make it comparable.
What the rig refuses to compare. A comparison is only drawn between runs that share a model, a subset, a partial-status, and a timeout multiplier, and differ in harness. A harness given twice the wall clock finishes strictly more tasks, so pairing across budgets would measure the budget while looking every bit as authoritative as a real comparison.
Harness defaults are part of the harness. Each runs with its own default thinking effort, turn limits and toolset, that is the thing being measured, and it is what you would actually get if you used it. Both adapters disable persistent memory/learning, without which task N would be solved by an agent shaped by tasks 1..N-1 and the benchmark would measure accumulated memory rather than the harness.
The dashboard
harness-arena dash # http://127.0.0.1:8420
A single-screen grid; panels scroll internally rather than the page. Below 1180 px wide it unwinds into a normal stacked document.
| Panel | Shows |
|---|---|
| Live feed | Tail of the running trial's agent output, with liveness state |
| Pass rate | Per-harness bars with 95 % Wilson whiskers |
| Task matrix | Task × run grid; ✓ solved, 5/6 checks passed, T 1/3 out of time with partial credit, ! errored |
| Cost of a solve | Median task wall clock vs output tokens per solved task |
| Cost of a run | The same chart over every trial, won or lost. A harness that solves the cheap tasks and loses the expensive ones reads cheap on the first and dear on this one |
| Run log | Every run on disk with its full configuration |
Hover any matrix cell for the per-check breakdown. The legend lists only the states actually present. "Disagreements only" filters the matrix to tasks where harnesses differ.
Any panel opens full screen. Six panels on one page means each is small,
and the two holding the most, an 89-row task matrix and the run log, are the
ones that suffer. The button in a panel's top-right corner expands it to the
whole window; Esc, the close button, or a click outside puts it back. The
expanded copy is the same panel, so it keeps updating on the 5 s poll while it
is open, and its chart/table toggle still works.
The model selector, headline numbers and filters sit in the first column above the live feed rather than in a strip across the top. As a full-width strip they cost every column a band of height, and the pass rate and task matrix, the two that most need it, were paying for a row of controls.
The live feed goes quiet during long generations, output is piped through
tee, which flushes per line, so an unbroken reasoning block produces nothing
until it ends. The panel says so rather than looking hung.
What the feed hides, and what it never hides. Agent logs carry machine exhaust alongside the transcript, and two kinds are filtered from the view only, the log on disk always keeps every byte:
- Claude Code's
thinking_tokenscounter, emitted once per couple of tokens of reasoning (measured at 91 % of one 6.6 MB log). - Rust
tracingatTRACE/DEBUG/INFO, which--debug-captureswitches on and which Codex, being Rust, emits once per streamed event (97 % of one 24.9 MB log), including the field-list trailers that continue a record onto its own line.
WARN and ERROR are deliberately kept: a refused connection or a reset
stream announces itself there, and those are the reason diagnostics get enabled
in the first place. Tool output is kept too, however ugly, an agent that
hex-dumps a binary produces a screen of hex, and that is the work, not noise.
Because a filtered log can be almost entirely filtered, the feed budgets scanning separately from rendering and reads far past the first window to find content. When even that comes up empty it says so, naming the cause, silence would read as a hung agent, which is the one thing this panel exists not to do.
The control plane
The other four tabs write: they save configuration, start and stop processes,
edit registry.yaml, and delete run directories. That has security
consequences, so:
- It binds loopback. Any page in your browser can send requests to
127.0.0.1, so localhost alone is not a boundary. - Writes need a token minted per server start and injected into the page. It travels in a custom header, which cross-origin JavaScript cannot set without a preflight, and this server answers none and sends no CORS headers.
- The
Hostheader is validated, which is what actually defeats DNS rebinding. Only JSON bodies are accepted, because form encoding is the one content type sendable cross-origin without a preflight. - API keys are never sent to the browser. The UI is told that a key is set, never what it is.
registry.yamlrefuses credentials. It is committed, so a key pasted into a harness field is rejected with an explanation rather than saved.
None of that makes it safe to expose. Keep it on loopback or put it behind an
authenticating proxy. harness-arena dash --read-only serves results with the
control plane disabled entirely.
Stop really stops. Killing the runner is not enough: Docker owns the task containers, not the process, so the agents inside them keep generating against your endpoint. Stopping therefore also removes the containers that run created, identified by exclusion against whatever was already running, so unrelated containers are untouched, and reports how many it removed.
Maintenance shows which files are in play. An editable install pins an
absolute path, so launching from a second clone silently serves the first one's
runs; cd does not change how Python resolves imports. The tab prints the code
root, config path and runs directory, and doctor warns when your working
directory is a different checkout.
harness-arena export writes a standalone snapshot with the data inlined; it
works offline with no server and carries no control plane. It inlines run
manifests, so look at what is in one before publishing it.
Tests
python tests/test_config.py      # config precedence and secret redaction
python tests/test_api.py         # control-plane auth, validation, redaction
python tests/test_supervisor.py  # run guards and stop semantics
python tests/test_collect.py     # comparison rules and statistics
python tests/test_tokens.py      # adapter parsers and generated configs
python tests/test_local_agents.py # endpoint routing for Claude Code and Codex
node   tests/test_dashboard.mjs  # every dashboard render path
All seven run in seconds and need no benchmark data, no model server and no Docker. They cover what a real run validates too slowly or too late, and what fails silently rather than loudly:
- Token accounting: a trial takes hours, and a silent zero would make the efficiency panel wrong rather than broken.
- Which runs may be compared: a bad pairing renders a confident disagreement set that is actually measuring the wrong variable.
- Secret handling: that a key never reaches a run manifest, a log, or the browser. A leak here changes nothing visible; the credential is simply also in a file you published.
- Control-plane authentication: every gate that, if it regressed, would leave the server working exactly as before while also doing what a hostile page asked.
- Stop semantics: a stopped job that is not marked reads as running forever, so its partial results masquerade as a benchmark in progress.
- Endpoint routing for the vendor CLIs: Claude Code needs the base URL
without its
/v1and Codex needs it with, from one configured value. Either one spelled wrong fails at the first request of every trial, which reads as a harness that cannot solve anything rather than as a URL bug.
node tests/test_dashboard.mjs <results.json> runs against real collector
output instead of the built-in fixture.
Project layout
harness-arena             the CLI (bench/cli.py); run.ps1 / run.sh wrap it
config.example.yaml       every setting, documented; copy to config.yaml
environment.yml           conda env with harbor pinned
pyproject.toml            package metadata and the console script

harnesses/
  registry.yaml           harness catalog + run defaults, the extension point
  hermes.py               hermes-agent adapter (local-endpoint routing)
  minion.py               minion adapter (named-source config, traffic-log usage)
  omp.py                  oh-my-pi adapter
  opencode.py             opencode adapter
  codex.py                Codex CLI adapter (provider block + context window)
                          (Claude Code needs none. It is a registry block and
                           environment variables, nothing more)

bench/
  cli.py                  the `harness-arena` command; init and doctor
  config.py               layered config, provider catalog, secret redaction
  probe.py                endpoint -> model fingerprint + label; speed probe
  runner.py               registry + model -> `harbor run`, one harness at a time
  supervisor.py           start/stop a run on behalf of the UI, one at a time
  registry.py             read and edit the harness catalog, safely
  collect.py              runs/ -> normalized index (pass rate, Wilson CI, head-to-head)
  activity.py             live tail of the in-flight trial
  throughput.py           wall clock and LLM utilization per run
  prepull.py              cache task images ahead of a run
  make_subset.py          regenerate a stratified subset from the dataset repo
  subsets/                named task lists; every harness runs the same one

dashboard/
  server.py               stdlib HTTP server: results API + authenticated control plane
  index.html              the dashboard and its five tabs, self-contained

tests/                    seven suites, no benchmark data required
runs/                     Harbor job dirs (gitignored)
runs/, config.yaml and bench/models.json are gitignored. The first is
large and regenerable, the second may hold a credential, and the third records
which weights are on your disk.
Credits
harness-arena was created and is maintained by Dan August (@danaug23).
If it is useful in published work, please cite it:
Dan August. harness-arena: comparing agent harnesses on one held-constant model.
2026. https://github.com/danaug23/harness-arena
License
Apache-2.0, Copyright 2026 Dan August. See NOTICE for the projects this runs against, Harbor, Terminal-Bench, and the harnesses under test are fetched at run time and carry their own licenses.
Apache-2.0 requires anyone redistributing this, modified or not, to keep the NOTICE file intact, so the attribution travels with the code rather than living only here.
1 maintainer

Download files
Download the file for your platform. If you're not sure which to choose, learn more about installing packages.
Source Distribution
Built Distribution
Filter files by name, interpreter, ABI, and platform.
If you're not sure about the file name format, learn more about wheel file names.
Copy a direct link to the current filters
File details
Details for the file harness_arena-0.1.1.tar.gz.
File metadata
- Download URL: harness_arena-0.1.1.tar.gz
- Upload date:
- Size: 251.6 kB
- Tags: Source
- Uploaded using Trusted Publishing? Yes
- Uploaded via: twine/7.0.0 CPython/3.13.14
File hashes
| Algorithm | Hash digest | |
|---|---|---|
| SHA256 |
3976b222e5c7d254f072a172d5d0ba40191d48ac1192ef5582181ded3dd70679
|
|
| MD5 |
51fd974f0b2278790d48a88cba93fee3
|
|
| BLAKE2b-256 |
b15ef8278b608198239d347bfa429becb0d9d56fdf76f63d2800fe72c9f7769e
|
Provenance
The following attestation bundles were made for harness_arena-0.1.1.tar.gz:
Publisher:
release.yml on danaug23/harness-arena
-
Statement:
-
Statement type:
https://in-toto.io/Statement/v1 -
Predicate type:
https://docs.pypi.org/attestations/publish/v1 -
Subject name:
harness_arena-0.1.1.tar.gz -
Subject digest:
3976b222e5c7d254f072a172d5d0ba40191d48ac1192ef5582181ded3dd70679 - Sigstore transparency entry: 2443762537
- Sigstore integration time:
-
Permalink:
danaug23/harness-arena@96d35fd5e0b9392593f74bd8d01cba02862e7c9d -
Branch / Tag:
refs/tags/v0.1.1 - Owner: https://github.com/danaug23
-
Access:
public
-
Token Issuer:
https://token.actions.githubusercontent.com -
Runner Environment:
github-hosted -
Publication workflow:
release.yml@96d35fd5e0b9392593f74bd8d01cba02862e7c9d -
Trigger Event:
push
-
Statement type:
File details
Details for the file harness_arena-0.1.1-py3-none-any.whl.
File metadata
- Download URL: harness_arena-0.1.1-py3-none-any.whl
- Upload date:
- Size: 191.5 kB
- Tags: Python 3
- Uploaded using Trusted Publishing? Yes
- Uploaded via: twine/7.0.0 CPython/3.13.14
File hashes
| Algorithm | Hash digest | |
|---|---|---|
| SHA256 |
4deaed26f29c40d92c71b15dfd58020a1b8d6886ba1e6f7896c25be653532200
|
|
| MD5 |
e618a2b28a7a4fcc64a857800b3578bf
|
|
| BLAKE2b-256 |
382bfe3a043b33b2a569451c779dcf9efd14f685b29688208878cf4d0c110756
|
Provenance
The following attestation bundles were made for harness_arena-0.1.1-py3-none-any.whl:
Publisher:
release.yml on danaug23/harness-arena
-
Statement:
-
Statement type:
https://in-toto.io/Statement/v1 -
Predicate type:
https://docs.pypi.org/attestations/publish/v1 -
Subject name:
harness_arena-0.1.1-py3-none-any.whl -
Subject digest:
4deaed26f29c40d92c71b15dfd58020a1b8d6886ba1e6f7896c25be653532200 - Sigstore transparency entry: 2443762737
- Sigstore integration time:
-
Permalink:
danaug23/harness-arena@96d35fd5e0b9392593f74bd8d01cba02862e7c9d -
Branch / Tag:
refs/tags/v0.1.1 - Owner: https://github.com/danaug23
-
Access:
public
-
Token Issuer:
https://token.actions.githubusercontent.com -
Runner Environment:
github-hosted -
Publication workflow:
release.yml@96d35fd5e0b9392593f74bd8d01cba02862e7c9d -
Trigger Event:
push
-
Statement type:







