The classical time series heatmap plot extended with a mean profile and daily average and peaks.

Project description

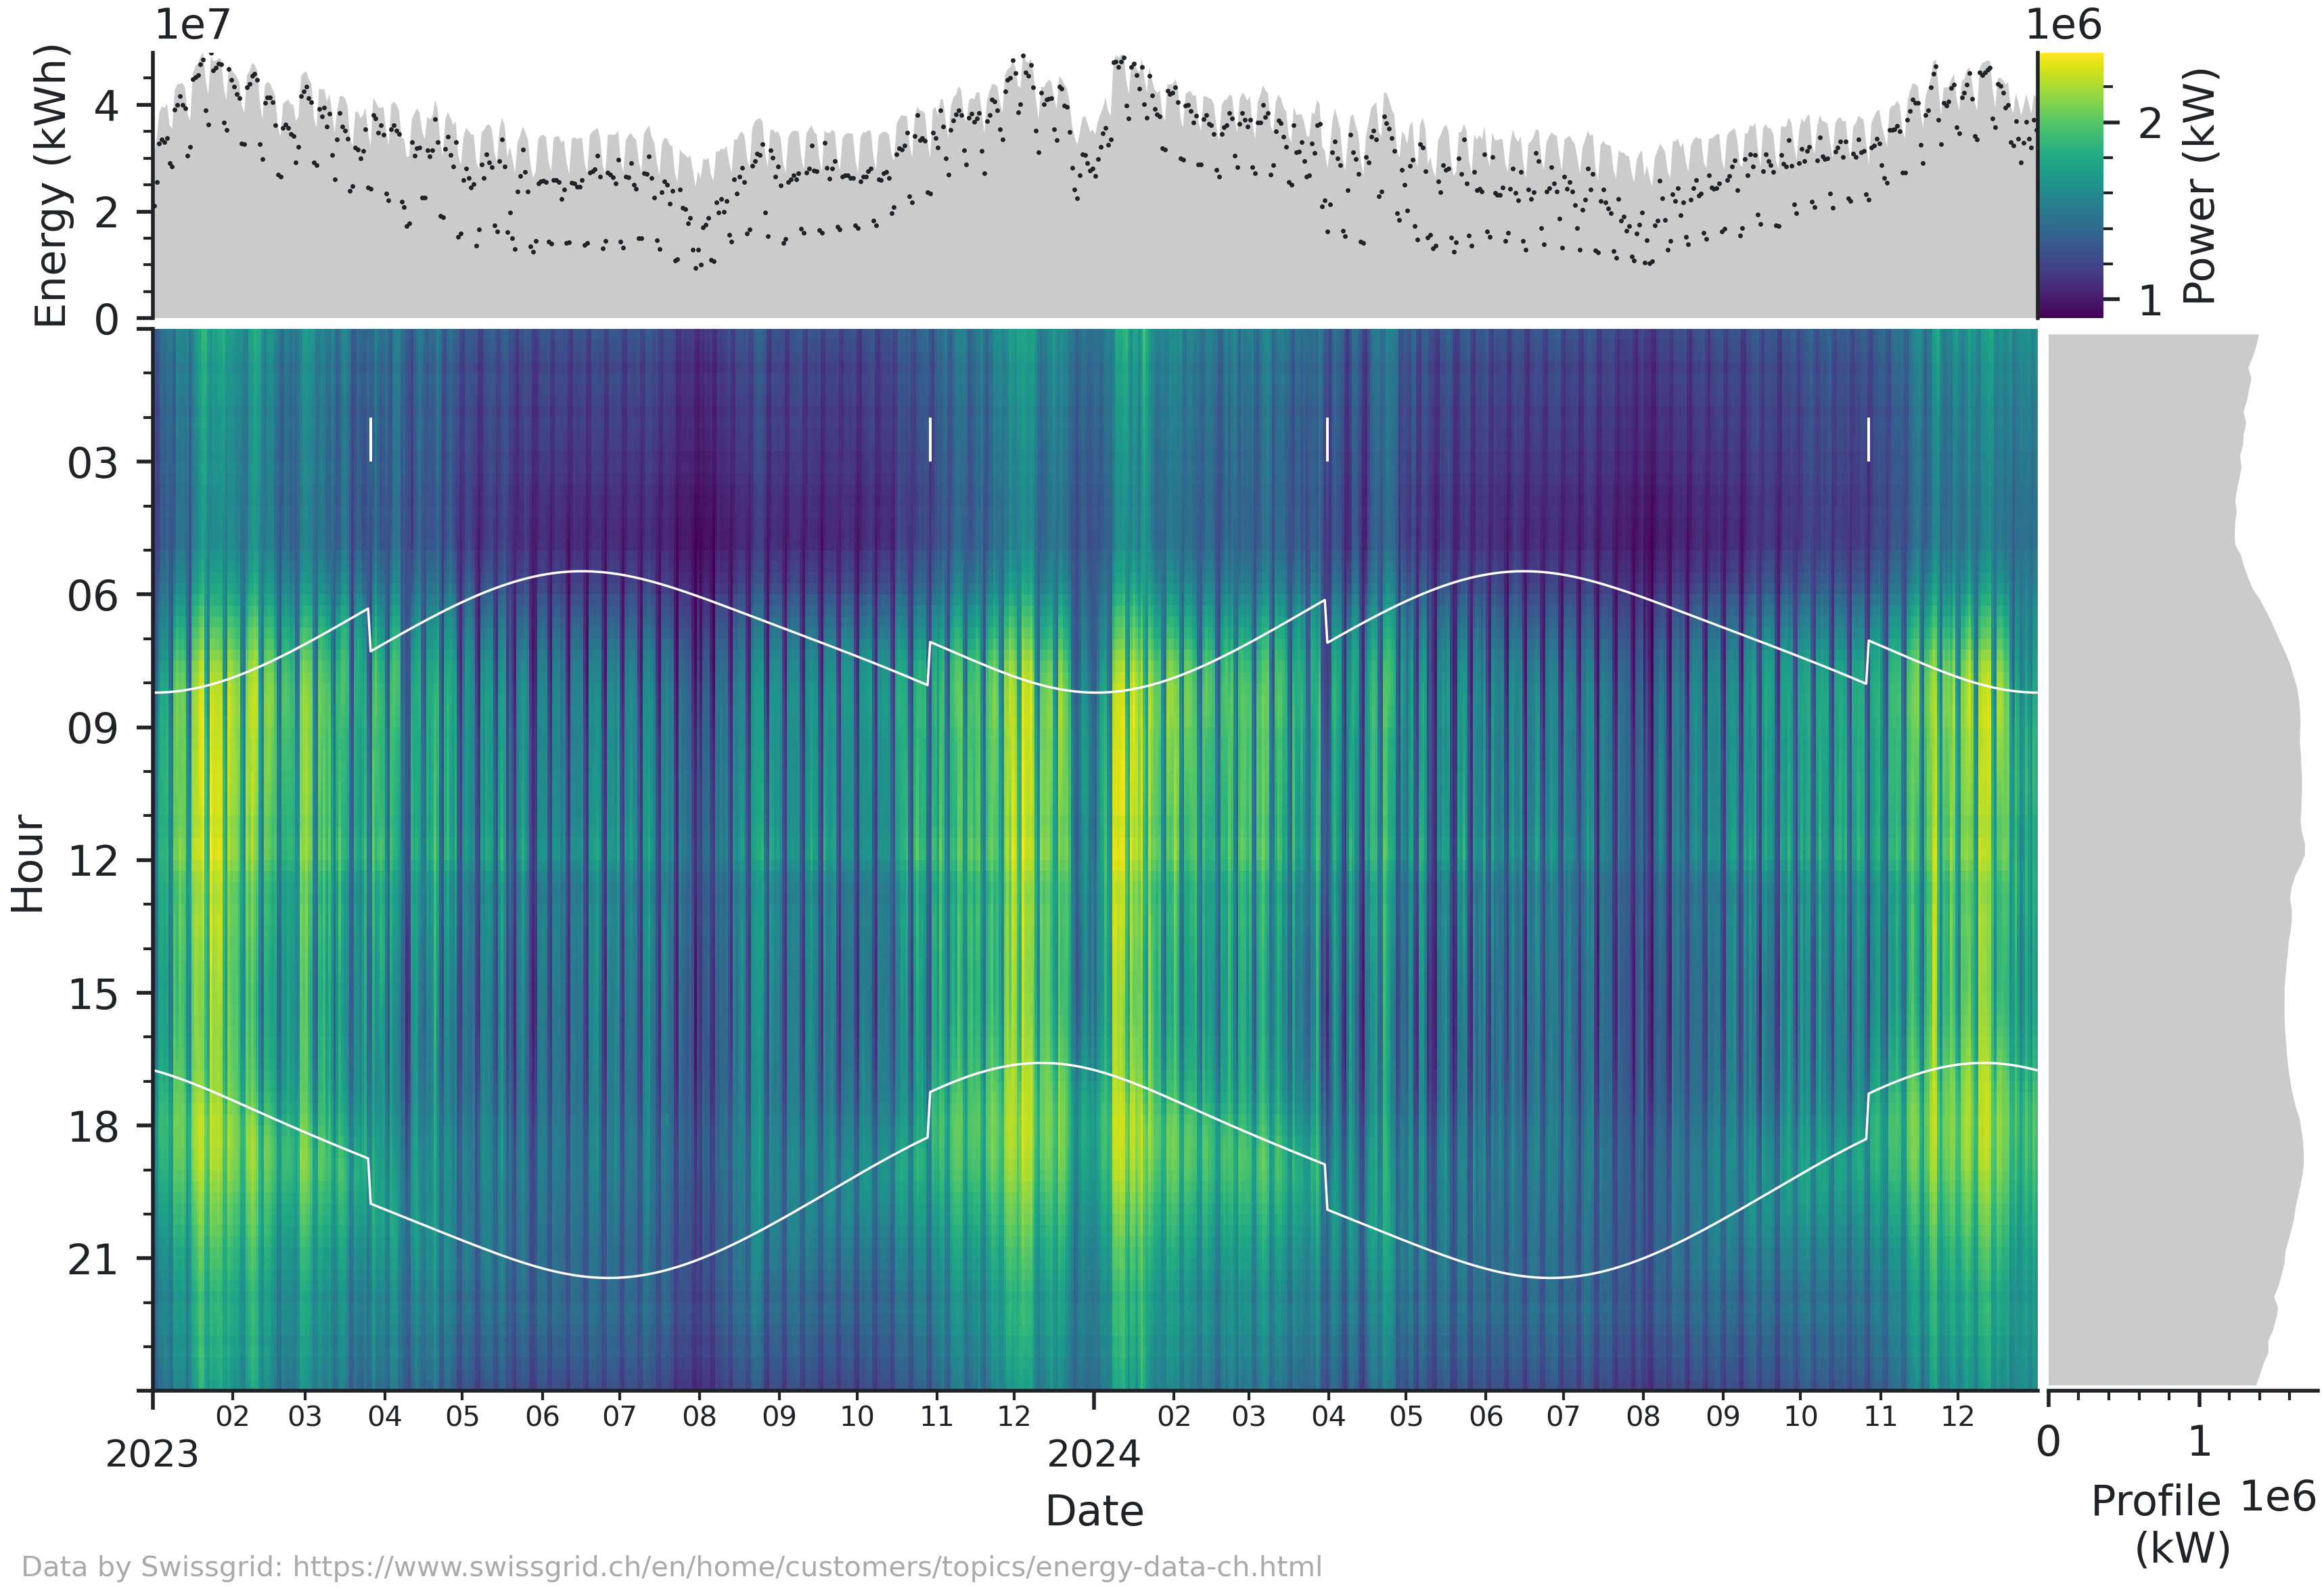
The classical time series heatmap plot extended with a mean profile and daily average and peaks. This type of visualization is very informative when showing large amounts of time series data. While I mostly use it for energy data, it can easily be adapted for any other time series. The figure works best for data with a range of a few months to a few years and a resolution of a few minutes to a few hours.
Installation
The package is available on PyPI:
pip install heatmapts
Alternatively, you can install it from GitHub:
pip install git+https://github.com/markus-kreft/heatmapts.git
or simply clone this repository and work in the local directory.
Usage
The module provides the heatmapfigure function that takes a pandas Series with a timezone-aware DatetimeIndex with frequency.
This example show how to load and prepare data from a csv file in the necessary way. This needs to be adapted depending on the format of the data at hand.
from heatmapts import heatmapfigure

# Read data
df = pd.read_csv('data.csv', index_col='Timestamp')
# Convert index to datetime and set timezone
df.index = pd.to_datetime(df.index, format='%Y-%m-%d %H:%M:%S').tz_convert('Europe/Zurich')
# Resample to 15 frequency
df = df.asfreq("15min", fill_value=pd.NA)
# Take data column and convert energy to power
series = df['Value'] * 4

fig = heatmapfigure(series, rasterized=True)
fig.savefig("plot.pdf")
Customization
The figure is designed for easy customization.
- Any additional keyword arguments are passed to pcolormesh, which is especially convenient for using a different colormap or norm or to use rasterization.
- Passing a tuple of latitude and longitude coordinates will add sunrise and sunset times to the plot.
fig = heatmapfigure(series, annotate_suntimes=(52.37, 4.90))
- The returned figure is subclassed from
matplotlib.figure.Figureand features additional attributes for the heatmap, colorbar, daily and hourly axes. These can be modified as any other matplotlib axis.
fig.ax_heatmap.xaxis.set_major_locator(mdates.YearLocator())
fig.ax_heatmap.xaxis.set_major_formatter(mdates.DateFormatter("%Y"))
- The figure uses its own rcParams for styling.
You can modify or overwrite the parameters on a class level.
When setting an empty rcParams dictionary, the current parameters from matplotlib (e.g., as determined by
matplotlibrc) will be used.
from heatmapts import HeatmapFigure
# Customize rc parameters
HeatmapFigure.rc_params["font.family"] = "serif"
HeatmapFigure.rc_params["font.size"] = 5

# Set empty rc parameters to use those from matplotlib
HeatmapFigure.rc_params = {}


Download files
Download the file for your platform. If you're not sure which to choose, learn more about installing packages.
Source Distribution
Built Distribution
Filter files by name, interpreter, ABI, and platform.
If you're not sure about the file name format, learn more about wheel file names.
Copy a direct link to the current filters
File details
Details for the file heatmapts-0.1.1.tar.gz.
File metadata
- Download URL: heatmapts-0.1.1.tar.gz
- Upload date:
- Size: 8.5 kB
- Tags: Source
- Uploaded using Trusted Publishing? Yes
- Uploaded via: uv/0.11.18 {"installer":{"name":"uv","version":"0.11.18","subcommand":["publish"]},"python":null,"implementation":{"name":null,"version":null},"distro":{"name":"Ubuntu","version":"24.04","id":"noble","libc":null},"system":{"name":null,"release":null},"cpu":null,"openssl_version":null,"setuptools_version":null,"rustc_version":null,"ci":true}
File hashes
| Algorithm | Hash digest | |
|---|---|---|
| SHA256 |
fb01a97181e08d3ae32a103799812c62619776a185d5dd34516512343ca6eab5
|
|
| MD5 |
d170c608b9aa2ddae0bf3094db908da1
|
|
| BLAKE2b-256 |
27eb4d2369ff9d7c64c19a72a1c7461e0f9bc2cb1b92f6e3a7baead1bbd1de06
|
File details
Details for the file heatmapts-0.1.1-py3-none-any.whl.
File metadata
- Download URL: heatmapts-0.1.1-py3-none-any.whl
- Upload date:
- Size: 9.9 kB
- Tags: Python 3
- Uploaded using Trusted Publishing? Yes
- Uploaded via: uv/0.11.18 {"installer":{"name":"uv","version":"0.11.18","subcommand":["publish"]},"python":null,"implementation":{"name":null,"version":null},"distro":{"name":"Ubuntu","version":"24.04","id":"noble","libc":null},"system":{"name":null,"release":null},"cpu":null,"openssl_version":null,"setuptools_version":null,"rustc_version":null,"ci":true}
File hashes
| Algorithm | Hash digest | |
|---|---|---|
| SHA256 |
78f37eaa2718d060e3de3022a05a4544f54e324e39e8404f182fe96eb7f37ac8
|
|
| MD5 |
a8c143c81e19a5e9ebad6b6a99e84c74
|
|
| BLAKE2b-256 |
26ecbc6214636ef1305f62dc82e9c8d8982b2ef283ce4ac2914b662b27a8f063
|


