Python-first report compiler that generates beautiful, portable, interactive React dashboards.

Project description

📊 HolySheet
Python-first report compiler that turns raw data into stunning,
interactive React dashboards — zero frontend knowledge required.


📖 Documentation • Screenshots • Quickstart • Installation • Block Reference • Examples • Architecture • Development
📸 See It In Action
Don't take our word for it — see what HolySheet generates:
🌙 Dark Theme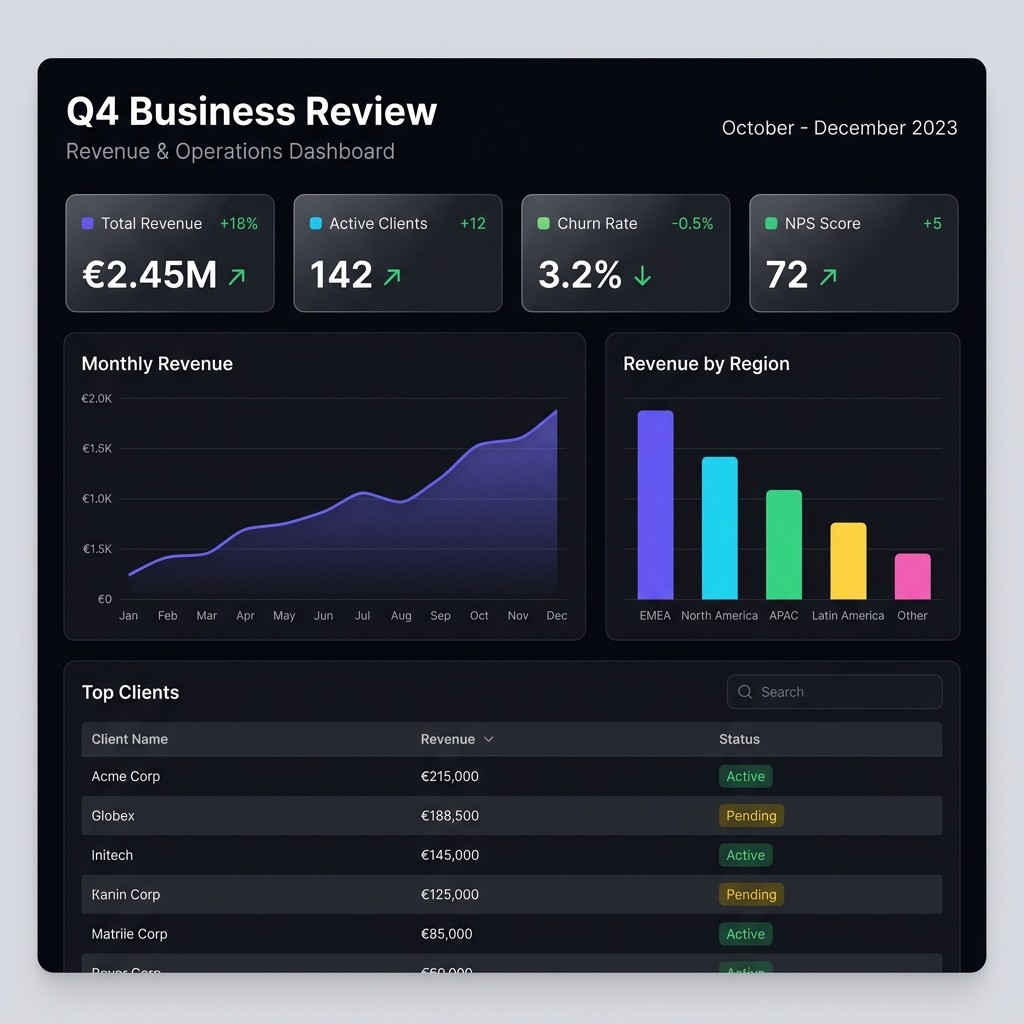
|
☀️ Light Theme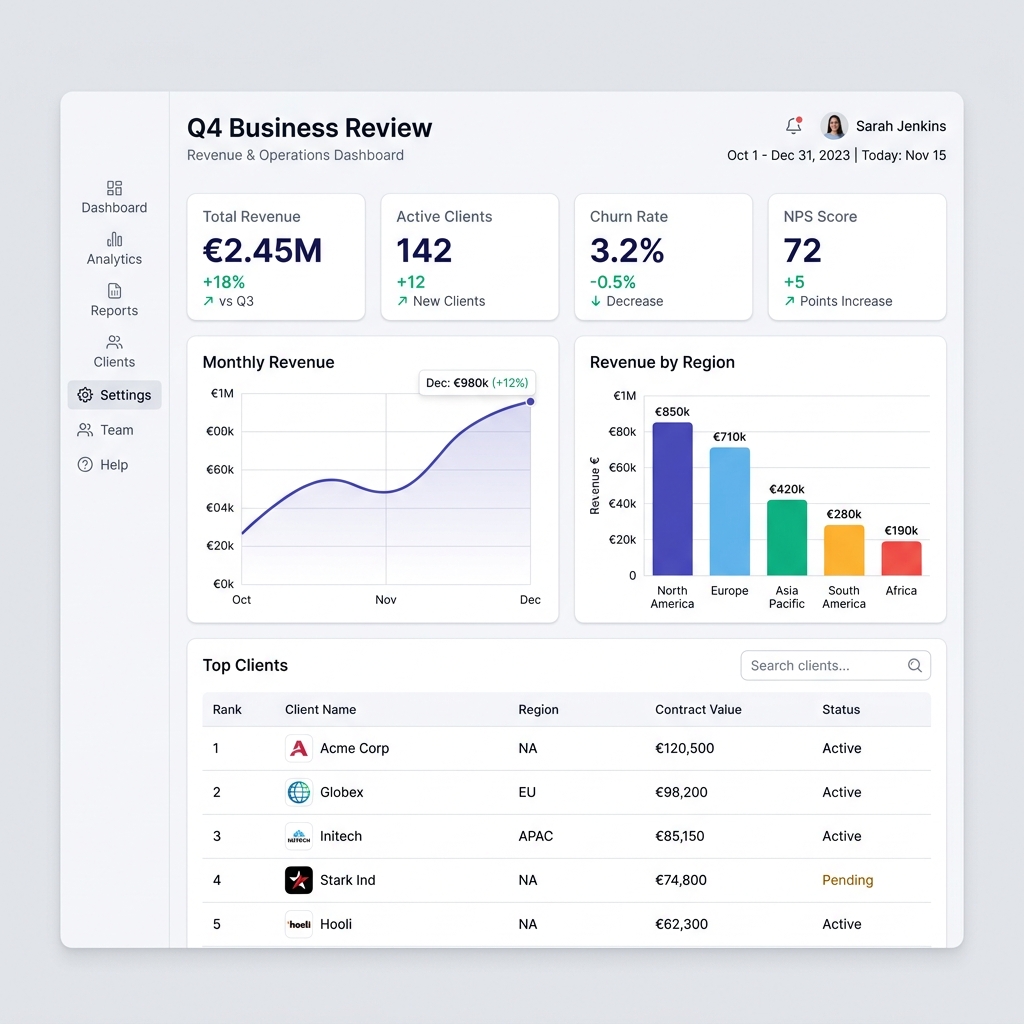
|
👔 Executive Theme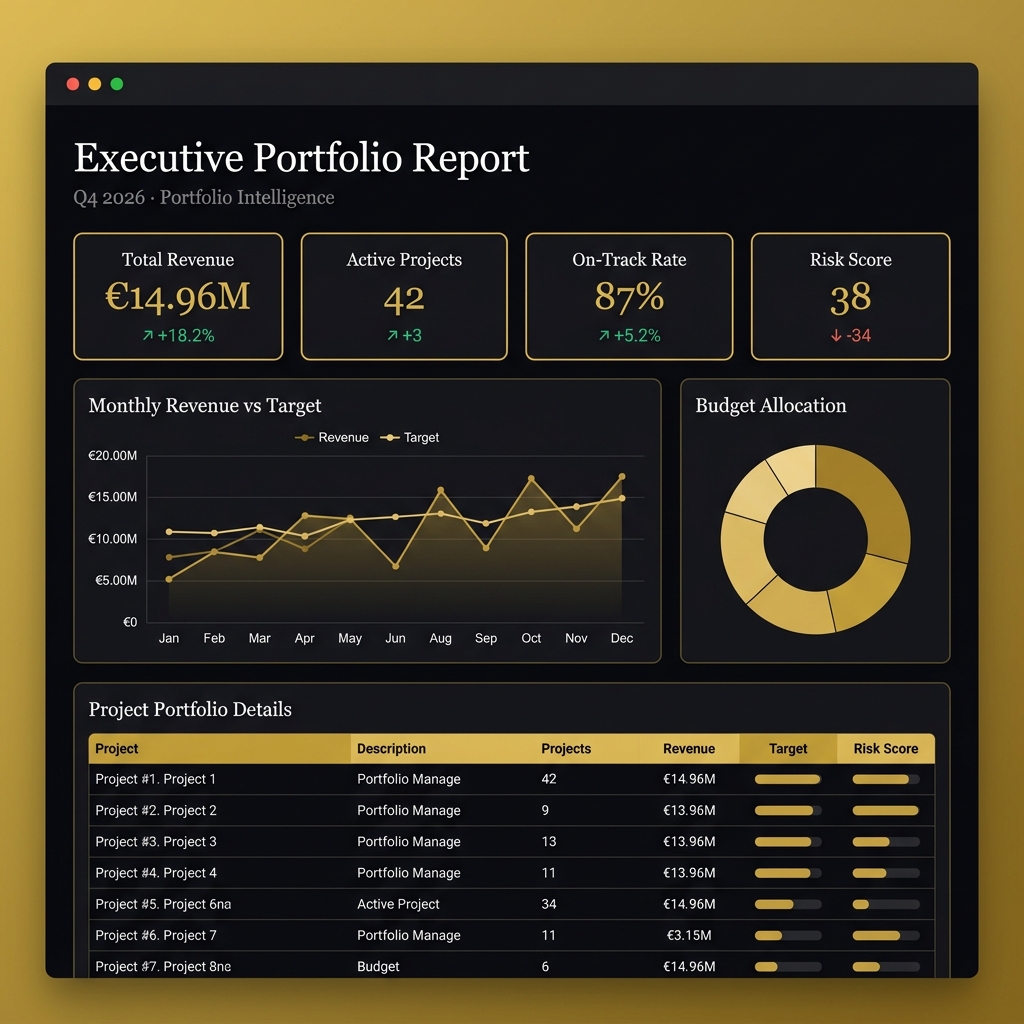
|
All dashboards above are generated from Python code — zero frontend knowledge required.
Each is a single, self-contained HTML file that opens in any browser.
📊 Basic Report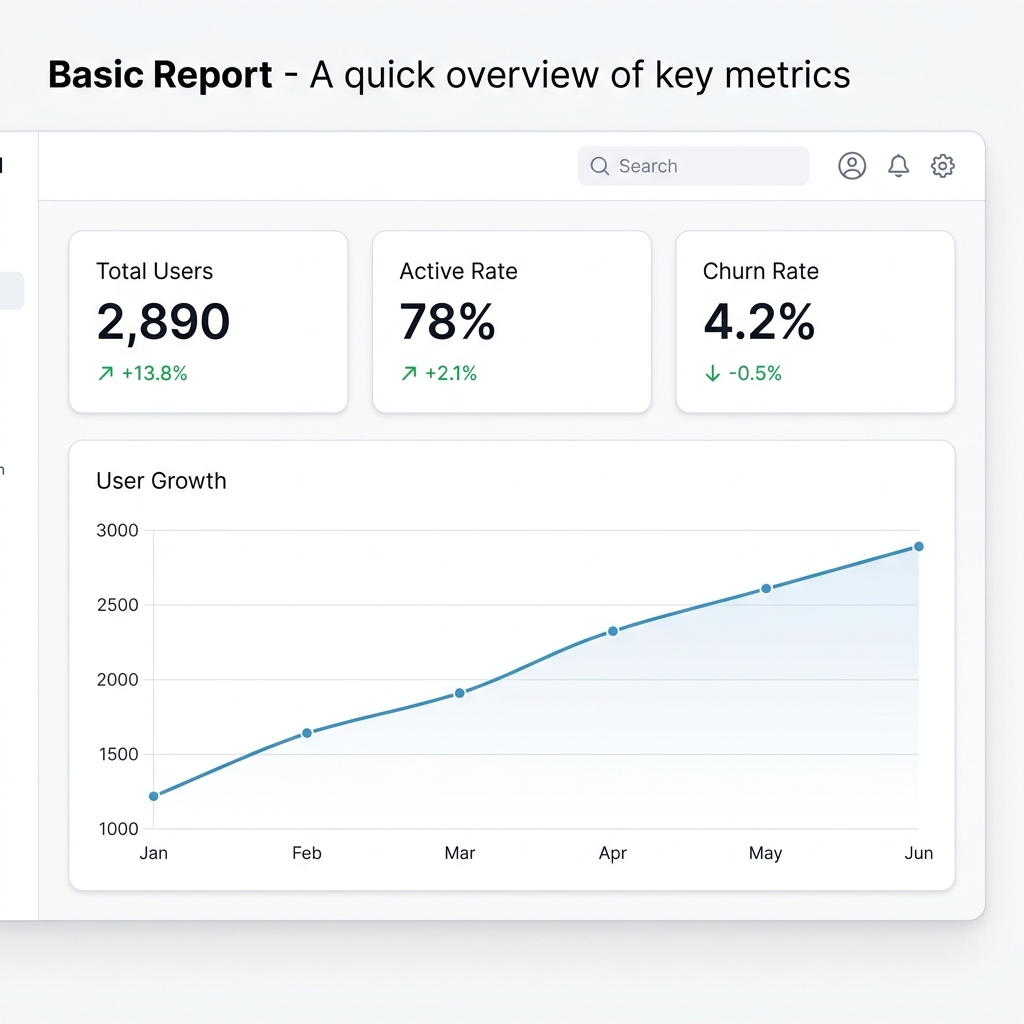 KPI cards + line chart · Light theme |
💼 Sales Analytics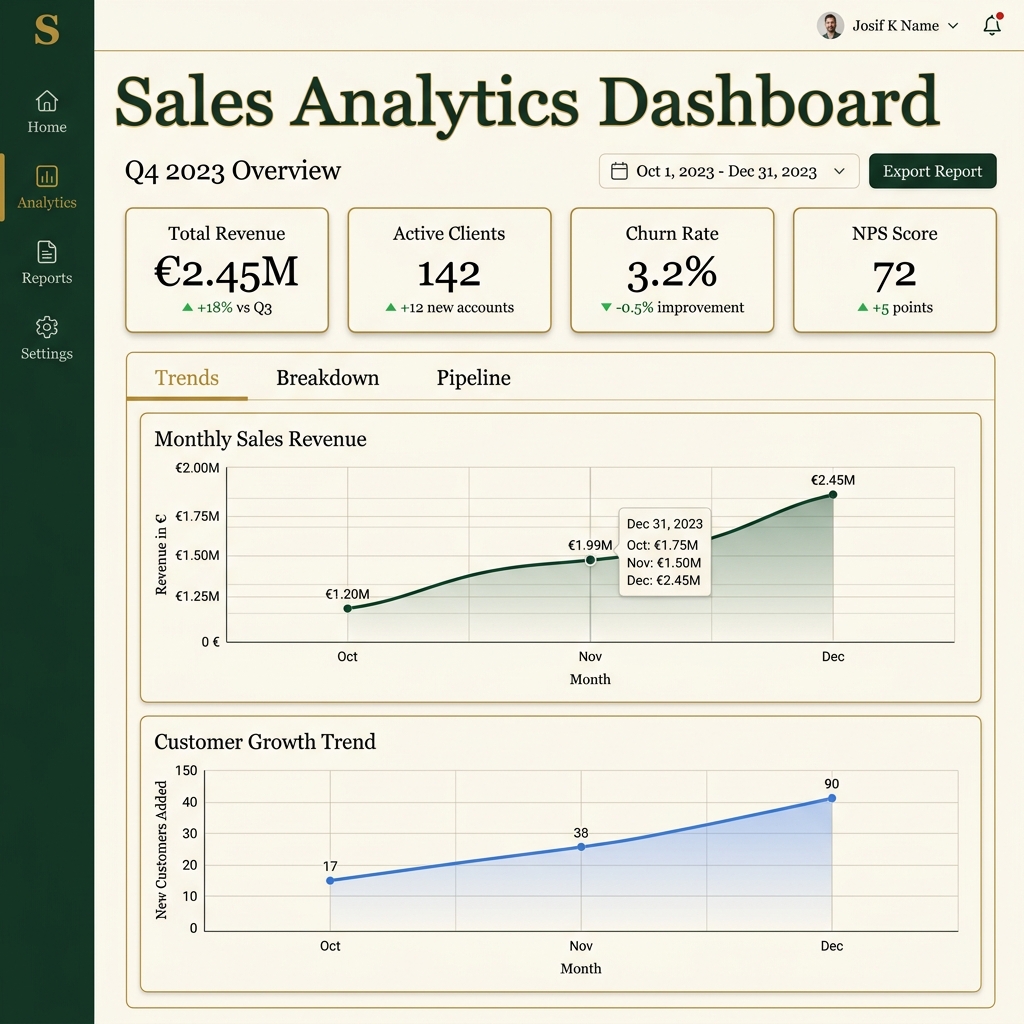 Tabbed charts + KPIs · Executive theme |
🏢 Portfolio Report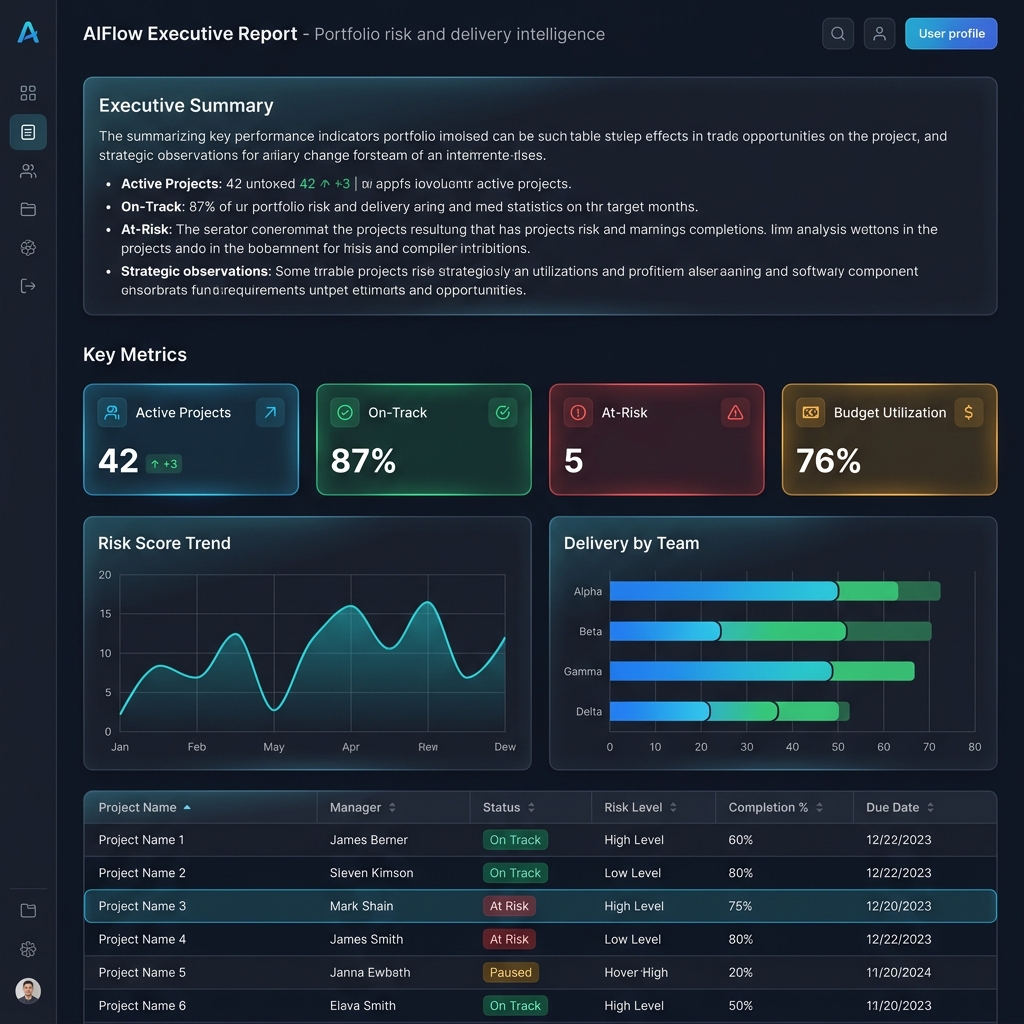 Columns layout + data table · Dark theme |
🚀 Full Showcase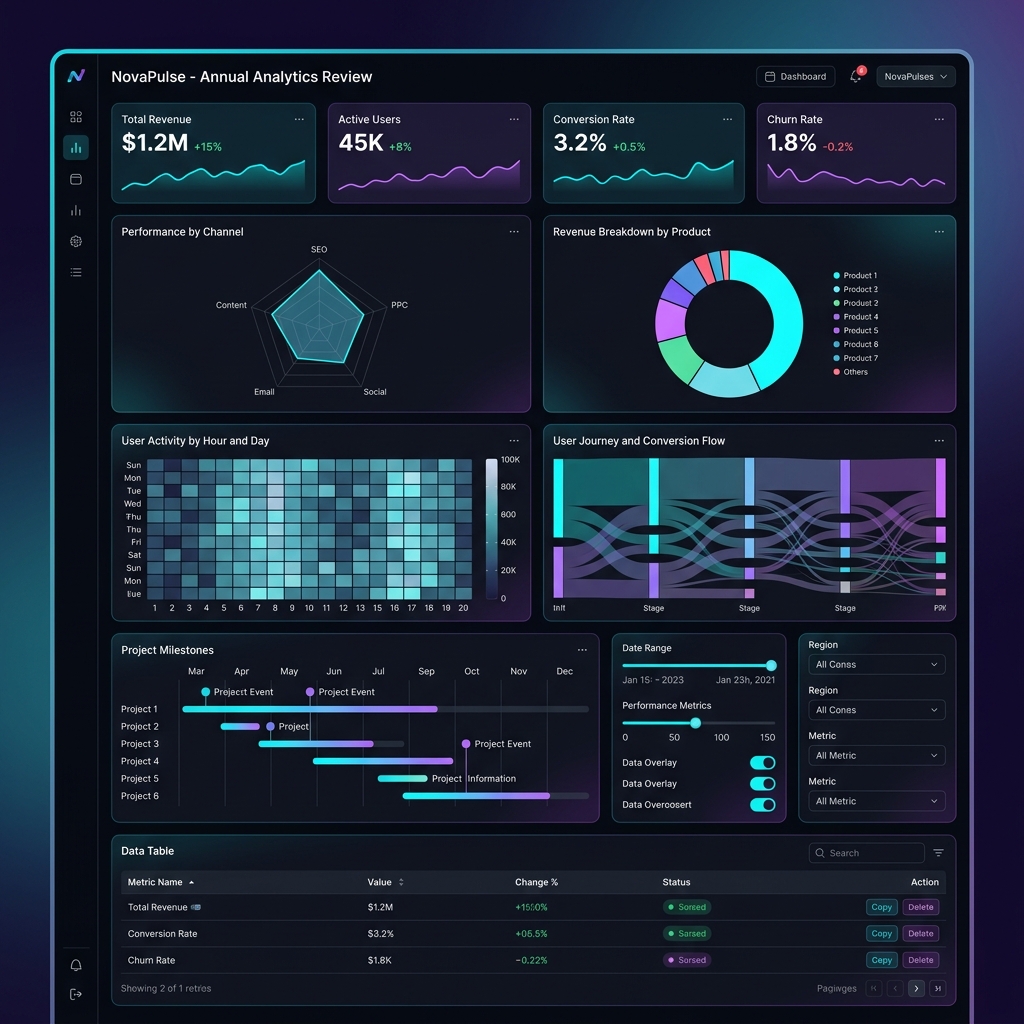 37 blocks, all chart types · Dark theme |
✨ What is HolySheet?
HolySheet generates stunning, self-contained, interactive HTML dashboards powered by React + Apache ECharts — without requiring Node.js, npm, or any frontend tooling.
Write your dashboard in Python. Get a gorgeous interactive report as a single HTML file.
No server. No dependencies. Just open it in a browser. Holy Sheet, that's easy!
⚡ Key Highlights
- 🧱 57 block types — 18 charts, 6 metrics, 14 content/data, 8 layout, 9 interactive, AI insights + SQL
- 🎨 3 premium themes — Dark, Light, and Executive with full design systems
- 📦 Single-file export — One
.htmlfile (~1.5 MB) with everything embedded - 🐼 Any data source — Pandas, Polars, dicts, lists, Google Sheets
- 🤖 AI-powered insights — OpenAI, Anthropic, Google Gemini integration
- 🔐 Enterprise features — Password protection, expiring reports, PDF export
- 🔧 Developer tools — CLI, hot-reload dev server, linting, report diff
- 📱 Responsive & PWA — Works on mobile, supports offline mode
from holysheet import Report, KPI, LineChart, DataTable

report = Report(title="Executive Portfolio Report", theme="dark")

report.add(KPI(label="Revenue", value=1_250_000, unit="€", delta="+12%", status="positive"))
report.add(LineChart(title="Revenue Trend", data=revenue_df, x="date", y="revenue"))
report.add(DataTable(title="Projects", data=projects_df))

report.export_html("report.html")  # ← That's it. Open in any browser.
🙏 Why HolySheet?
| 😩 The Problem | 😇 The HolySheet Way |
|---|---|
| Dashboards require complex frontend setup | Zero frontend knowledge needed |
| Reports need a running server | Self-contained HTML files — open anywhere |
| Visualization libraries produce basic charts | Enterprise-grade React UI with interactive ECharts |
| Sharing reports is painful | Single HTML file — email it, Slack it, embed it |
| Python-to-dashboard tools look dated | Modern Material UI design with dark/light/executive themes |
| Data wrangling across libraries | Native Pandas, Polars, dict, and list support |
🚀 Quickstart
1. Install
pip install holysheet
2. Build a dashboard
from holysheet import Report, KPI, LineChart, BarChart, PieChart, DataTable, Section

report = Report(
    title="Q4 Business Review",
    subtitle="Revenue & Operations Dashboard",
    theme="dark",
    author="Data Team",
)

# KPI cards — they auto-arrange in a responsive grid
report.add(KPI(label="Total Revenue", value=2_450_000, unit="€", delta="+18%", status="positive"))
report.add(KPI(label="Active Clients", value=142, delta="+12", status="positive"))
report.add(KPI(label="Churn Rate", value=3.2, unit="%", delta="-0.5%", status="positive"))
report.add(KPI(label="NPS Score", value=72, delta="+5", status="positive"))

# Charts — pass any DataFrame or list of dicts
report.add(LineChart(title="Monthly Revenue", data=revenue_data, x="month", y="revenue"))
report.add(BarChart(title="Revenue by Region", data=region_data, x="region", y="revenue"))
report.add(PieChart(title="Revenue Split", data=split_data, name="category", value="amount"))

# Searchable, paginated data table
report.add(DataTable(title="Top Clients", data=clients_data, columns=["name", "revenue", "status"]))

# Export → a single portable HTML file
report.export_html("q4_review.html")
3. Open & share
open q4_review.html   # macOS
xdg-open q4_review.html  # Linux
start q4_review.html  # Windows
The HTML file is fully standalone — no server, no internet, no Node.js. Send it via email, upload to S3, embed in Confluence — it just works.
📦 Installation
# Core (zero extras)
pip install holysheet

# With Pandas support
pip install holysheet[pandas]

# With PDF export
pip install holysheet[pdf]

# With AI insights (OpenAI / Anthropic / Google)
pip install holysheet[ai]

# With cloud publishing (S3 / GCS)
pip install holysheet[cloud]

# With Google Sheets data source
pip install holysheet[gsheets]

# Everything
pip install holysheet[all]
Requirements:
- 🐍 Python 3.11+
- 🚫 No Node.js required
- 🚫 No frontend build step
- 🚫 No running server
Core dependencies: pydantic v2 · jinja2 · orjson · loguru · click
🧱 Block Reference
HolySheet ships with 57 block types organized into seven categories.
🖼️ Block Preview — Charts & Data Tables
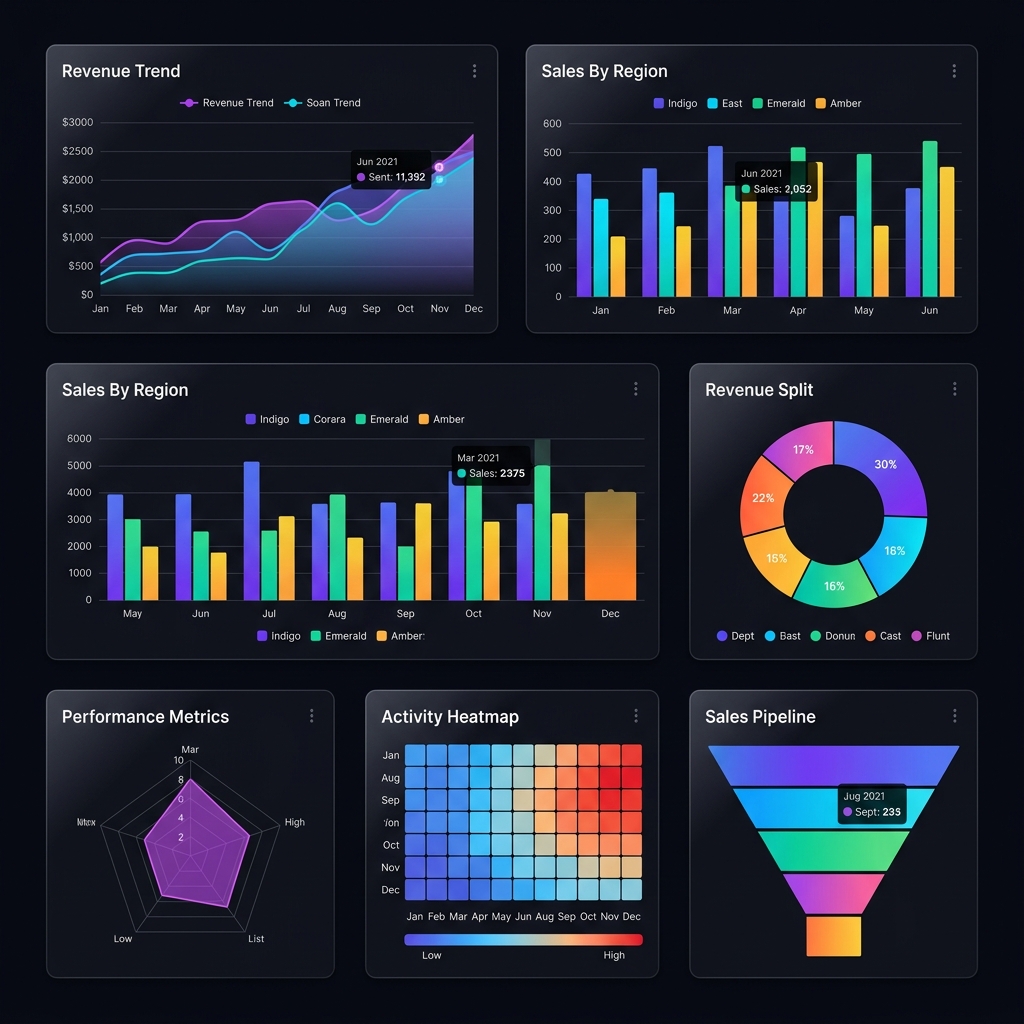 18 chart types: line, bar, pie, radar, heatmap, funnel, and more |
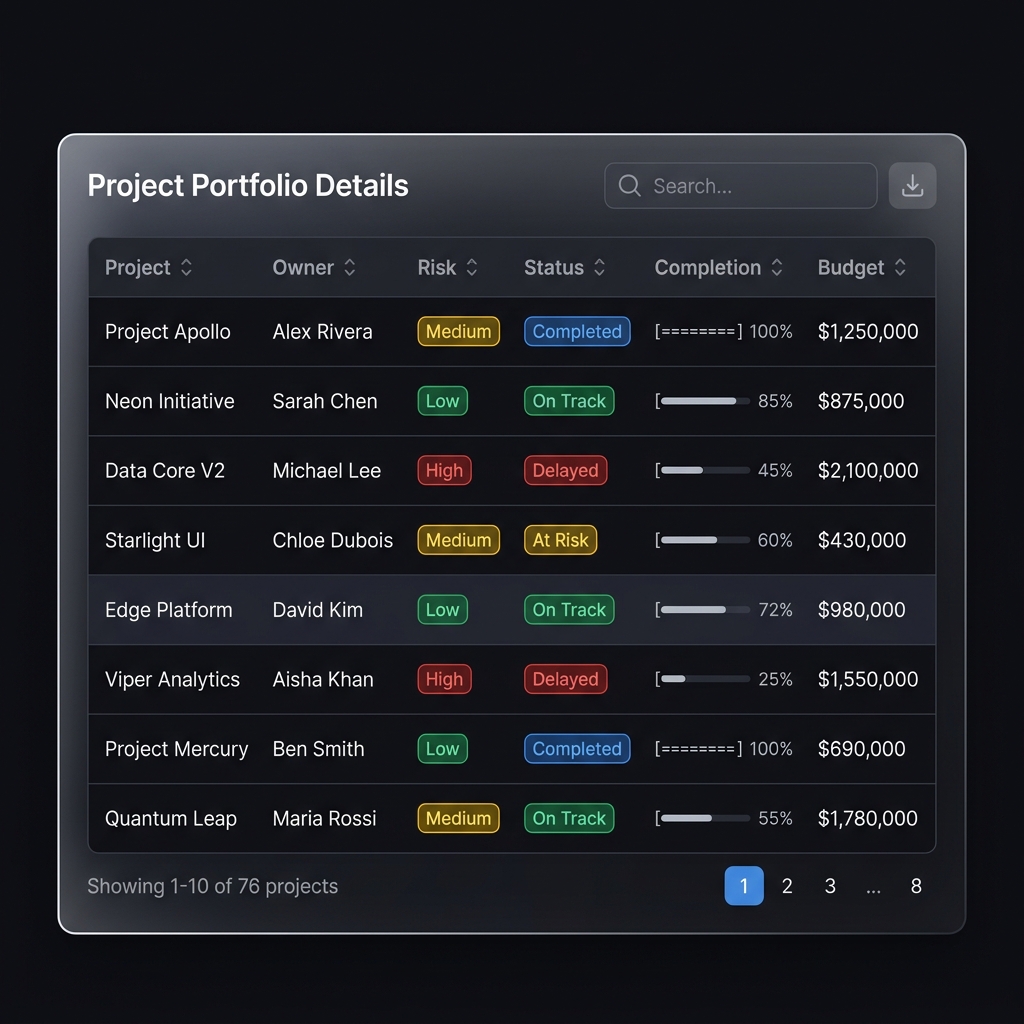 Interactive tables with search, sort, pagination & conditional formatting |
🖼️ Block Preview — KPI Cards Across Themes
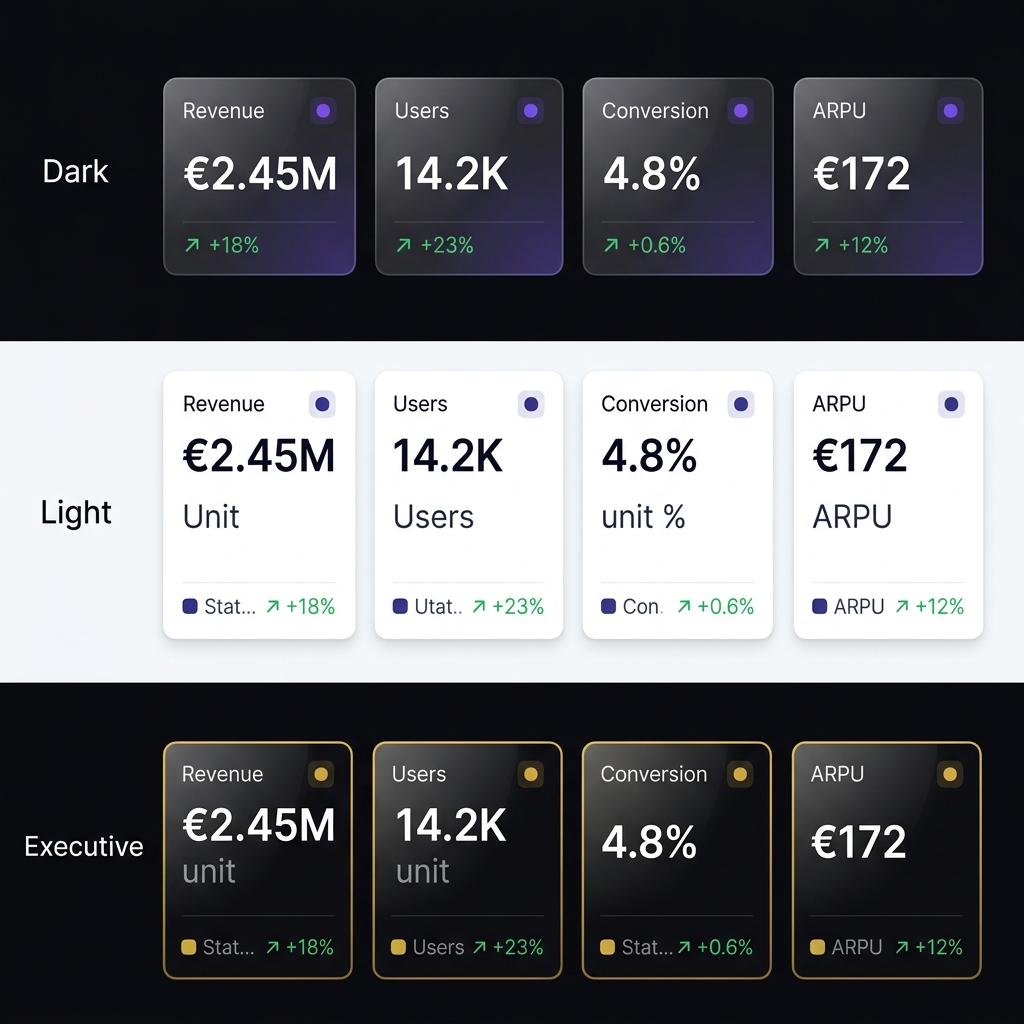
KPI cards automatically adapt to your chosen theme
📊 Charts (18)
| Block | Description | Key Props |
|---|---|---|
LineChart |
Multi-series line chart | data, x, y, series, annotations |
AreaChart |
Filled area chart | data, x, y, series, annotations |
BarChart |
Grouped/stacked bar chart | data, x, y, series, annotations |
PieChart |
Pie / donut chart | data, name, value |
ScatterChart |
Scatter / bubble plot | data, x, y, size, category |
RadarChart |
Radar / spider chart | data, indicators |
GaugeChart |
Speedometer gauge | value, min, max, thresholds |
FunnelChart |
Conversion funnel | data, name, value |
TreemapChart |
Hierarchical treemap | data, name, value, category |
HeatmapChart |
2D heatmap with color gradient | data, x, y, value |
CandlestickChart |
Financial OHLC chart | data, x, open, close, low, high |
SankeyChart |
Flow / energy diagram | nodes, links |
WaterfallChart |
Waterfall / bridge chart | data, category, value |
BoxPlotChart |
Statistical box plot | data, categories |
MapChart |
Geographical scatter | data, lat, lng, value, name |
GanttChart |
Project timeline 🆕 | tasks [{name, start, end, progress}] |
DAGChart |
Directed acyclic graph 🆕 | nodes, edges, layout |
CorrelationMatrix |
Correlation heatmap 🆕 | matrix, labels |
🧠 AI & Data Sources (3)
| Block | Description | Key Props |
|---|---|---|
AIInsight |
LLM-powered data narrative 🆕 | data, provider, prompt, api_key |
GoogleSheet |
Google Sheets data source 🆕 | spreadsheet_id, sheet_name, range |
SqlBlock |
Client-side SQL queries 🆕 | query, data, output |
📈 Metrics (6)
| Block | Description | Key Props |
|---|---|---|
KPI |
Key metric card with delta + tooltips | label, value, unit, delta, status, tooltip_detail |
Metric |
Compact inline metric | label, value, unit, icon |
ProgressBar |
Progress indicator | label, value, max, color |
StatComparison |
Side-by-side comparison | title, items |
Scorecard |
Conditional color metric grid 🆕 | data, columns, thresholds |
DataProfile |
Auto-EDA summary cards 🆕 | columns [{name, dtype, count, ...}] |
📝 Content (12)
| Block | Description | Key Props |
|---|---|---|
DataTable |
Searchable table + conditional formatting | data, columns, formatting, downloadable |
Markdown |
Rich text content | content |
CodeBlock |
Syntax-highlighted code | code, language, title |
Image |
Image display | src, alt, caption |
Alert |
Callout / notification | severity, title, message |
Timeline |
Vertical event timeline | events [{date, title, description}] |
Callout |
Styled quote / highlight | content, author, variant |
JsonViewer |
Interactive JSON tree | data, collapsed_depth |
UserCard |
Team member card | name, role, avatar_url, stats |
StatusList |
Status indicators list | items [{label, status, value}] |
InfoList |
Key-value pair display | items [{key, value, icon}] |
Sparkline |
Tiny inline chart | data, color, show_area |
NarrationBlock |
Voice narration (Web Speech API) 🆕 | text, autoplay |
📐 Layout (8)
| Block | Description | Key Props |
|---|---|---|
Section |
Group blocks with a heading | title, description, children |
Columns |
Multi-column responsive grid | children, widths |
Tabs |
Tabbed content panels | tabs (list of {label, children}) |
Divider |
Visual separator line | label, variant |
Accordion |
Collapsible content panels | panels (list of {title, children}) |
Stepper |
Process / wizard steps | steps [{label, description, status}] |
TagList |
Colored tag/badge chips | tags [{label, color}] |
Compare |
Side-by-side comparison layout 🆕 | left_label, right_label, left_children, right_children |
🎮 Interactive (9)
| Block | Description | Key Props |
|---|---|---|
Slider |
Range slider input | label, min, max, default_value |
NumberInput |
Numeric input field | label, default_value, step |
Toggle |
On/off switch | label, default_value |
Dropdown |
Select from options | label, options, default_value |
TextInput |
Text / textarea input | label, placeholder, multiline |
CheckboxGroup |
Multiple checkboxes | label, options, default_values |
RadioGroup |
Single-select radio buttons | label, options, default_value |
Embed |
Iframe embed | url, height, aspect_ratio |
Video |
HTML5 video player | src, poster, controls |
🎨 Themes
Three built-in themes ship out of the box:
report = Report(title="Report", theme="dark")       # 🌙 Deep dark, vibrant accents
report = Report(title="Report", theme="light")      # ☀️ Clean, professional, airy
report = Report(title="Report", theme="executive")  # 👔 Premium serif with rich greens
Each theme defines a complete design system: colors, typography (Inter / Georgia), spacing, shadows, and an 8-color chart palette.
|
🌙 Dark Glassmorphism cards, vibrant accents Ideal for internal dashboards |
☀️ Light Clean, professional, print-ready Ideal for client-facing reports |
👔 Executive Gold accents, serif typography Ideal for board presentations |
📚 Examples
Minimal Status Page
from holysheet import Report, KPI, Markdown, Alert

report = Report(title="System Status", theme="dark")

report.add(Alert(severity="success", title="All Systems Operational", message="Last checked: 2 minutes ago"))
report.add(KPI(label="Uptime", value=99.97, unit="%", status="positive"))
report.add(KPI(label="Response Time", value=142, unit="ms", status="neutral"))
report.add(KPI(label="Error Rate", value=0.03, unit="%", delta="-0.01%", status="positive"))
report.add(Markdown(content="Monitored endpoints: **API**, **Auth**, **CDN**, **Database**"))

report.export_html("status.html")
Executive Dashboard with Sections & Columns
from holysheet import Report, KPI, LineChart, BarChart, DataTable, Section, Columns, Markdown

report = Report(
    title="AIFlow Executive Report",
    subtitle="Portfolio risk and delivery intelligence",
    theme="executive",
    author="Strategy Team",
)

# Executive summary
report.add(Markdown(content="""
## Executive Summary

Portfolio health remains strong with 42 active projects delivering on schedule.
Risk-adjusted returns are trending positively, with a 12% improvement in delivery confidence.
"""))

# Note: Variables like risk_df, team_df, projects_df should be your DataFrames

# KPI grid inside a section
report.add(Section(
    title="Key Metrics",
    children=[
        KPI(label="Active Projects", value=42, delta="+3", status="positive"),
        KPI(label="On-Track", value=87, unit="%", status="positive"),
        KPI(label="At-Risk", value=5, status="negative"),
        KPI(label="Budget Utilization", value=76, unit="%", status="neutral"),
    ],
))

# Side-by-side charts
report.add(Columns(children=[
    LineChart(title="Risk Score Trend", data=risk_df, x="date", y="score"),
    BarChart(title="Delivery by Team", data=team_df, x="team", y="delivered"),
]))

# Detailed data
report.add(DataTable(
    title="Project Details",
    data=projects_df,
    columns=["project", "owner", "risk", "status", "completion"],
))

report.export_html("executive_report.html")
Multi-Chart Analytics with Tabs
from holysheet import Report, Tabs, LineChart, BarChart, PieChart, FunnelChart

report = Report(title="Sales Analytics", theme="dark")

report.add(Tabs(tabs=[
    {
        "label": "📈 Trends",
        "children": [
            LineChart(title="Monthly Sales", data=sales_df, x="month", y="total"),
            LineChart(title="Customer Growth", data=growth_df, x="month", y="customers"),
        ],
    },
    {
        "label": "📊 Breakdown",
        "children": [
            BarChart(title="Sales by Region", data=region_df, x="region", y="sales"),
            PieChart(title="Product Mix", data=product_df, name="product", value="revenue"),
        ],
    },
    {
        "label": "🔄 Pipeline",
        "children": [
            FunnelChart(title="Sales Funnel", data=funnel_df, name="stage", value="count"),
        ],
    },
]))

report.export_html("sales_analytics.html")
🖼️ Example Output — Sales Dashboard (Executive Theme)
Generated by examples/sales_dashboard.py — a single self-contained HTML file
💡 More examples in the
examples/directory — including a full showcase with every block type.
📤 Export Modes
Standalone HTML (default)
report.export_html("report.html")
Generates a single, self-contained HTML file (~1.5 MB) with embedded React, CSS, and data. Zero external dependencies. Open directly in any browser.
Folder Export
report.export_folder("dist/")
Generates a deployable folder structure:
dist/
  index.html       ← Entry point
  assets/
    app.js         ← React bundle
    app.css        ← Styles
  report.json      ← Dashboard spec
Ideal for hosting on a web server, S3, or CDN.
PDF Export
report.export_pdf("report.pdf", landscape=True, margin="0.5in")
Requires Playwright (pip install holysheet[pdf]) or Chrome/Chromium.
JSON Export
report.export_json("report.json")
Exports just the dashboard specification as JSON. Useful for debugging, version control, or feeding into external rendering pipelines.
🗄️ Data Formats
HolySheet auto-detects and converts data from multiple formats:
# ✅ List of dicts
data = [{"name": "Alice", "score": 95}, {"name": "Bob", "score": 87}]

# ✅ Dict of lists
data = {"name": ["Alice", "Bob"], "score": [95, 87]}

# ✅ Pandas DataFrame
import pandas as pd
data = pd.DataFrame({"name": ["Alice", "Bob"], "score": [95, 87]})

# ✅ Polars DataFrame
import polars as pl
data = pl.DataFrame({"name": ["Alice", "Bob"], "score": [95, 87]})
All formats are normalized to records internally via holysheet.data.to_records().
💻 CLI
# Validate a report spec
holysheet validate report.json

# Serve a report locally (opens browser)
holysheet serve report.json

# Hot-reload dev server — auto-refreshes on Python script changes
holysheet dev my_report.py --port 8000

# Lint a report for best practices
holysheet lint my_report.py --strict

# Compare two report versions
holysheet diff old_report.json new_report.json

# Show version
holysheet version

# Publish to S3 or Google Cloud Storage
holysheet publish report.html -t s3://my-bucket/reports/q4.html --public
holysheet publish report.html -t gs://my-bucket/reports/q4.html
🔥 Advanced Features
Custom Themes
from holysheet import Report, Theme

brand = Theme(name="acme", primary="#FF6B00", background="#0A0A0F", font="Satoshi")
report = Report(title="Acme Report", theme=brand)
Multi-Page Reports
report.add_page("Overview", [KPI(label="Revenue", value="$1.2M")])
report.add_page("Details", [DataTable(title="Breakdown", data=df)])
Chart Annotations
report.add(LineChart(
    title="Revenue", data=df, x="month", y="revenue",
    annotations=[{"x": "Mar", "text": "Product Launch", "color": "#22d3ee"}]
))
Global Filters
report.add_filter("region", type="dropdown", options=["NA", "EU", "APAC"])
Jupyter Integration
report.show() # Renders inline in Jupyter notebook
Password Protection & Expiry
report.export_html("secure.html", password="s3cret")  # AES-256 encrypted
Report(title="Temp", expires="2025-12-31")  # Auto-expires
Report Templates
from holysheet.templates import SalesDashboard, ExecutiveSummary, OpsMonitor

blocks = SalesDashboard(data={"kpis": {"revenue": "$1.2M", "deals_won": 42}})
Anomaly Detection
report.add(LineChart(
    title="Server Latency", data=metrics, x="time", y="latency_ms",
    anomaly_detection=True,  # Auto-detect and annotate outliers
))
AI-Powered Insights
from holysheet import AIInsight
report.add(AIInsight(title="Key Findings", data=df, provider="openai"))
SQL Block
from holysheet import SqlBlock
report.add(SqlBlock(
    query="SELECT region, SUM(revenue) FROM data GROUP BY region",
    data=sales_df,
))
Voice Narration
from holysheet import NarrationBlock
report.add(NarrationBlock(text=report.auto_narrate()))
🏗️ Architecture
Python API → Pydantic v2 Schema → JSON Spec → React Renderer → HTML Dashboard
HolySheet operates in two distinct phases:
🔧 Build Time (Python — your machine)
- You define blocks using the Python API
- HolySheet validates everything with Pydantic v2 models
- Generates a versioned JSON dashboard specification
- Injects the spec into a prebuilt React application
- Exports a self-contained HTML file via Jinja2 templates
🌐 Runtime (Browser — any machine)
- Browser opens the HTML file (no server needed)
- React reads the embedded dashboard spec from
<script id="report-data"> - Renders each block through a component registry (
type→ React component) - Charts become interactive via Apache ECharts
- Tables support real-time search and pagination
The key insight: The React app is prebuilt and bundled inside the Python package. End users never need Node.js, npm, or any frontend tooling.
Project Structure
HolySheet/
  src/holysheet/           # Python package
    __init__.py            #   Public API (20 block types + Report)
    blocks.py              #   Pydantic v2 block models
    schema.py              #   Report schema model
    report.py              #   Main Report class + export methods
    data.py                #   Data normalization (pandas/polars/dict/list)
    exporters.py           #   HTML / folder / JSON exporters
    themes.py              #   Theme system (light / dark / executive)
    exceptions.py          #   Custom exception hierarchy
    cli.py                 #   Click-based CLI (validate, serve, version)
    renderer/              #   Prebuilt React assets (JS + CSS)
    templates/             #   Jinja2 HTML templates

  frontend/                # React source (development only)
    src/
      components/          #   React block components
      theme.ts             #   MUI theme definitions
      registry.tsx         #   Block type → component mapping
      types.ts             #   TypeScript interfaces

  tests/                   # Python test suite
  examples/                # Example scripts
🛠️ Development
Prerequisites
- Python 3.11+
- Node.js 18+ (frontend development only)
- Make
Setup
git clone https://github.com/UnicoLab/HolySheet.git
cd HolySheet

# Full development setup (frontend + Python)
make dev

# Or step by step:
make frontend-install   # Install frontend npm dependencies
make frontend-build     # Build React app → src/holysheet/renderer/
make install            # Install Python package in editable mode
Common Commands
make test              # Run Python test suite
make lint              # Lint with ruff
make typecheck         # Type-check with mypy (strict mode)
make format            # Auto-format with ruff
make build             # Build distributable wheel + sdist
make clean             # Clean all build artifacts
Releases
HolySheet uses python-semantic-release with conventional commits:
| Prefix | Effect |
|---|---|
feat: |
Minor version bump |
fix: / perf: |
Patch version bump |
BREAKING CHANGE: |
Major version bump |
🗺️ Roadmap
- 📊 Advanced chart types (Sankey, Gantt, DAG, Correlation Matrix)
- 🔍 Interactive filters and global filter bar
- 📑 Multi-page tabbed report navigation
- 🎨 Custom theme API + enterprise branding
- 🔐 Password-protected & expiring reports
- 📥 CSV download buttons on tables & charts
- 📓 Jupyter notebook integration
- 🎯 Chart annotations (vertical lines, point markers)
- 📽️ Presentation mode (sections as slides)
- 🌗 Dark/Light theme toggle in viewer
- 🏗️ Report templates (SalesDashboard, ExecutiveSummary, OpsMonitor)
- 🔧 Hot-reload dev server + report linting + report diff CLI
- 🤖 AI narrative blocks (AIInsight with OpenAI / Anthropic / Google)
- 📄 PDF export (Playwright / Chrome)
- 🗄️ SQL Block (client-side query engine)
- 🔊 Voice narration (Web Speech API)
- 📈 Anomaly detection on charts (IQR + MAD)
- ☁️ Cloud publish CLI (S3 / GCS)
- 📊 Google Sheets data source
- 🔄 Cross-block reactive filtering
- 📜 Virtual scrolling for large tables
- 🗺️ Report navigator (minimap)
- 📱 PWA mode + responsive layouts
- 📊 PowerPoint export
- 🧩 Custom React component injection
- 💬 Local chatbot over report data
🤝 Contributing
Contributions are welcome! Here's how to get started:
- Fork the repository
- Create a feature branch:
git checkout -b feat/amazing-feature - Write your changes with tests
- Check everything passes:
make lint && make typecheck && make test - Commit with conventional commits:
feat:,fix:,docs:, etc. - Open a Pull Request
See the Contributing Guide for detailed instructions.
📄 License
MIT License — see LICENSE for details.
Built with ❤️ by UnicoLab
Holy Sheet, that's a beautiful dashboard! 🙌
PyPI · Documentation · Issues · Discussions
Release history Release notifications | RSS feed


Download files
Download the file for your platform. If you're not sure which to choose, learn more about installing packages.
Source Distribution
Built Distribution
Filter files by name, interpreter, ABI, and platform.
If you're not sure about the file name format, learn more about wheel file names.
Copy a direct link to the current filters
File details
Details for the file holysheet-1.0.0.tar.gz.
File metadata
- Download URL: holysheet-1.0.0.tar.gz
- Upload date:
- Size: 12.5 MB
- Tags: Source
- Uploaded using Trusted Publishing? No
- Uploaded via: twine/6.2.0 CPython/3.12.13
File hashes
| Algorithm | Hash digest | |
|---|---|---|
| SHA256 |
d0d56b374a5aa18815423f373644907c352721311e281b9c7fea10942d7cb372
|
|
| MD5 |
967b4fbf2b381338bccdc6250b333160
|
|
| BLAKE2b-256 |
fc98e78caebed514c63dcc35ae109cd98ccb0f8e7737e74d581fff35963922a5
|
File details
Details for the file holysheet-1.0.0-py3-none-any.whl.
File metadata
- Download URL: holysheet-1.0.0-py3-none-any.whl
- Upload date:
- Size: 627.7 kB
- Tags: Python 3
- Uploaded using Trusted Publishing? No
- Uploaded via: twine/6.2.0 CPython/3.12.13
File hashes
| Algorithm | Hash digest | |
|---|---|---|
| SHA256 |
f26bd6d5081590ab0cd55bef5b3b95f459a28f9a6e808686612dcd89e57ed9ee
|
|
| MD5 |
c034e6683dc3bdf728b01bdaa9d4ed57
|
|
| BLAKE2b-256 |
161efaa5cb789927184d3e828ec1a207cb3af3011c6e56163ceea92954f3bc12
|


