








hrosailing
![Still in development. In particular we do not guarantee backwards compatibility to the versions 0.x.x.]!
The hrosailing package provides various tools and interfaces to
visualize, create and work with polar (performance) diagrams.
The main interface being the PolarDiagram interface for
the creation of custom polar diagrams, which is compatible with
the functionalities of this package. hrosailing also provides some
pre-implemented classes inheriting from PolarDiagram which can be used as well.
The package contains a data processing framework, centered around the
PolarPipeline class, to generate polar diagrams from raw data.
pipelinecomponents provides many out of the box parts for
the aforementioned framework as well as the possibility to easily
create own ones.
The package also provides many navigational usages of polar
(performance) diagrams with cruising.
You can find the documentation here. See also the examples below for some showcases.
Installation



The recommended way to install hrosailing is with
pip:
pip install hrosailing
It has the following dependencies:
numpyversion 1.22.0scipyversion 1.9.1matplotlibversion 3.4.3
For some features it might be necessary to also use:
pynmea2version 1.18.0pandasversion 1.3.3netCDF4version 1.6.1meteostatversion 1.6.5
The hrosailing package might also be compatible (in large) with
other versions of Python, together with others versions of some
of the used packages. However, this has not been tested properly.
Examples
In the following we showcase some of the capabilities of hrosailing.
All definitions of an example code might be used in the succeeding examples.
Serialization of PolarDiagram objects
For a first example, lets say we obtained some table with polar performance diagram data, like the one available here, and call the file testdata.csv.
import hrosailing.polardiagram as pol
# the format of `testdata.csv` is a tab separated one
# supported by the keyword `array`
pd = pol.from_csv("testdata.csv", fmt="array")

# for symmetric results
pd = pd.symmetrize()

# serializes the polar diagram to a .csv file
# in the style of an intern format
pd.to_csv("polar_diagram.csv")
# the default format is the intern format `hro`
pd2 = pol.from_csv("polar_diagram.csv")
Currently serialization is only supported for some csv-formats, see also csv-format-examples for example files for the currently supported formats. See also Issue #1 for a plan to add more serialization options.
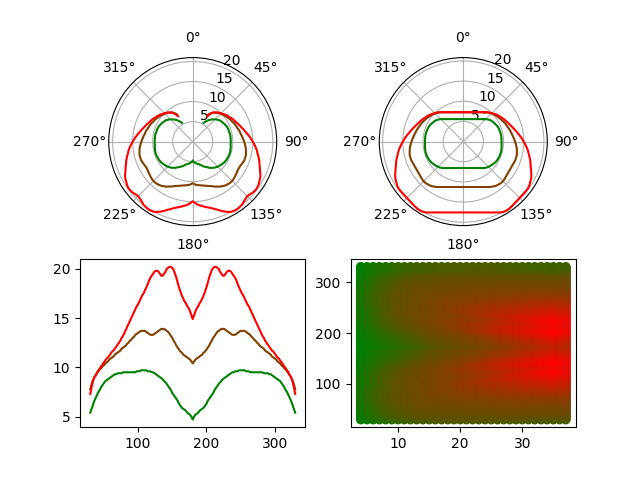
Visualizing polar diagrams
import matplotlib.pyplot as plt
import hrosailing.plotting as plot

ws = [10, 20, 30]

plt.subplot(2, 2, 1, projection="hro polar").plot(pd, ws=ws)
plt.subplot(2, 2, 2, projection="hro polar").plot(pd, ws=ws, use_convex_hull=True)
plt.subplot(2, 2, 3, projection="hro flat").plot(pd, ws=ws)
plt.subplot(2, 2, 4, projection="hro color gradient").plot(pd)

plt.show()
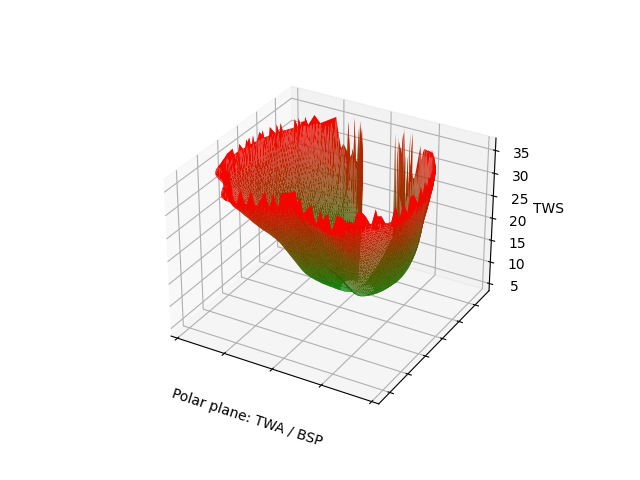
3d visualization is also supported.
plot.plot_3d(pd)
plt.show()
Iterate over polar diagram data
We can also directly iterate and/or evaluate the wind angles, wind speeds and boat speeds of the polar diagram.
import numpy as np


def random_shifted_pt(pt, mul):
    pt = np.array(pt)
    rand = np.random.random(pt.shape) - 0.5
    rand *= np.array(mul)
    random_pt = pt + rand
    for i in range(3):
        random_pt[i] = max(random_pt[i], 0)
    return random_pt


data = np.array([
    random_shifted_pt([ws, wa, pd(ws, wa)], [10, 5, 2])
    for wa in pd.wind_angles
    for ws in pd.wind_speeds
    for _ in range(6)
])
data = data[np.random.choice(len(data), size=500)]
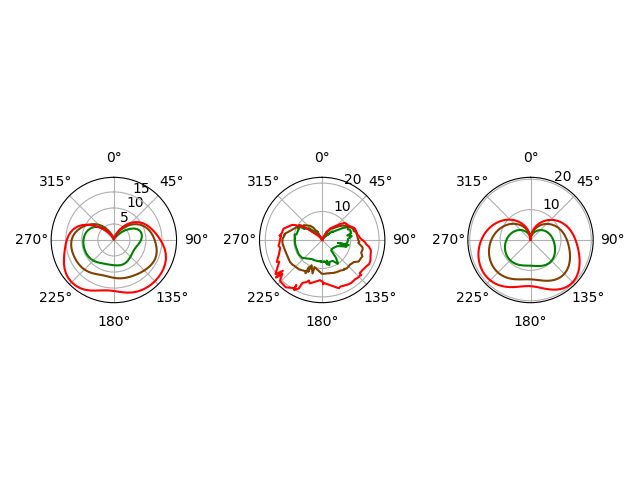
Creating polar diagrams from raw data
import hrosailing.pipeline as pipe
import hrosailing.processing as proc

pol_pips = [
    pipe.PolarPipeline(
        data_handler=proc.ArrayHandler(),
        imputator=proc.RemoveOnlyImputator(),
        extension=pipe.TableExtension()
    ),
    pipe.PolarPipeline(
        data_handler=proc.ArrayHandler(),
        imputator=proc.RemoveOnlyImputator(),
        extension=pipe.PointcloudExtension()
    ),
    pipe.PolarPipeline(
        data_handler=proc.ArrayHandler(),
        imputator=proc.RemoveOnlyImputator(),
        extension=pipe.CurveExtension()
    )
]

# here `data` is treated as some obtained measurements given as
# a numpy.ndarray
pds = [
	pol_pip(
        [(data, ["Wind speed", "Wind angle", "Boat speed"])]
    ).polardiagram
	for pol_pip in pol_pips
]
#
for i, pd in enumerate(pds):
   plt.subplot(1, 3, i+1, projection="hro polar").plot(pd, ws=ws)

plt.tight_layout()
plt.show()
If we are unhappy with the default behaviour of the pipelines, we can customize one or more components of it.
Customizing PolarPipeline
import hrosailing.models as models

class MyInfluenceModel(models.InfluenceModel):
    def remove_influence(self, data):
        tws = np.array(data["TWS"])
        twa = np.array(data["TWA"])
        bsp = np.array(data["BSP"])
        return np.array([
            tws,
            (twa + 90)%360,
            bsp**2
        ]).transpose()

    def add_influence(self, pd, influence_data: dict):
        pass


class MyFilter(proc.Filter):
    def filter(self, wts):
        return np.logical_or(wts <= 0.2, wts >= 0.8)


def my_model_func(ws, wa, *params):
    return params[0] + params[1]*wa + params[2]*ws + params[3]*ws*wa


my_regressor = proc.LeastSquareRegressor(
    model_func=my_model_func,
    init_vals=(1, 2, 3, 4)
)


my_extension = pipe.CurveExtension(
    regressor=my_regressor
)


def my_norm(pt):
    return np.linalg.norm(pt, axis=1)**4


my_pol_pip = pipe.PolarPipeline(
    data_handler=proc.ArrayHandler(),
    imputator=proc.RemoveOnlyImputator(),
    influence_model=MyInfluenceModel(),
    post_weigher=proc.CylindricMeanWeigher(radius=2, norm=my_norm),
    extension=my_extension,
    post_filter=MyFilter()
)

out = my_pol_pip([(data, ["Wind speed", "Wind angle", "Boat speed"])])
my_pd = out.polardiagram
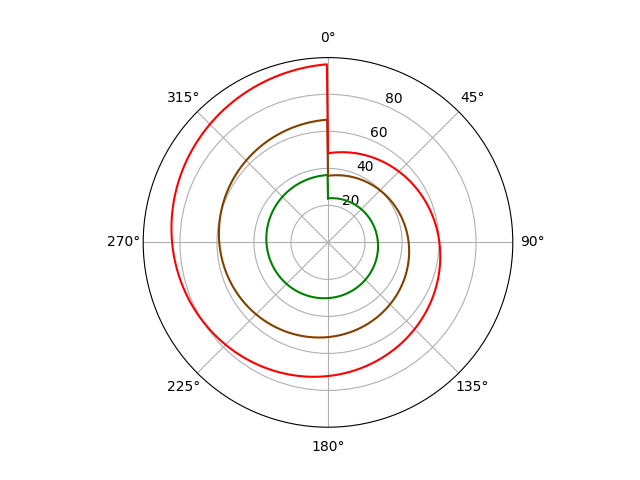
The customizations above are arbitrary and lead to comparably bad results:
plot.plot_polar(my_pd, ws=ws)
plt.show()
Including Influences and Weather models
For the next example we initialize a simple influence model and a random weather model.
from datetime import timedelta
from datetime import datetime as dt


class MyInfluenceModel(models.InfluenceModel):

    def remove_influence(self, data):
        pass

    def add_influence(self, pd, data, **kwargs):
        ws, wa, wave_height = np.array(
            [data["TWS"], data["TWA"], data["WVHGT"]]
        )
        twa = (wa + 5)%360
        tws = ws + ws/wave_height
        return [pd(ws, wa) for ws, wa in zip(tws, twa)]


im = MyInfluenceModel()

n, m, k, l = 500, 50, 40, 3

data = 20 * (np.random.random((n, m, k, l)))

wm = models.GriddedWeatherModel(
    data=data,
    times=[dt.now() + i * timedelta(hours=1) for i in range(n)],
    lats=np.linspace(40, 50, m),
    lons=np.linspace(40, 50, k),
    attrs=["TWS", "TWA", "WVHGT"]
)
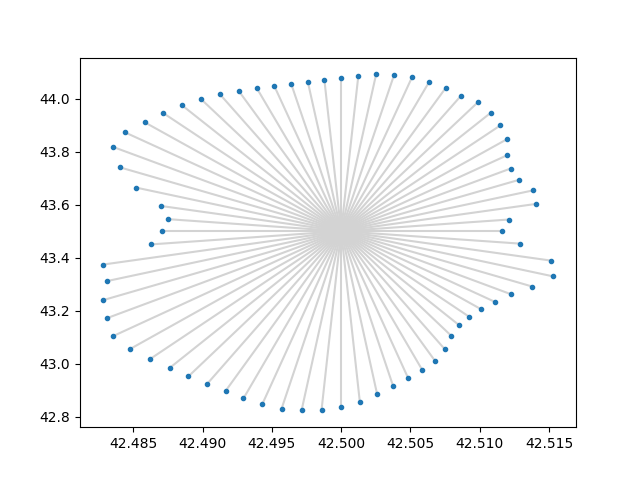
Computing Isochrones
import hrosailing.cruising as cruise

start = (42.5, 43.5)

isochrones = [
    cruise.isochrone(
            pd=pd,
            start=start,
            start_time=dt.now(),
            direction=direction,
            wm=wm,
	    im=im,
            total_time=1 / 3
        )
    for direction in range(0, 360, 5)
]

coordinates, _ = zip(*isochrones)
lats, longs = zip(*coordinates)

for lat, long in coordinates:
    plt.plot([start[0], lat], [start[1], long], color="lightgray")
plt.plot(lats, longs, ls="", marker=".")

plt.show()
License
The hrosailing package is published under the
Apache 2.0 License,
see also License
Citing

Also see Citation.
TODO
1 maintainer

Metadata
1 maintainer
Release files for hrosailing 0.12.0
For a detailed explanation of source distributions (sdists) and built distributions (wheels), please see the package formats documentation.
Source distribution (sdist)
| File | Size | Uploaded | |
|---|---|---|---|
| hrosailing-0.12.0.tar.gz | 89.0 kB | Details |
Built distribution (wheel)
| File | Interpreter | ABI | Platform | Reset |
|---|---|---|---|---|
| hrosailing-0.12.0-py3-none-any.whl | Python 3 | none | any | Details |
Total release size: 193.3 kB
Release files / hrosailing-0.12.0.tar.gz
| Download URL | hrosailing-0.12.0.tar.gz |
|---|---|
| Size | 89.0 kB |
| Tags | Source |
|
SHA-256 checksum How to use checksums |
9e98d00f906be23323a43b0bf7a4af97dfe6460cda1d4f92241afaf897502992
|
|
BLAKE2b-256 checksum How to use checksums |
902afbe6fbfbc9fc13cef974df389ee5e2e896191513659bf3e49a324e8427a9
|
| Upload date | |
|
Uploaded using Trusted Publishing? What is trusted publishing? |
No |
| Uploaded via |
twine/6.1.0 CPython/3.12.9
|
Release files / hrosailing-0.12.0-py3-none-any.whl
| Download URL | hrosailing-0.12.0-py3-none-any.whl |
|---|---|
| Size | 104.4 kB |
| Tags | Python 3 |
|
SHA-256 checksum How to use checksums |
9e4cb40634fdd12e0877988d05cdc4aed3e1804ed83ed015a9028539f56c4c7e
|
|
BLAKE2b-256 checksum How to use checksums |
4dbafb37a1a22ffe8b90da30efac2cb1db2b8b6f0563f864c2d9c5603ba7eb23
|
| Upload date | |
|
Uploaded using Trusted Publishing? What is trusted publishing? |
No |
| Uploaded via |
twine/6.1.0 CPython/3.12.9
|














