A quantitative model for measuring organizational security risk caused by human dependencies

Project description
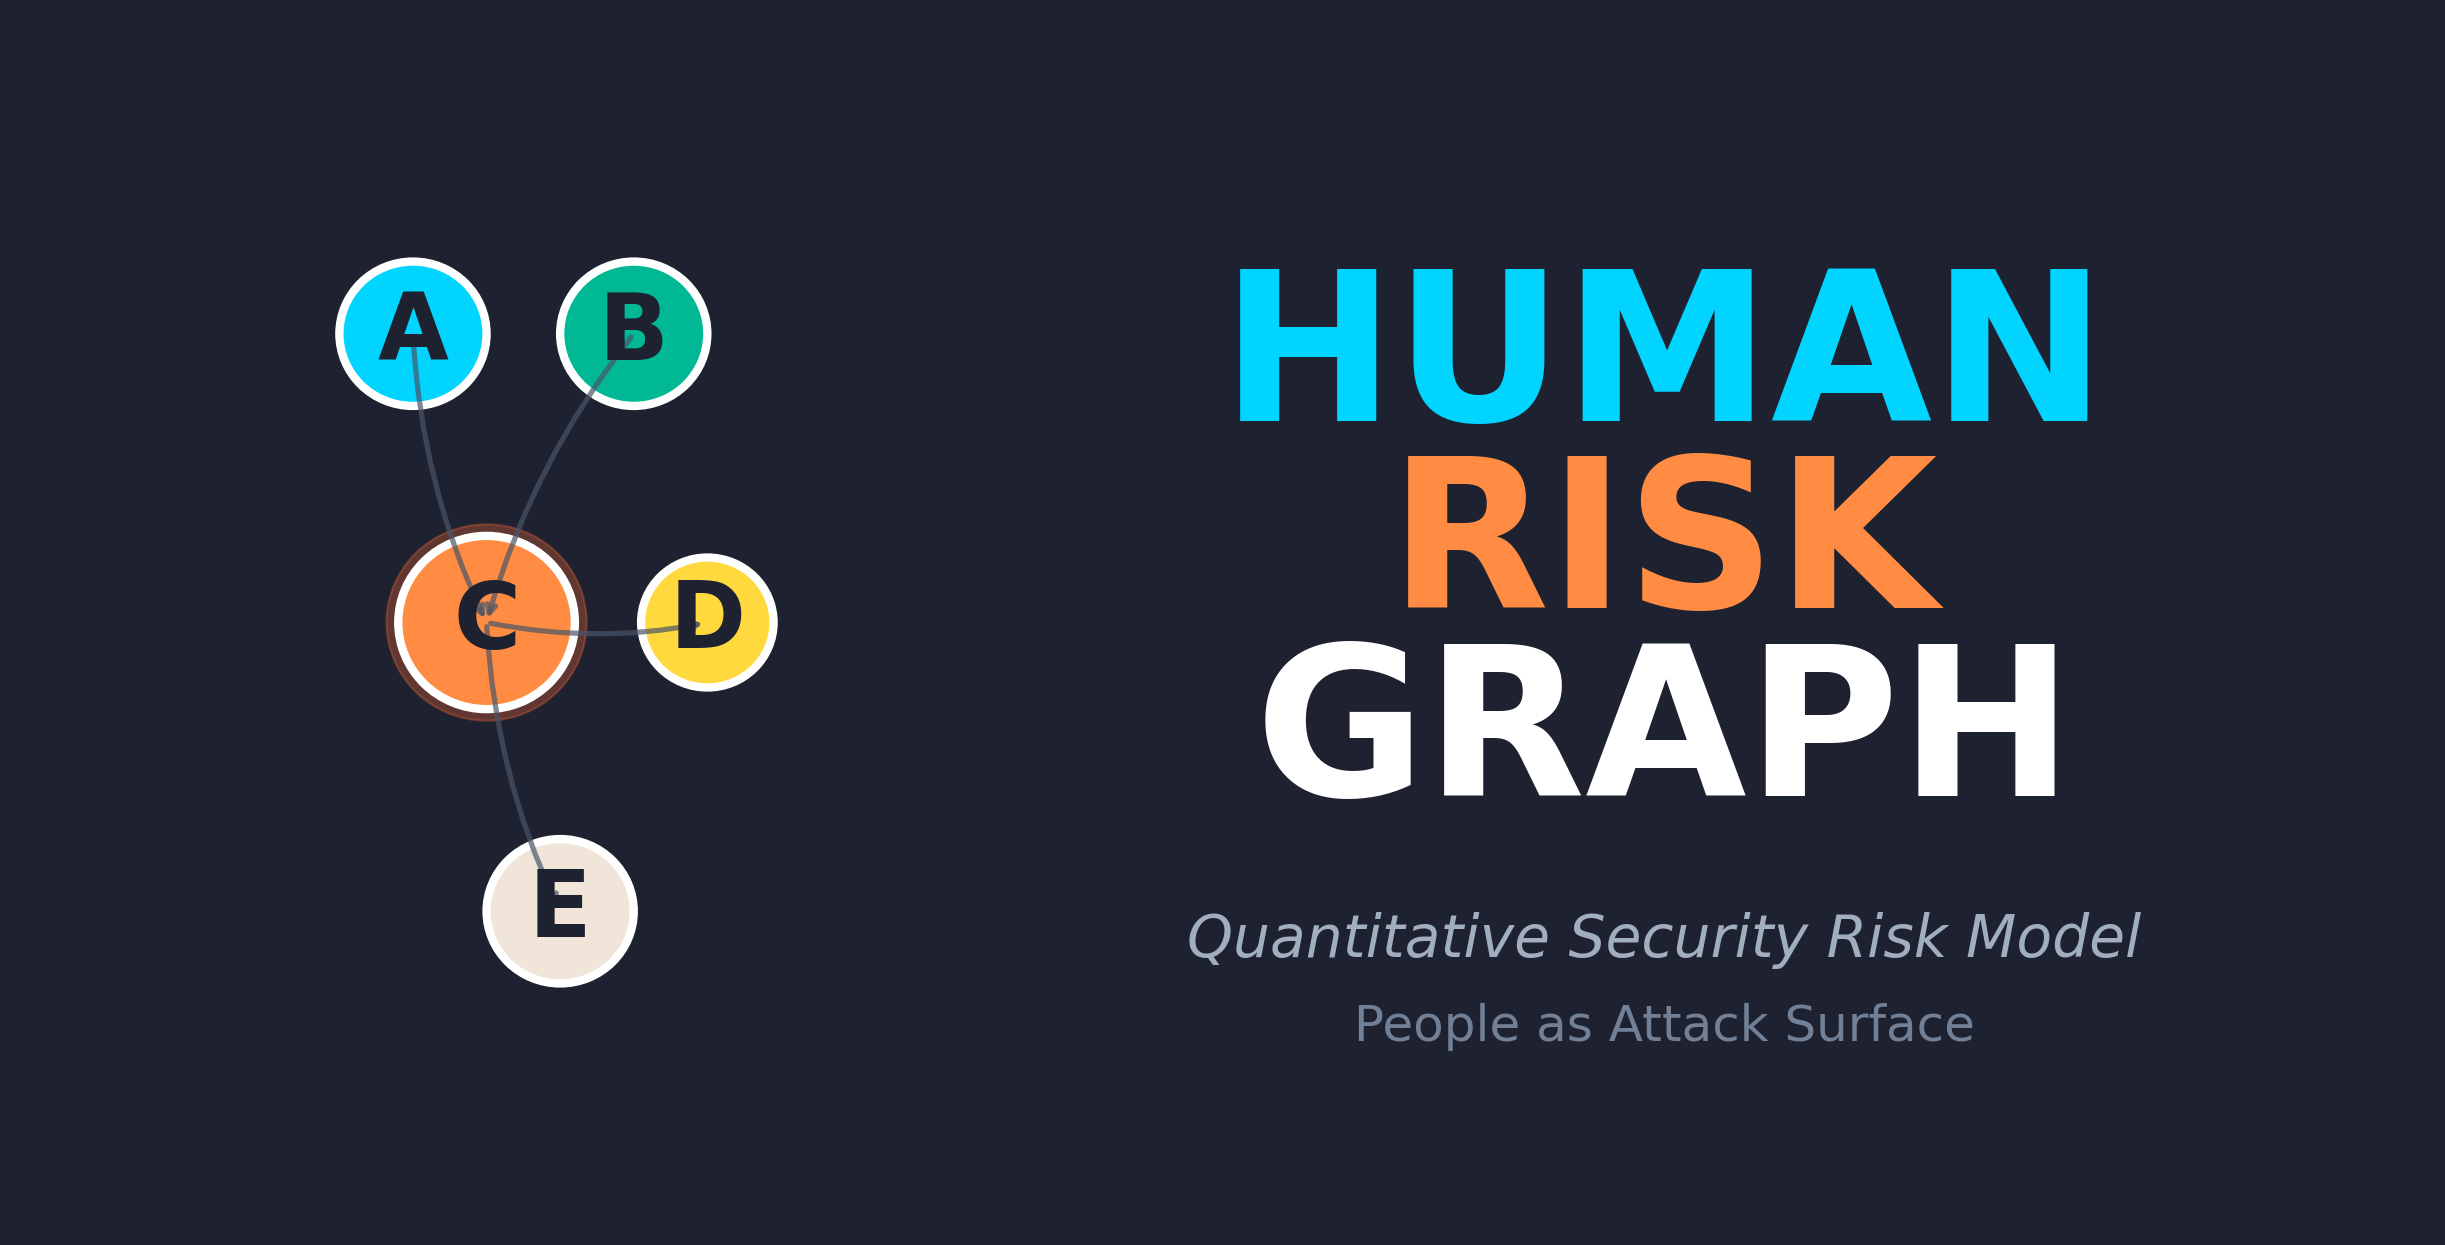


Human Risk Graph (HRG)
Human Risk Graph (HRG) is a quantitative model for measuring organizational security risk caused by human dependencies, decision concentration, and bus-factor effects.
Unlike traditional security models that focus only on technical assets, HRG treats people as part of the attack surface and models how organizational decisions and emergency processes introduce systemic risk.
Core Idea
Organizations often depend on a small number of individuals for:
- critical decisions,
- emergency bypasses,
- access approvals.
HRG represents these dependencies as a directed graph and computes risk metrics that highlight human single points of failure.
What HRG Measures
- Bus Factor Risk — how fragile the organization is to the loss of key people
- Decision Concentration — how much authority is centralized
- Bypass Risk — how often normal controls are overridden by humans
Repository Structure
src/— core implementation (HRG class, metrics, graph algorithms)tests/— comprehensive unit testsexperiments/— synthetic data generation and benchmarkingexamples/— usage demonstrationspaper/— LaTeX source for academic paper (arXiv-ready)docs/— formal model with mathematical definitionsdata/— example organization datasets
Quick Start
Installation
# Install from PyPI (recommended)
pip install human-risk-graph

# Or install from source
git clone https://github.com/LF3551/human-risk-graph.git
cd human-risk-graph
pip install -e .

# With development tools
pip install -e ".[dev]"
Data Format
Create a JSON file describing your organization structure:
{
  "people": [
    { "id": "A", "role": "SRE", "criticality": 0.9 },
    { "id": "B", "role": "Security Engineer", "criticality": 0.8 },
    { "id": "C", "role": "Manager", "criticality": 0.7 },
    { "id": "D", "role": "Developer", "criticality": 0.4 }
  ],
  "dependencies": [
    { "from": "A", "to": "B", "type": "approval", "weight": 0.8 },
    { "from": "C", "to": "A", "type": "bypass", "weight": 0.9 }
  ]
}
Fields:
people.id— unique identifierpeople.role— job title (optional)people.criticality— importance level (0.0-1.0)dependencies.from/to— person IDsdependencies.type— relationship type (approval, bypass, etc.)dependencies.weight— dependency strength (0.0-1.0)
CLI Usage
The easiest way to use HRG is through the command-line interface:
# Analyze an organization (generates JSON, Markdown, and HTML reports)
hrg analyze data/example_organization.json

# Generate only HTML report
hrg analyze data/example_organization.json --format html

# Specify output file
hrg analyze data/example_organization.json --format html --output my_report.html

# Generate interactive graph visualization only
hrg visualize data/example_organization.json
Example Output
🔍 Analyzing: data/example_organization.json
⚙️  Running Human Risk Graph analysis...
✅ Generated: example_organization_report.json
✅ Generated: example_organization_graph.html

============================================================
📊 ANALYSIS SUMMARY
============================================================
Composite HRG Score: 0.090
  • Bus Factor Score: 0.225
  • Decision Concentration: 0.000
  • Bypass Risk Score: 0.000

⚠️  Critical People (Articulation Points): 1
   - A

✅ Analysis complete! Generated 2 file(s).
Generated files:
- JSON report with detailed metrics
- Interactive HTML graph visualization
- Optional Markdown and HTML reports
Python API Usage
from src.hrg import HumanRiskGraph

# Load your organization data
people = [...]
dependencies = [...]

# Create and analyze
hrg = HumanRiskGraph(people, dependencies)
results = hrg.calculate()

print(f"Composite Risk Score: {results['composite_score']:.3f}")
print(f"Critical People: {results['critical_people']}")
Development
# Run tests
pytest tests/ -v

# Run tests with coverage
pytest tests/ --cov=src --cov-report=html

# Code formatting
black src/ tests/ --line-length 100

# Linting
flake8 src/ tests/

# Run experiments
python experiments/generate_data.py
python experiments/run_experiments.py
python experiments/visualize.py
Key Features
- Graph-based analysis using NetworkX
- Three core metrics: Bus Factor, Decision Concentration, Bypass Risk
- Polynomial-time algorithms with proven complexity bounds
- Comprehensive test coverage
- Research paper ready for arXiv submission
- CISSP portfolio demonstration project
Use Cases
- Security architecture analysis
- Business continuity planning
- Insider threat assessment
- Organizational risk modeling
Status
This repository provides a reference implementation of the HRG model. It is intended for research, architecture analysis, and discussion — not as a production-ready security tool.
Citation
If you use this software in your research or work, please cite:
@software{aleinikov_2026_hrg,
  author       = {Aleinikov, Aleksei},
  title        = {Human Risk Graph: A Quantitative Model for Organizational Security Risk},
  year         = 2026,
  publisher    = {Zenodo},
  version      = {v0.1.1},
  doi          = {10.5281/zenodo.18288056},
  url          = {https://doi.org/10.5281/zenodo.18288056}
}
Or use this text citation:
Aleinikov, A. (2026). Human Risk Graph: A Quantitative Model for Organizational Security Risk (v0.1.1). Zenodo. https://doi.org/10.5281/zenodo.18288056
License
Licensed under the Apache License, Version 2.0. See the LICENSE file for details.
Release history Release notifications | RSS feed


Download files
Download the file for your platform. If you're not sure which to choose, learn more about installing packages.
Source Distribution
Built Distribution
Filter files by name, interpreter, ABI, and platform.
If you're not sure about the file name format, learn more about wheel file names.
Copy a direct link to the current filters
File details
Details for the file human_risk_graph-0.1.2.tar.gz.
File metadata
- Download URL: human_risk_graph-0.1.2.tar.gz
- Upload date:
- Size: 25.4 kB
- Tags: Source
- Uploaded using Trusted Publishing? No
- Uploaded via: twine/6.2.0 CPython/3.13.7
File hashes
| Algorithm | Hash digest | |
|---|---|---|
| SHA256 |
7ceb02c7fd5523303f1dcc34d453b1471bb7eb06cc27817227cc92892b88257f
|
|
| MD5 |
31847948e412f32e6aff3b7878a32541
|
|
| BLAKE2b-256 |
9b2212bf40abaa759ceba0e344471546726a0f65f7a3619327e09e32e1fbf284
|
File details
Details for the file human_risk_graph-0.1.2-py3-none-any.whl.
File metadata
- Download URL: human_risk_graph-0.1.2-py3-none-any.whl
- Upload date:
- Size: 29.5 kB
- Tags: Python 3
- Uploaded using Trusted Publishing? No
- Uploaded via: twine/6.2.0 CPython/3.13.7
File hashes
| Algorithm | Hash digest | |
|---|---|---|
| SHA256 |
fdc90ba408338b5e724033cb0514e0f1fb1ab4166b8054ac9759b9d452114fec
|
|
| MD5 |
b55a153ecd514e1af9e3b9faeb29e37c
|
|
| BLAKE2b-256 |
878fcf0b2a9fa556b60ff0883ce30116e151531ed9cfc93157b2bd30a181b3f8
|


