A Python package for horizontal-to-vertical spectral ratio processing

Project description
hvsrpy - A Python package for horizontal-to-vertical spectral ratio processing
Joseph P. Vantassel, jpvantassel.com


Table of Contents
- About hvsrpy
- Why use hvsrpy
- A Comparison of hvsrpy with Geopsy
- Getting Started
- Additional Comparisons between hvsrpy and Geopsy
About hvsrpy
hvsrpy is an open-source Python package for performing horizontal-to-vertical
spectral ratio (HVSR) processing of microtremor and earthquake recordings.
hvsrpy was developed by Joseph P. Vantassel
with contributions from Dana M. Brannon under the supervision of Professor
Brady R. Cox at The University of Texas at Austin. hvsrpy continues to be
developed and maintained by Joseph P. Vantassel and his research group at Virginia Tech.
Citation
If you use hvsrpy in your research or consulting, we ask you please cite the
following:
Vantassel, J.P. (2025). "hvsrpy: An Open‐Source Python Package for Microtremor and Earthquake Horizontal‐to‐Vertical Spectral Ratio Processing". Seismological Research Letters. 96 (4): 2671–2682, https://doi.org/10.1785/0220240395
Joseph Vantassel. (2020). jpvantassel/hvsrpy: latest (Concept). Zenodo. http://doi.org/10.5281/zenodo.3666956
For software, version specific citations should be preferred to
general concept citations. To generate a version specific citation
for hvsrpy, please use the citation tool on the hvsrpy
archive.
References to Implemented Work
hvsrpy implements the work of many others. We strongly encourage
users to cite original work alongside hvsrpy. Below we list key features
and their associated citation.
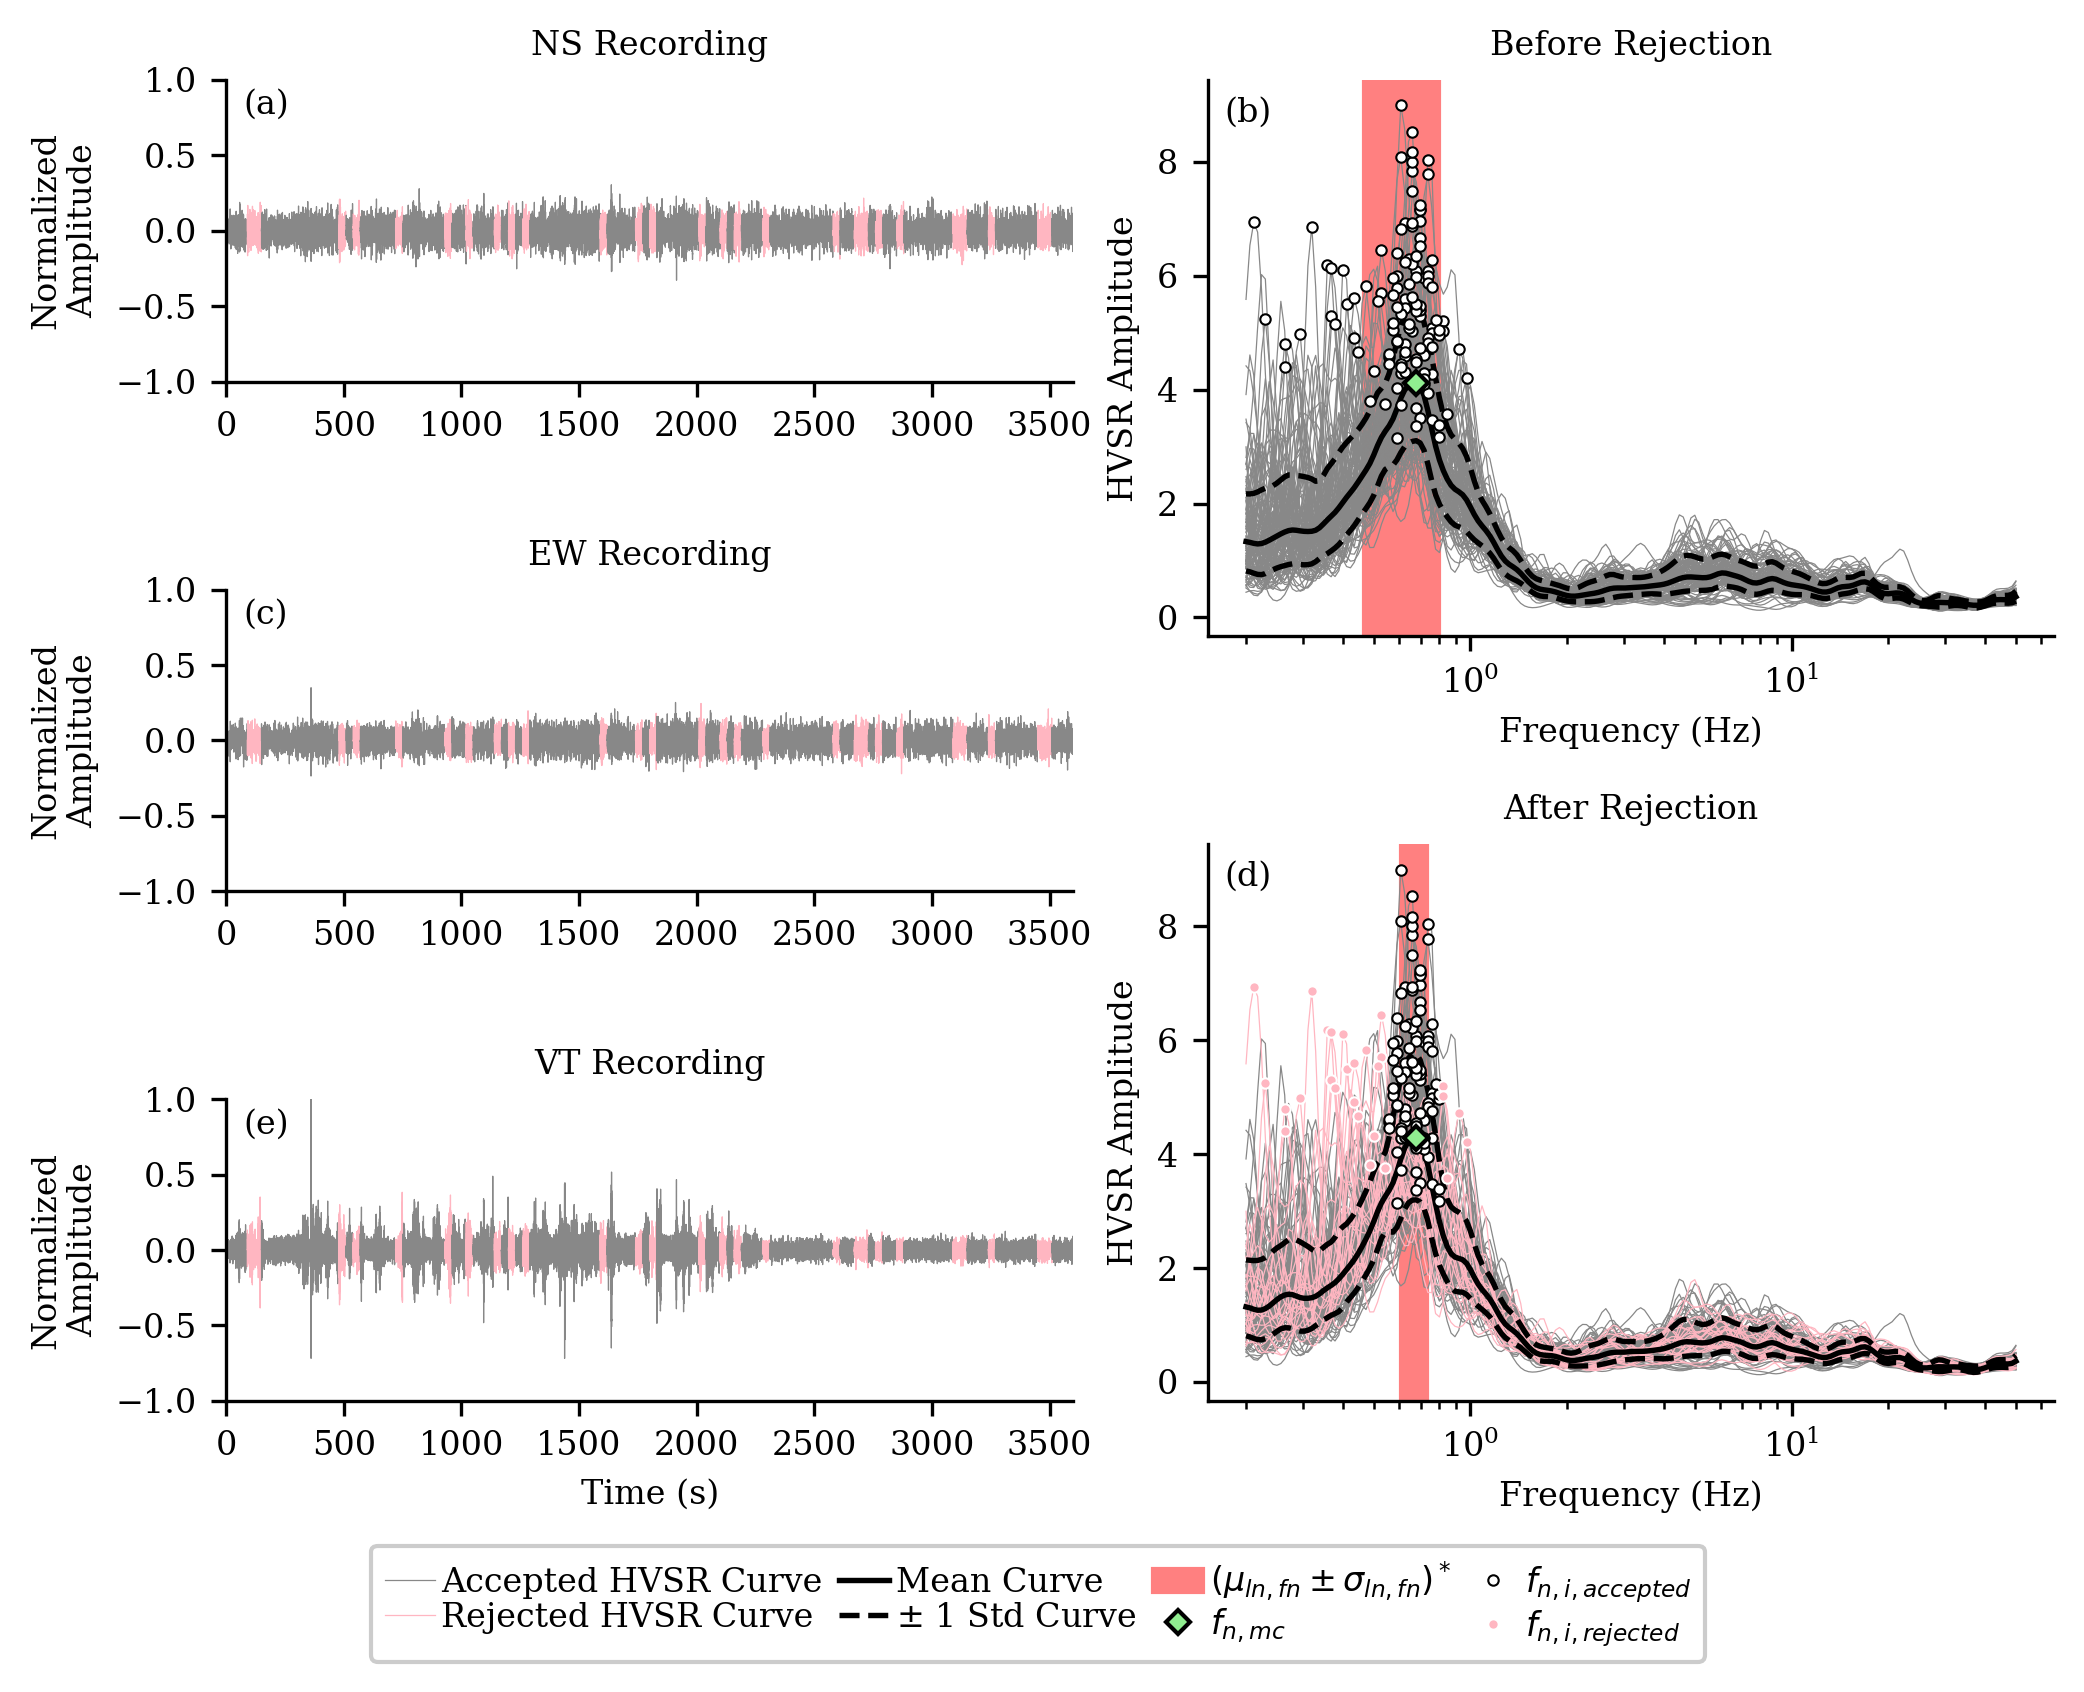
Lognormal statistics and fully-automated frequency-domain window-rejection algorithm.
Cox, B. R., Cheng, T., Vantassel, J. P., & Manuel, L. (2020). "A statistical representation and frequency-domain window-rejection algorithm for single-station HVSR measurements. Geophysical Journal International, 221(3), 2170–2183. https://doi.org/10.1093/gji/ggaa119
Statistical approach to incorporate azimuthal variability.
Cheng, T., Cox, B. R., Vantassel, J. P., and Manuel, L. (2020). "A statistical approach to account for azimuthal variability in single-station HVSR measurements." Geophysical Journal International, 223(2), 1040–1053. https://doi.org/10.1093/gji/ggaa342
Statistical approach to incorporate spatial variability.
Cheng, T., Hallal, M. M., Vantassel, J. P., and Cox, B. R., (2021). "Estimating Unbiased Statistics for Fundamental Site Frequency Using Spatially Distributed HVSR Measurements and Voronoi Tessellation. J. Geotech. Geoenviron. Eng. 147, 04021068. https://doi.org/10.1061/(ASCE)GT.1943-5606.0002551
SESAME clarity and reliability criteria for microtremor HVSR.
SESAME. (2004). Guidelines for the Implementation of the H/V Spectral Ratio Technique on Ambient Vibrations Measurements, Processing, and Interpretation. European Commission - Research General Directorate, 62, European Commission - Research General Directorate.
Computation of HVSR under the diffuse field assumption.
Sánchez-Sesma, F.J., Rodríguez, M., Iturrarán-Viveros, U., Luzón, F., Campillo, M., Margerin, L., García-Jerez, A., Suarez, M., Santoyo, M.A., Rodríguez-Castellanos, A. (2011). A theory for microtremor H/V spectral ratio: application for a layered medium: Theory for microtremor H/V spectral ratio. Geophysical Journal International 186, 221–225. https://doi.org/10.1111/j.1365-246X.2011.05064.x
Power spectral density (PSD) calculation.
Welch, P., (1967). The use of fast Fourier transform for the estimation of power spectra: a method based on time averaging over short, modified periodograms. IEEE Transactions on audio and electroacoustics, 15(2), pp.70-73.
New high noise model (NHNM) and new low noise model (NLNM).
Peterson, J., (1993). Observation and Modeling of Seismic Background Noise (Open-File Report No. 93–322). U.S. Geologic Survey, Albuquerque, New Mexico.
hvsrpy would not exist without the help of many others. As a
display of our gratitude, we thank them individually
here.
Why use hvsrpy
hvsrpy contains features not currently available in any other commercial or
open-source software, including:
- Support of a broad range of microtremor and earthquake data formats including: MiniSEED, SAF, MiniShark, SAC, GCF, and PEER.
- Multiple methods to combine the horizontal components including: arithmetic_mean, squared-average, quadratic-mean, geometric-mean, total-horizontal-energy, vector-summation, maximum-horizontal-value, rotD50, or single-azimuth.
- Ability to use a lognormal distribution for the site resonant
frequency (
fn) so the uncertainty infncan be represented consistently in frequency and period. - Direct access to the raw HVSR data from each time window and azimuth (i.e., not only the mean/median curve) through Python objects and cross-platform text-based output format.
- Calculate statistics on
fnthat incorporates azimuthal variability. - Ability to develop rigorous and unbiased spatial statistics to combine spatially distributed HVSR measurements.
- Multiple automated window rejection algorithms including the frequency-domain window-rejection algorithm by Cox et al. (2020).
- Automated checking of the SESAME (2004) peak reliability and clarity criteria.
- A command line interface (CLI) for parallel batch-style processing using multiprocessing.
Example output from hvsrpy when considering the geometric-mean of the horizontal components
| Lognormal Median | Lognormal Standard Deviation | |
|---|---|---|
| Site Frequency, fn | 0.67 | 0.09 |
| Site Period, Tn | 1.50 | 0.09 |
Example output from hvsrpy when considering azimuthal variability
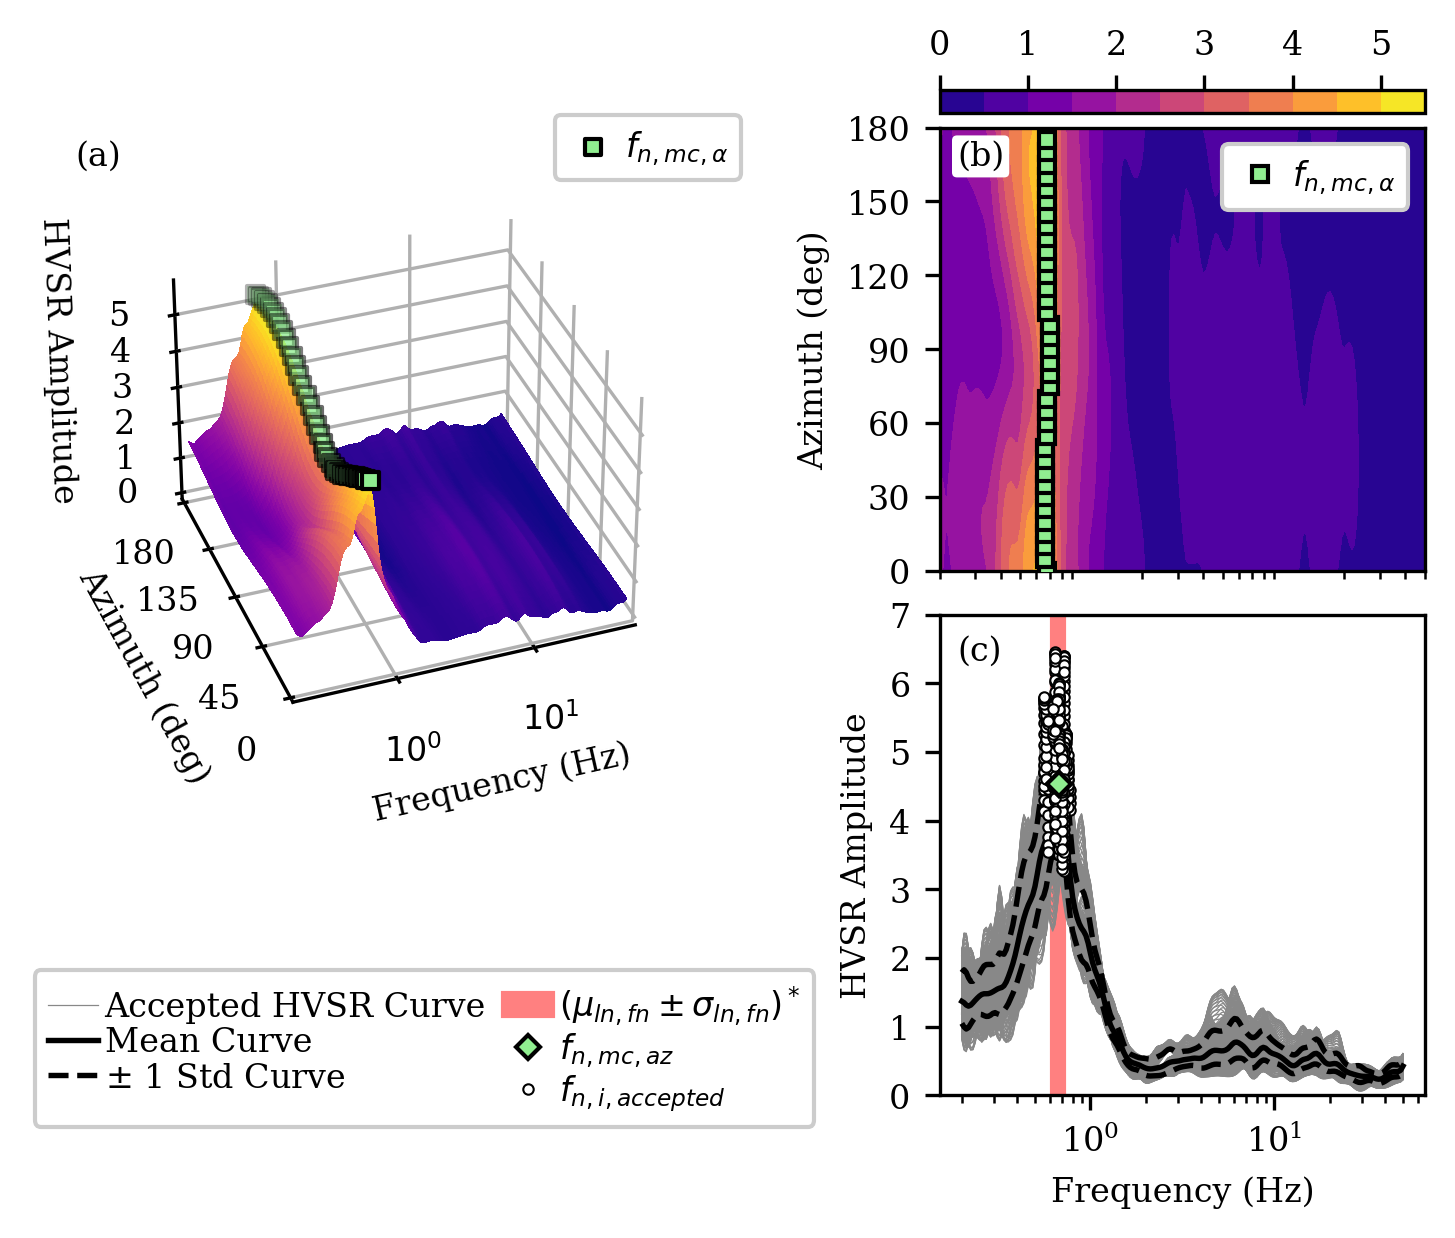
| Lognormal Median | Lognormal Standard Deviation | |
|---|---|---|
| Site Frequency, fn,az | 0.67 | 0.07 |
| Site Period, Tn,az | 1.50 | 0.07 |
Example output from hvsrpy when considering spatial variability
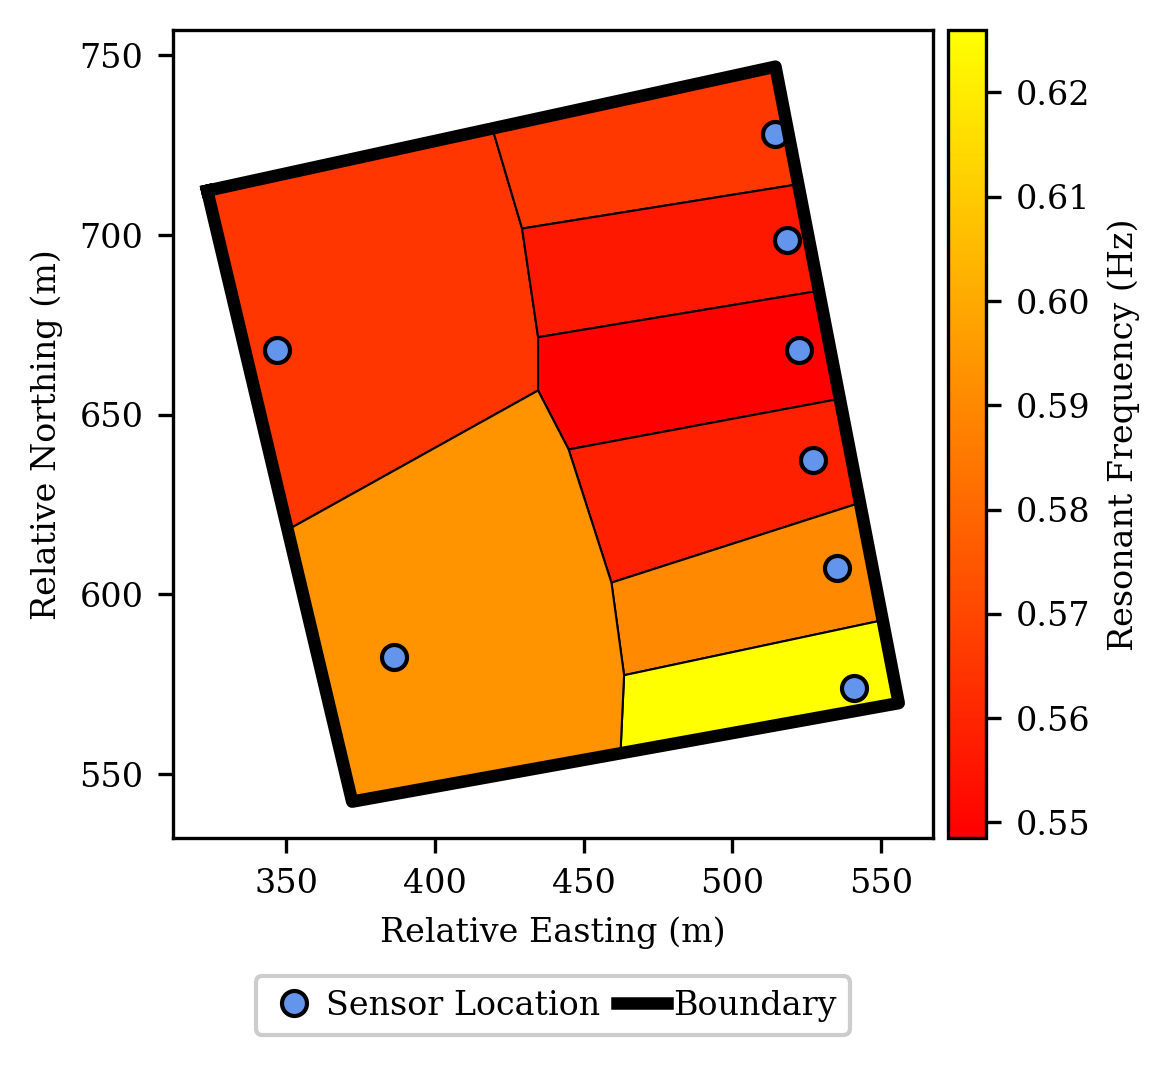
| Lognormal Median | Lognormal Standard Deviation | |
|---|---|---|
| Site Frequency, fn,xy | 0.58 | 0.15 |
| Site Period, Tn,xy | 1.74 | 0.15 |
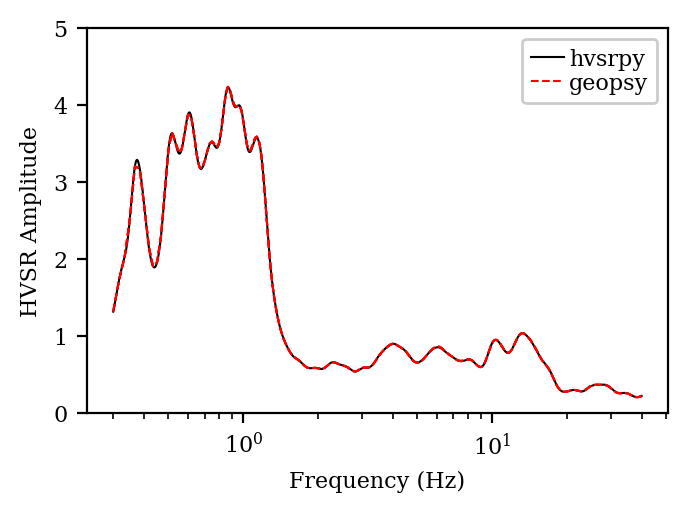
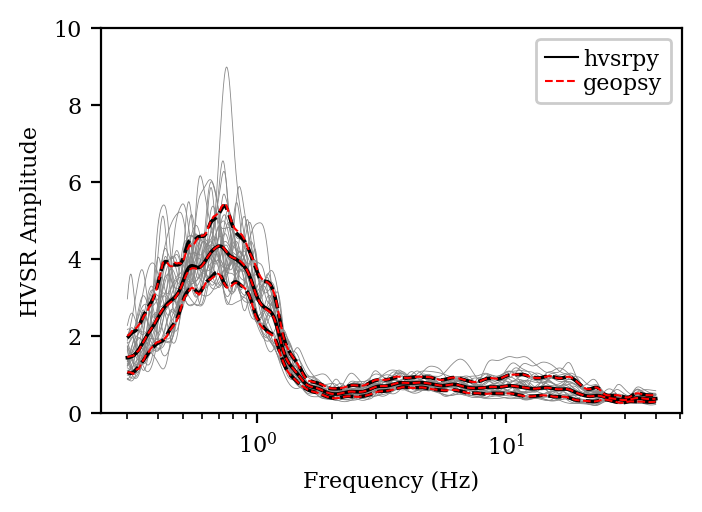
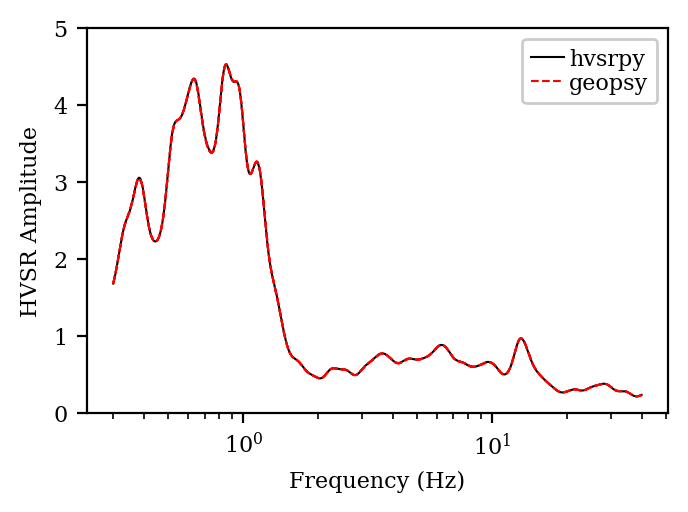
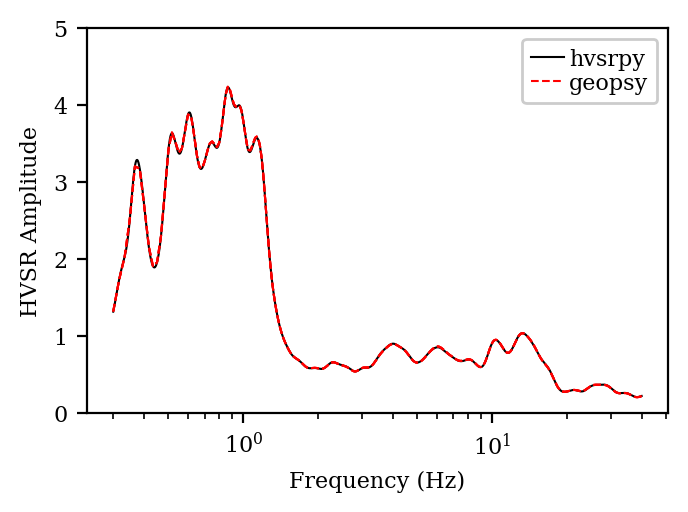
A comparison of hvsrpy with Geopsy
Some of the functionality available in hvsrpy overlaps with the popular
open-source software geopsy. Therefore, to encourage standardization, wherever
their functionality coincides we have sought to ensure consistency. Two such
comparisons are shown below. One for a single time window (top) and one for
multiple time windows (bottom). Additional examples are provided at the end of
this document. Additional examples and the code to reproduce all of the
examples shown are provided in the
gallery.
Getting Started
Installing or Upgrading hvsrpy
-
If you do not have Python 3.8 or later installed, you will need to do so. A detailed set of instructions can be found here.
-
If you have not installed
hvsrpypreviously, you can install it withpipvia the commandpip install hvsrpy. If you are not familiar withpip, a useful tutorial can be found here. If you have an earlier version and would like to upgrade to the latest version ofhvsrpyusepip install hvsrpy --upgrade. -
Confirm that
hvsrpyhas installed/updated successfully by examining the last few lines of the text displayed in the console.
Using hvsrpy
-
Download the contents of the examples directory to any location of your choice.
-
Launch the Jupyter notebook (
example_mhvsr_traditional.ipynb) in the examples directory for a no-coding-required introduction to the basics of thehvsrpypackage. If you have not installedJupyter Lab, detailed instructions can be found here. -
Continue to explore the other example notebooks provided. Note that each example notebook seeks to highlight one or two key features of
hvsrpyand it may be helpful to combine multiple components together to build a custom workflow. -
Enjoy!
Looking for more information
More information regarding HVSR processing and hvsrpy can be found
here
and in the softwares documentation
here.
Additional Comparisons between hvsrpy and Geopsy
Multiple Windows
The examples in this section use the same settings applied to different noise records. The settings are provided in the Settings section and the name of each file is provided above the corresponding figure in the Results section. The noise records (i.e., .miniseed files) are provided in the examples directory and also as part of a large published data set (Cox and Vantassel, 2018).
Settings
- Window Length: 60 seconds
- Bandpass Filter: No
- Tukey Window Length: 10% (i.e., 5% in Geopsy)
- Konno and Ohmachi Smoothing Coefficient: 40
- Resampling Center Frequencies:
- Minimum: 0.3 Hz
- Maximum: 40 Hz
- Number: 2048
- Type: 'log'
- Method for Combining Horizontal Components: 'squared-average'
- Distribution for f0 from Time Windows: 'normal'
- Distribution for Mean Curve: 'lognormal'
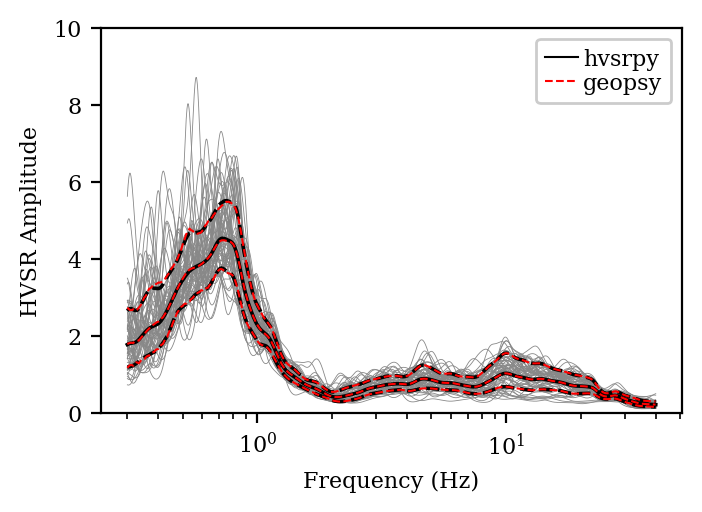
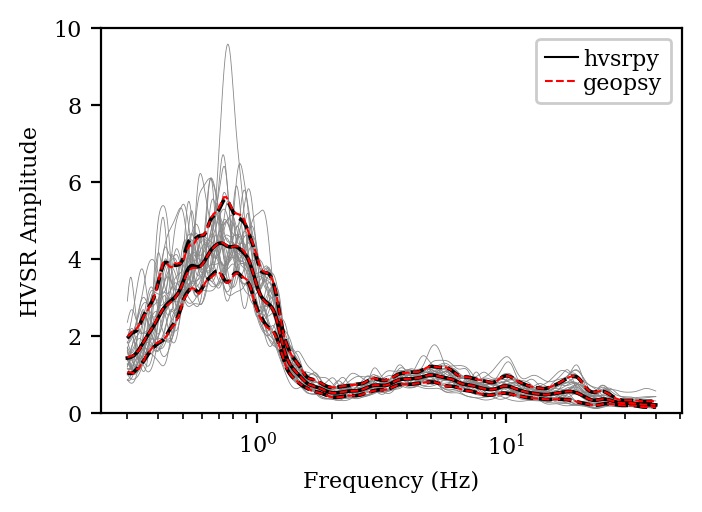
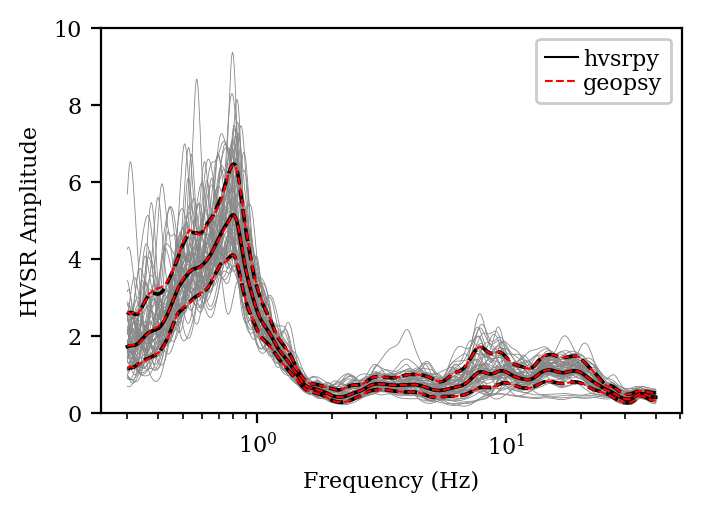
Multiple Window Results
File Name: UT.STN11.A2_C50.miniseed
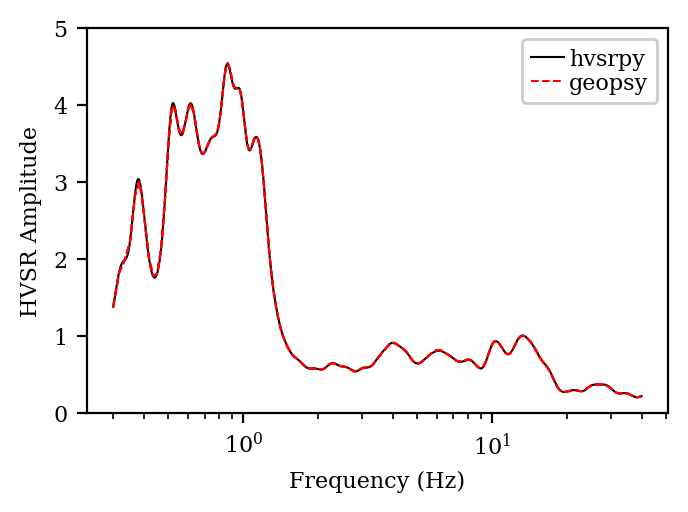
File Name: UT.STN11.A2_C150.miniseed
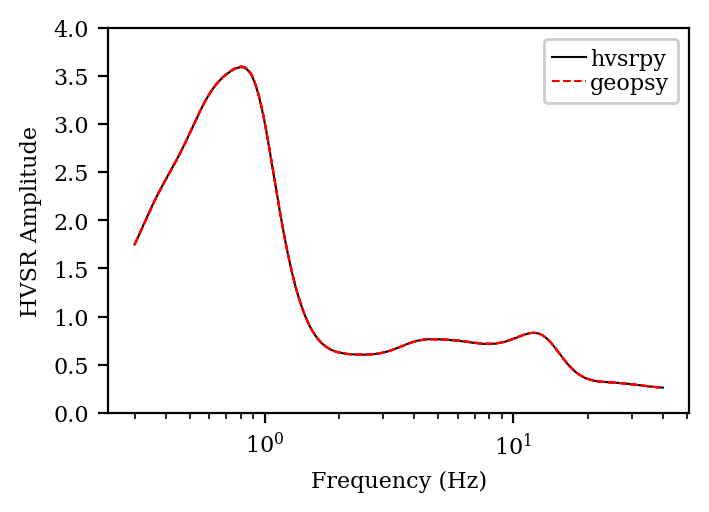
File Name: UT.STN12.A2_C50.miniseed
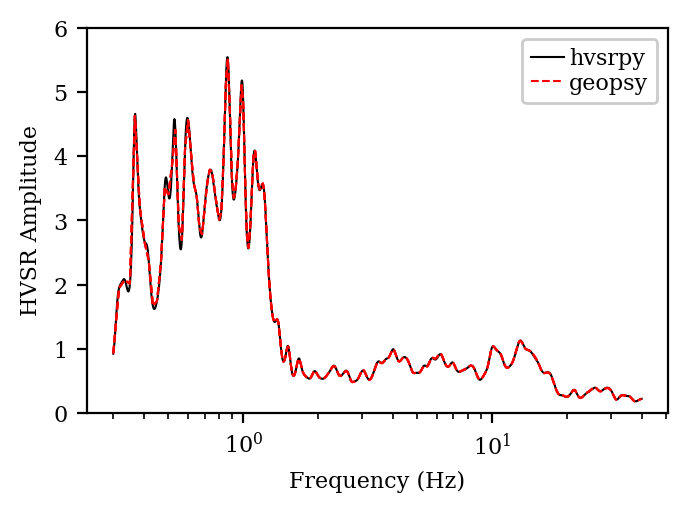
File Name: UT.STN12.A2_C150.miniseed
Single Window
The examples in this section apply different settings to the same noise record (UT.STN11.A2_C50.miniseed). For brevity, the default settings are listed in the Default Settings section, with only the variations from these settings noted for each example.
Default Settings
- Window Length: 60 seconds
- Bandpass Filter: No
- Tukey Window Length: 10% (i.e., 5% in Geopsy)
- Konno and Ohmachi Smoothing Coefficient: 40
- Resampling Center Frequencies:
- Minimum: 0.3 Hz
- Maximum: 40 Hz
- Number: 2048
- Type: 'log'
- Method for Combining Horizontal Components: 'squared-average'
- Distribution for f0 from Time Windows: 'normal'
- Distribution for Mean Curve: 'lognormal'
Single Window Results
Default Case: No variation from those settings listed above.
Window Length: 120 seconds.
Cosine Taper Width: 20 % (i.e., 10 % in Geopsy)
Cosine Taper Width: 0.2 % (i.e., 0.1 % in Geopsy)

Konno and Ohmachi Smoothing Coefficient: 10
Konno and Ohmachi Smoothing Coefficient: 80
Number of Points: 512

Number of Points: 4096
Release history Release notifications | RSS feed


Download files
Download the file for your platform. If you're not sure which to choose, learn more about installing packages.
Source Distribution
Built Distribution
Filter files by name, interpreter, ABI, and platform.
If you're not sure about the file name format, learn more about wheel file names.
Copy a direct link to the current filters
File details
Details for the file hvsrpy-2.1.0.tar.gz.
File metadata
- Download URL: hvsrpy-2.1.0.tar.gz
- Upload date:
- Size: 93.3 kB
- Tags: Source
- Uploaded using Trusted Publishing? No
- Uploaded via: twine/6.2.0 CPython/3.12.9
File hashes
| Algorithm | Hash digest | |
|---|---|---|
| SHA256 |
500400a3686acfe545324b4b6bf4c0c46617b5db61dfe5c6a95265985c9ea73f
|
|
| MD5 |
f84da72122f3af0ae17c50bd305b9809
|
|
| BLAKE2b-256 |
8d1aad093387fde6b283032d0264b11fa6386f33073ce8b8bcb66b870f1ec69d
|
File details
Details for the file hvsrpy-2.1.0-py3-none-any.whl.
File metadata
- Download URL: hvsrpy-2.1.0-py3-none-any.whl
- Upload date:
- Size: 96.6 kB
- Tags: Python 3
- Uploaded using Trusted Publishing? No
- Uploaded via: twine/6.2.0 CPython/3.12.9
File hashes
| Algorithm | Hash digest | |
|---|---|---|
| SHA256 |
1cd72d23fe81db3ac02575191acfafc8afdcd8ad10df3e85ffd308f1a5dd0c09
|
|
| MD5 |
995e3db5b3240d36d873f2e8bbe35d82
|
|
| BLAKE2b-256 |
403d47c85856335d51eedd34908ba1a73ca2a44c88ff12b0db2e543ecf5e5518
|


