hypecycle is the fundamental package needed for creating, visualizing, and annotating Gartner Hype Cycle with Python
Project description
Package Name: hypecycle
hypecycle is a fundamental package for creating Gartner Hype Cycle with Python. Purpose Statement:
to generate data that are Gartner Hype Cycle distributed
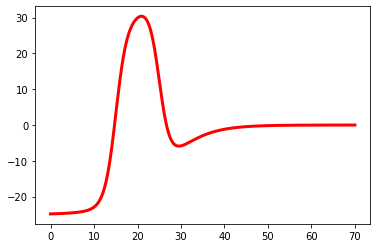
to visualize Gartner Hype Cycle curves
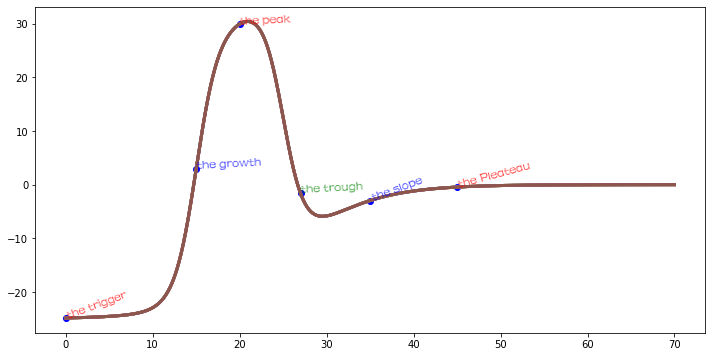
to add annotations to Gartner Hype Cycle curves
1.Source Code
1.1Dependencies
import numpy as np

import matplotlib.pyplot as plt
1.2Create
def create(*x,crest1=50,crest2=25,stp_crest1=0.8,stp_crest2=0.2,midPoint=15,var=10):

    '''
    to create a Story HypeCycle
        x: Input data
        crest1,crest2: Controlling the height of the first wave crest and the second wave crest respectively.
        stp_crest1,stp_crest2: Representing steepness.
        midPoint: The location of the mean value mainly controls the location of the first wave crest.
        var: Displaying moves or penalties for midpoint
        Recommended parameters:crest1=50,crest2=25,stp_crest1=0.8,stp_crest2=0.2,midPoint=15,var=10
        x = np.linspace(0, 50, 5000)
    '''
    x = x
    # If user doesn't submit submit x, it will create a default DataSet.
    if x==():
        x = np.linspace(0, 70, 5000)
    else:
        x=x[0]

    lf_11 = crest1/(1+ np.exp( 1 * stp_crest1 * (x-midPoint-var)))
    lf_12 = crest1/(1+ np.exp( 1 * stp_crest1 * (x-midPoint)))
    lf_13 = crest2/(1+ np.exp( 1 * stp_crest2 * (x-midPoint-var)))
    hype= lf_11- lf_12- lf_13
    return hype
1.3Visualize
def visualize(*x, color="red", linewidth=3, linestyle="-"):

    """
     to visualize the HypeCycle Data into a HypeCycle Curve
    """
    x = x
    # If user doesn't submit submit x, it will create a default DataSet.
    if x==():
        x = np.linspace(0, 70, 5000)
    else:
        x=x[0]

    plt.plot(x, create(x), linewidth = linewidth, c = color,linestyle = linestyle)
1.4Annotate
def annotate(*x, x_value = 20, text = "None",color = "red",fontproperties='FZShuTi', fontsize = 13, alpha = 0.8,rotation=3):

    """
     to annaotate the HypeCycle Curve
    """

    x = x
    # If user doesn't submit submit x, it will create a default DataSet.
    if x==():
        x = np.linspace(0, 70, 5000)
    else:
        x=x[0]

    plt.plot(x, create(x), linewidth=3)

    x_val = x_value
    t = text
    c = color
    fp= fontproperties
    fs = fontsize
    a = alpha

    plt.rcParams["figure.figsize"] = [12, 6]
    plt.scatter(x_val, create(x_val), color="blue")
    plt.text(x_val, create(x_val), t ,color=c,fontproperties= fp, fontsize=fs, alpha=a,rotation=rotation)
2.Installing
pip install hyperycle
3.Usage
from hypecycle import HypeCycle
4.Examples
4.1Importing hypecycle
from hypecycle import HypeCycle as hc
4.2Testing Data
import numpy as np
x = np.linspace(0, 50, 5000)
x
array([0.00000000e+00, 1.00020004e-02, 2.00040008e-02, ...,
       4.99799960e+01, 4.99899980e+01, 5.00000000e+01])
4.3API-Create
# Default
y = hc.create( )
y
array([-2.48323716e+01, -2.48319021e+01, -2.48314312e+01, ...,
       -3.10218943e-03, -3.09351479e-03, -3.08486440e-03])
# With parameters
y = hc.create(x)
y
array([-24.83237162, -24.83203636, -24.83170041, ...,  -0.16798742,
        -0.16765397,  -0.16732117])
4.4API-visualize
# Default diagram
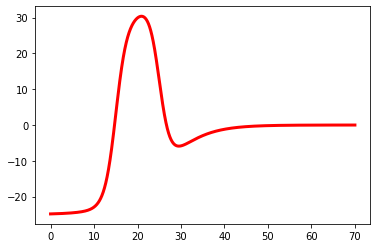
hc.visualize()

# Custom chart
x = np.linspace(0, 70, 5000)
hc.visualize(x,"blue",8)

4.5API-anotate
hc.annotate(x,x_value = 0,text = "the trigger",rotation=20)
hc.annotate(x,x_value = 15,text = "the growth",color="blue")
hc.annotate(x,x_value = 20,text = "the peak",color="red")
hc.annotate(x,x_value = 27,text = "the trough",color="green")
hc.annotate(x,x_value = 35,text = "the slope",color="blue",rotation=20)
hc.annotate(x,x_value = 45,text = "the Pleateau",color="red",rotation=15)

6.Citation
If hypecycle contributes to a project that leads to a scientific publication, please acknowledge this fact by citing the project.
Project details
Release history Release notifications | RSS feed
Download files
Download the file for your platform. If you're not sure which to choose, learn more about installing packages.
Source Distribution
hypecycle-0.5.2.tar.gz
(35.1 kB
view hashes)
Built Distributions
hypecycle-0.5.2-py3.7.egg
(8.2 kB
view hashes)
Close
Hashes for hypecycle-0.5.2-py3-none-any.whl
| Algorithm | Hash digest | |
|---|---|---|
| SHA256 | 76798bddcbb5c11bda5fe1f6cdc0a8ae3df4579e5381aacd45908959dc9a6a9e |
|
| MD5 | 45af8e8796e622d0ea78d8c5fcb03e3e |
|
| BLAKE2b-256 | 7c29ffbc758a1fb71de902869adef66424ab5ab2315c23911df514366aefc9a2 |


