ibcs-plotly
Interactive IBCS-compliant business charts on Plotly, with optional Streamlit components.
IBCS (International Business Communication Standards) fixes a small set of
rules for business reports: current-period and comparison-period values get
consistent colors, variance gets its own consistent colors, composition
charts are sorted bars instead of pies, and comparable small multiples share
one scale. This library gives you those chart types as plain functions that
return a plotly.graph_objects.Figure, plus a thin Streamlit layer for KPI
cards and the AC/PY/variance legend.
There's an existing IBCS-inspired Python package, clean_business_chart, built on matplotlib. This one targets interactive dashboards (Plotly + Streamlit) rather than static reports.
Install
pip install ibcs-plotly            # core: plotly + pandas + numpy
pip install ibcs-plotly[streamlit] # + Streamlit KPI cards / legend
Quick example
from ibcs_plotly import grouped_column, compare_periods

df_ac, df_py, py_year = compare_periods(df, period_col="year", current=2026)

fig = grouped_column(
    ac=df_ac.groupby("month")["revenue"].sum(),
    py=df_py.groupby("month")["revenue"].sum(),
    labels=month_names,
)
fig.show()
See examples/streamlit_demo.py for a full
dashboard on synthetic data — run it with:
pip install -e ".[streamlit]"
streamlit run examples/streamlit_demo.py
Plan charts with AI (MCP)
ibcs_plotly.planner profiles a dataset, works out what can be calculated
(variance AC-PY, variance %, share, rank, trend, rolling, YTD), and emits a
plan of IBCS chart specs that a developer - or an agent - can build from.
An MCP server exposes this to any MCP-capable assistant.
The operator decides how much of the data the AI may see; the AI can ask for less per call, never more:
| Tier | The AI receives |
|---|---|
SCHEMA |
column names, dtypes, inferred roles (measure / dimension / time / period / id) |
STATS |
+ null %, min/max/mean, date ranges, top categories (groups under 5 rows are hidden; the leftover rows are reported as other_rows and never total fewer than 5, so subtraction cannot recover them) |
SAMPLE |
+ a small random row sample |
FULL |
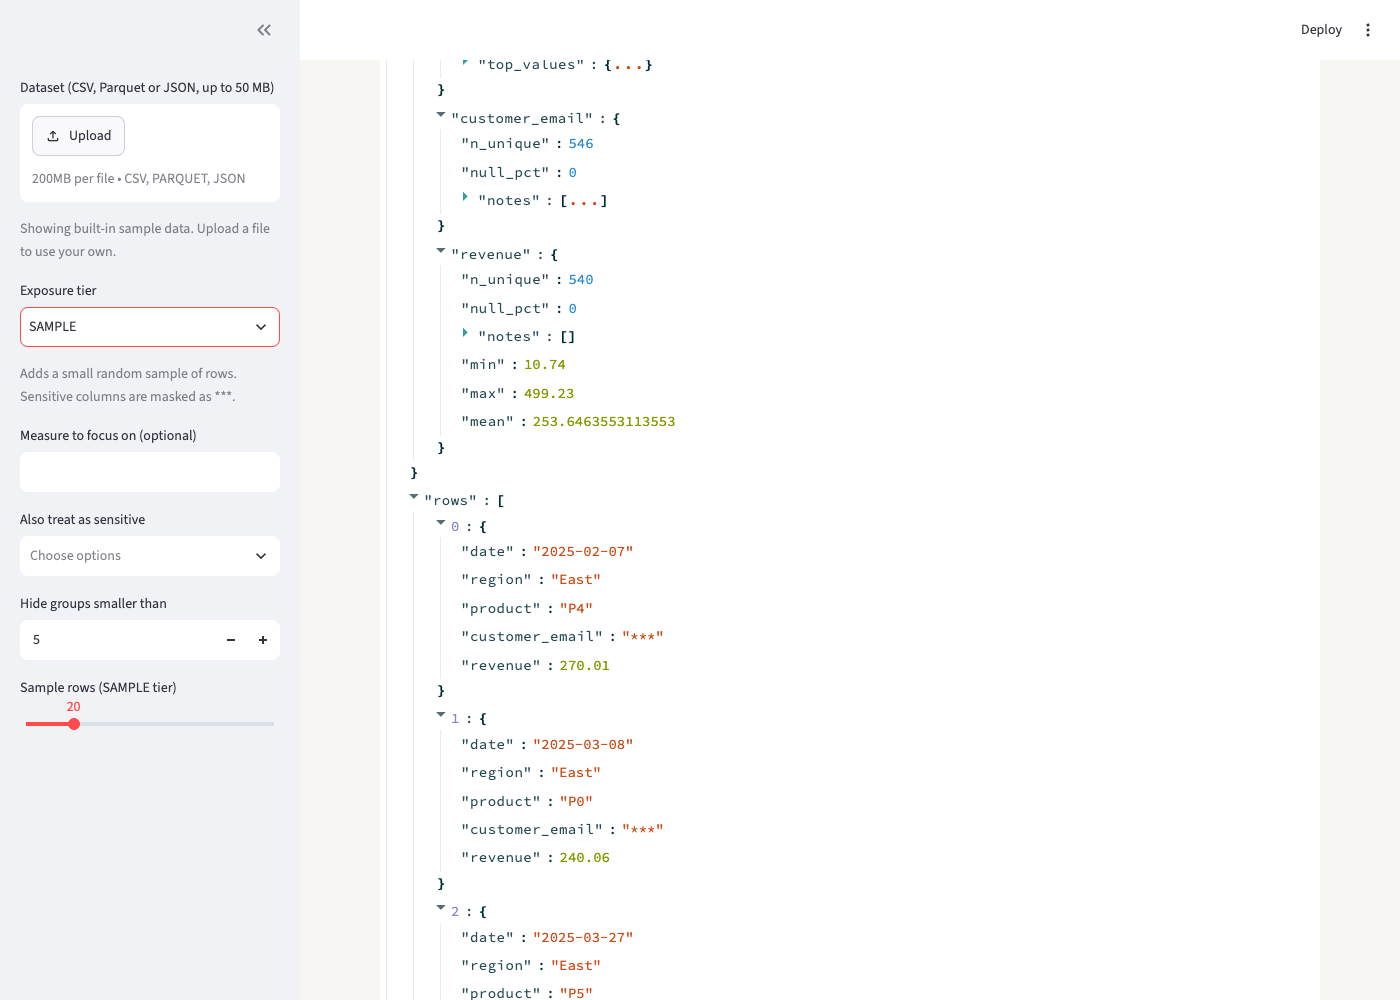
+ all rows (capped). PII columns are masked in SAMPLE/FULL by default |
pip install "ibcs-plotly[mcp]"
IBCS_MCP_DATA_DIR=./data IBCS_MCP_MAX_TIER=STATS ibcs-plotly-mcp
Tools: load_dataset, describe_dataset, plan_charts, llm_context_bundle,
check_chart, render_chart.
Charts are always rendered locally on the full data; the AI only gets back a
file path. Without MCP, the same pieces work as a library:
from ibcs_plotly.planner import build_plan, render_spec
plan = build_plan(df, tier="STATS")
print(plan.to_markdown())
render_spec(df, plan.charts[0]).show()
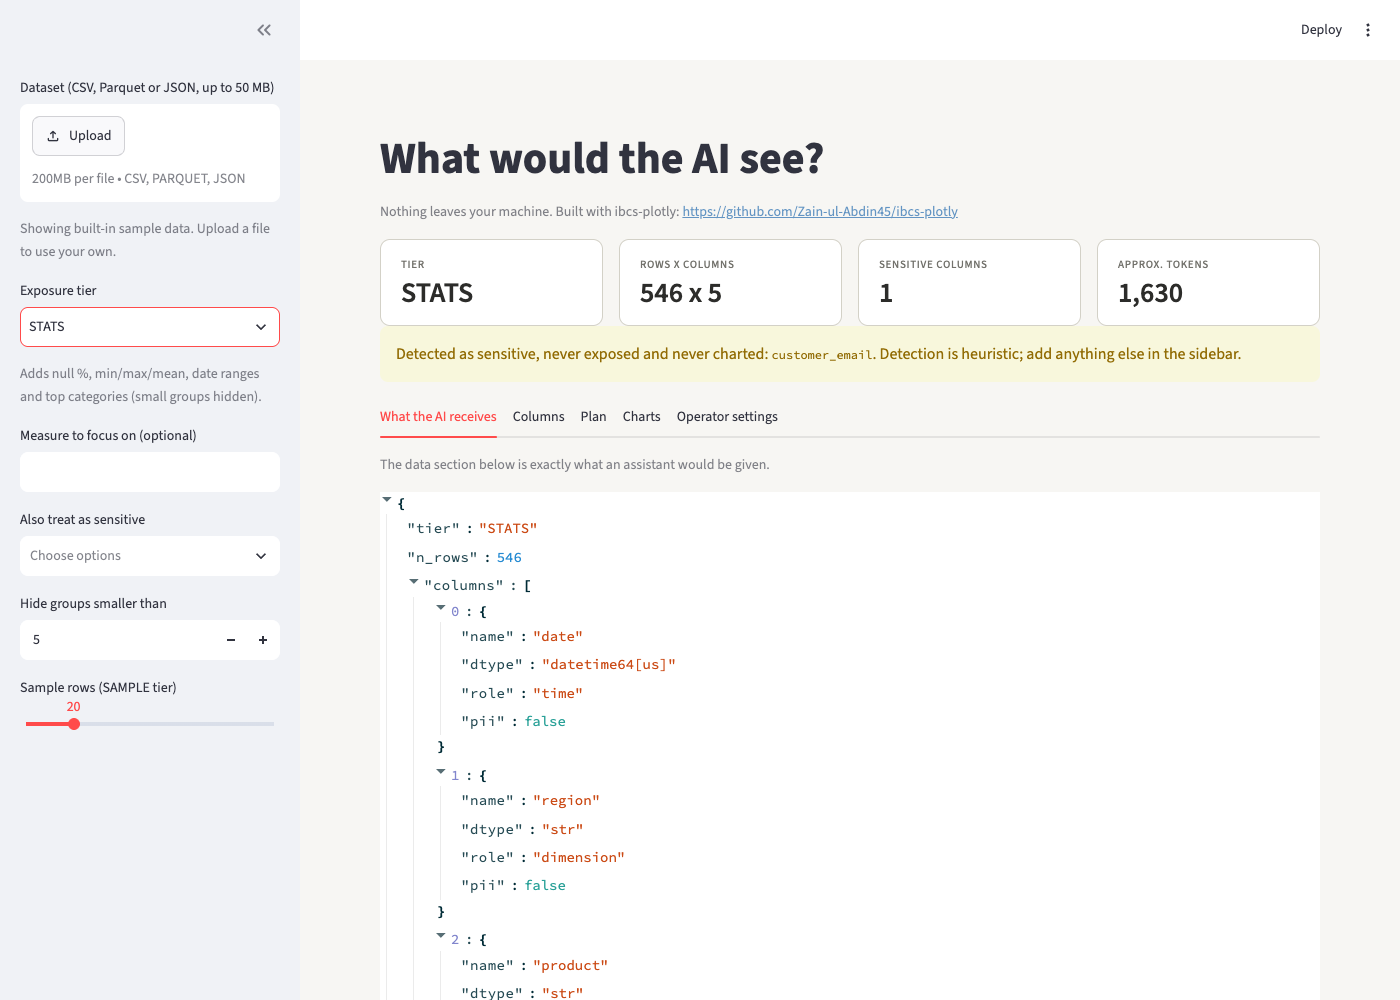
Exposure preview
streamlit run examples/exposure_preview.py shows exactly what an assistant would receive from your data
at each tier, before you connect anything. Upload a file (or use the built-in sample), pick a tier, mark extra
sensitive columns, and read the JSON, the plan and the charts. The last tab prints the matching MCP server
settings. Nothing leaves your machine.
At the SAMPLE tier the email column is masked in every row:
LLM-ready export and compliance check
from ibcs_plotly.planner import llm_context, estimate_tokens, to_json
ctx = llm_context(df, tier="STATS", goal="revenue by region")  # instructions + data view + plan
print(estimate_tokens(ctx))        # check it fits the prompt before pasting
prompt_payload = to_json(ctx)

from ibcs_plotly import check_figure
for f in check_figure(fig):        # works on any Plotly figure
    print(f.severity, f.rule, f.message)
check_figure flags pies, 3D, truncated bar axes, unshared small-multiple
scales, wrong AC/PY/variance colors, too many categories and color noise.
It checks only what is mechanically verifiable from the figure; it cannot
judge titles, units or message quality.
Tested on real data
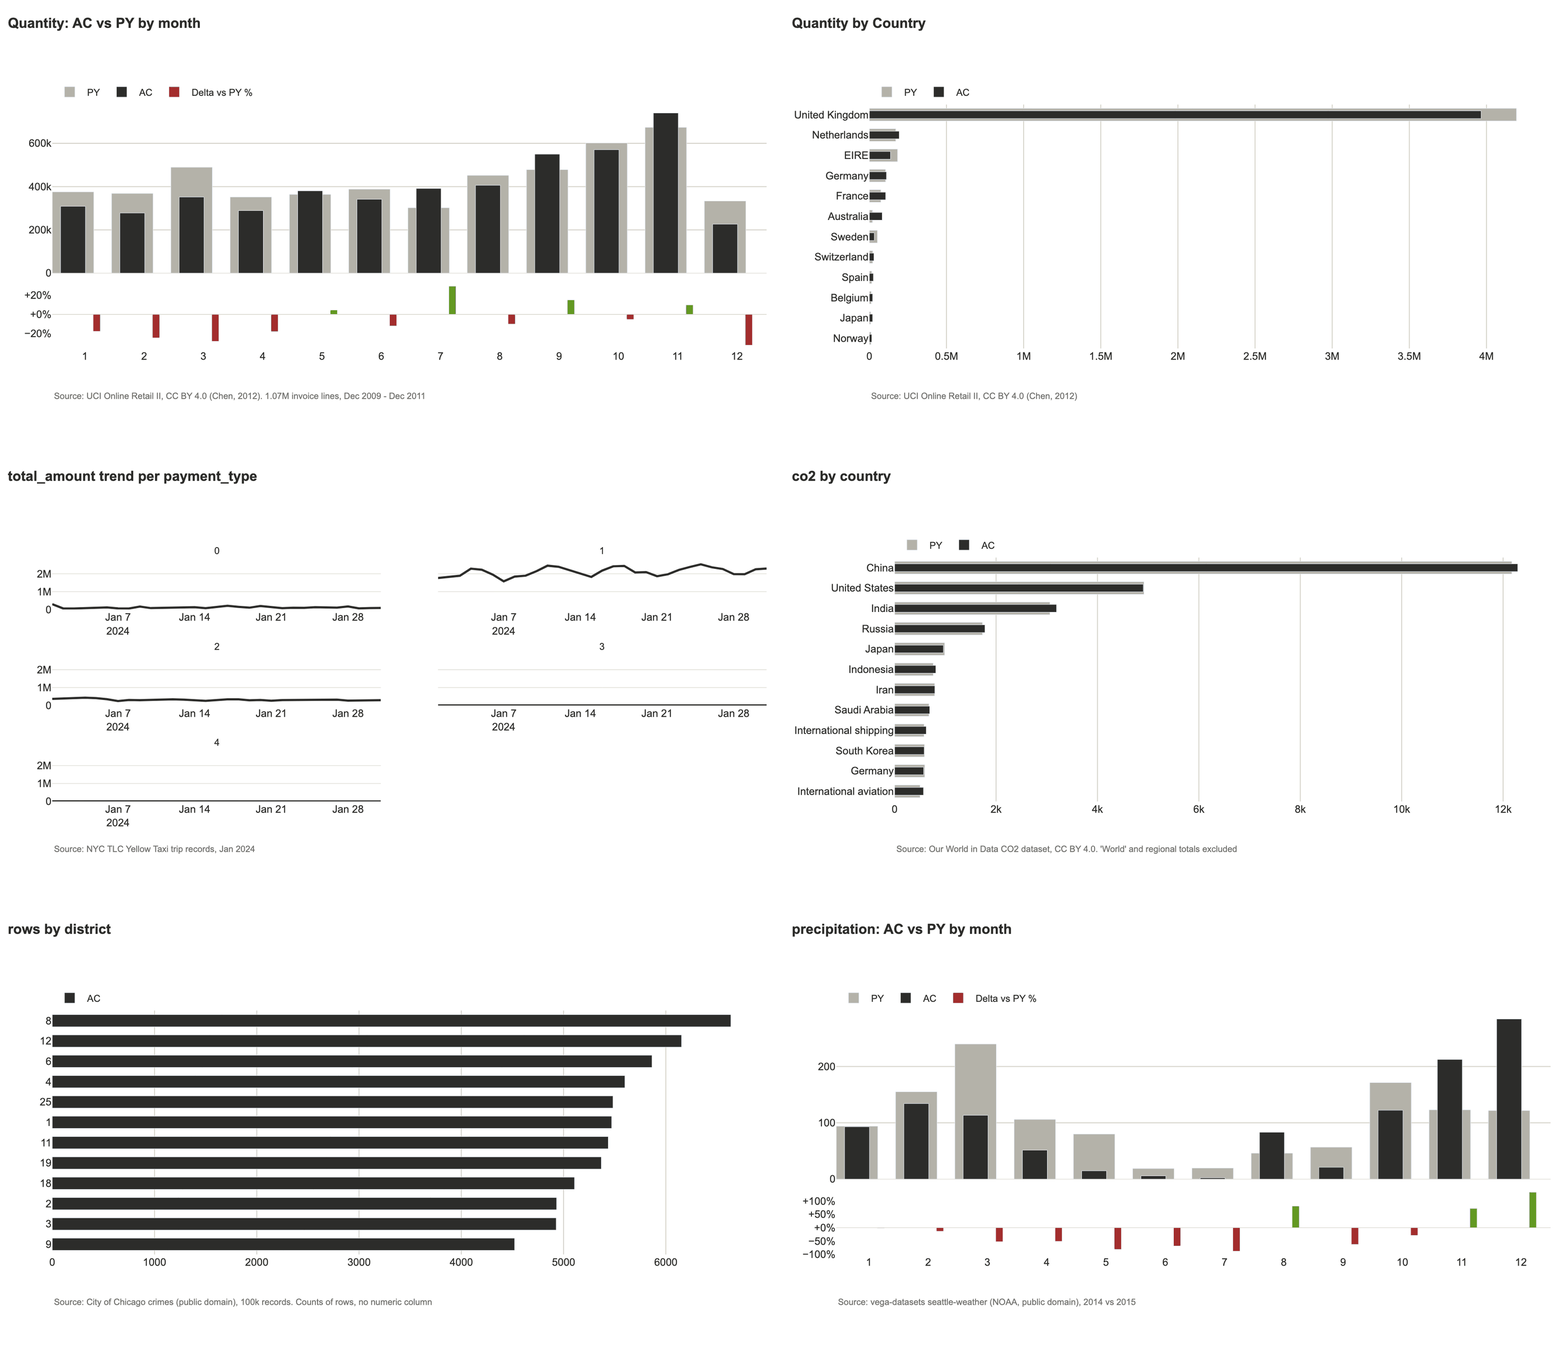
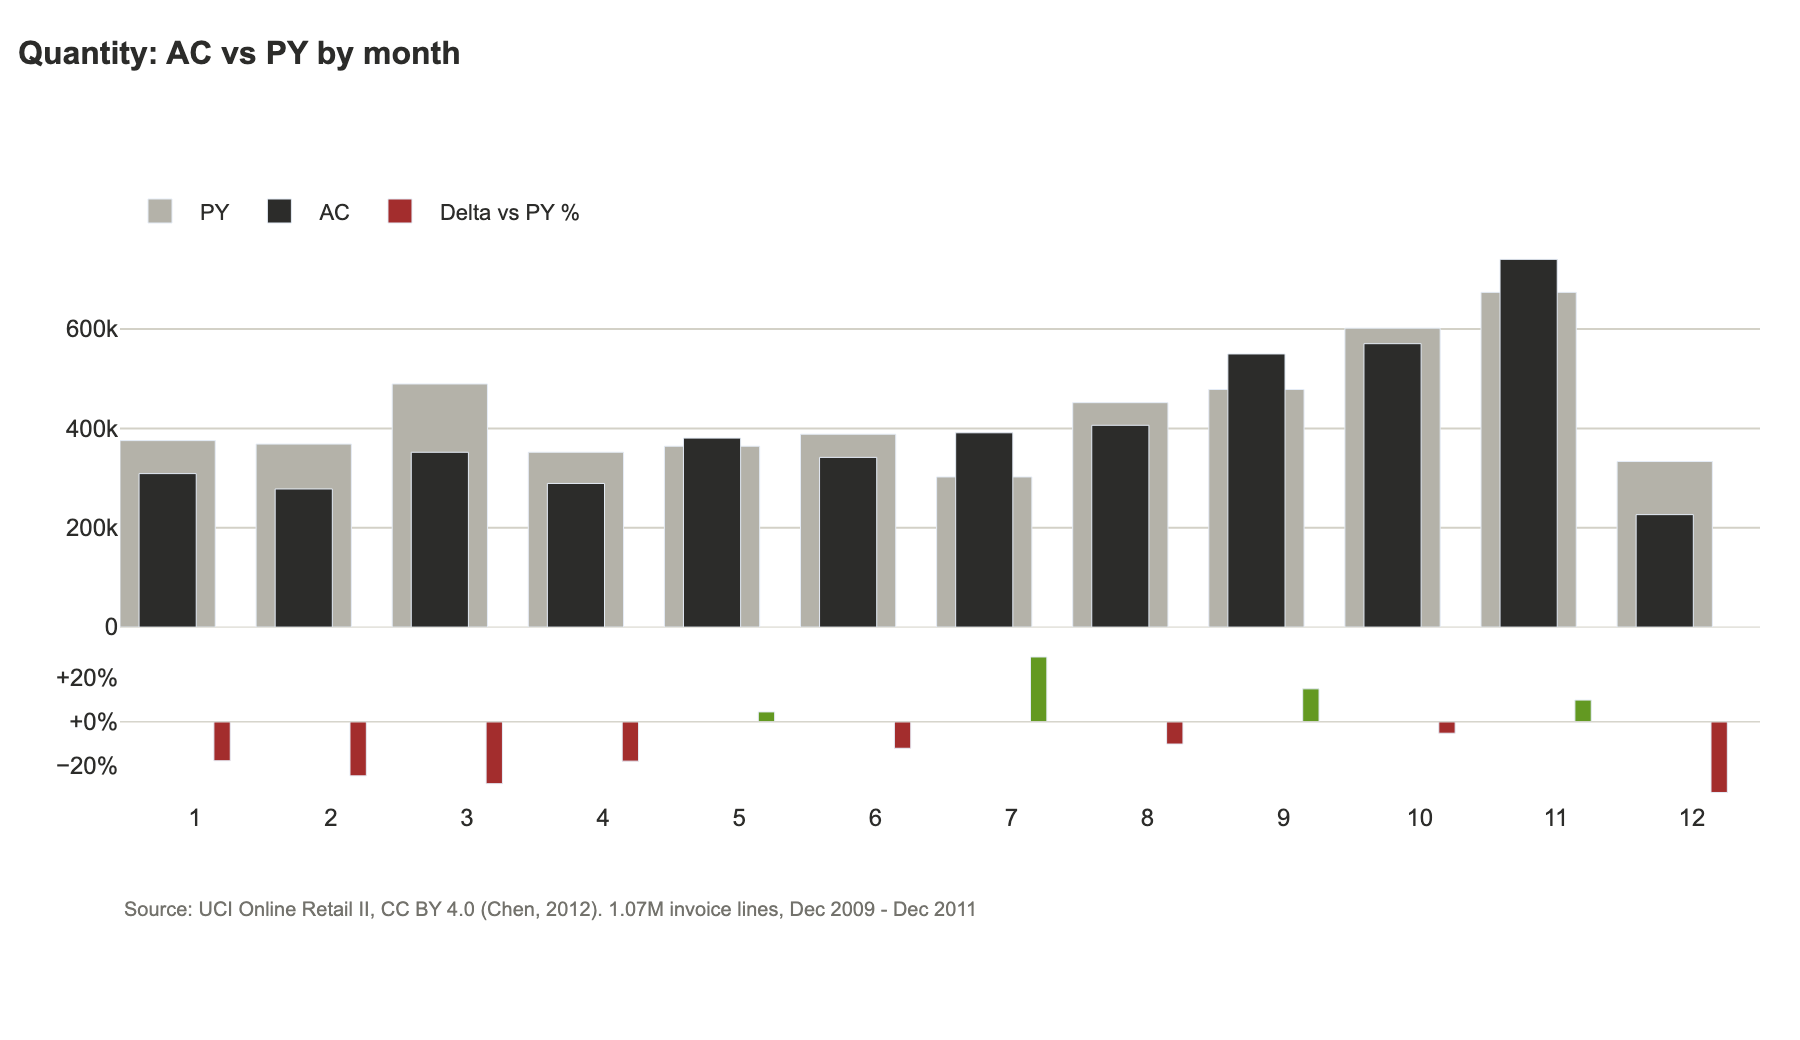
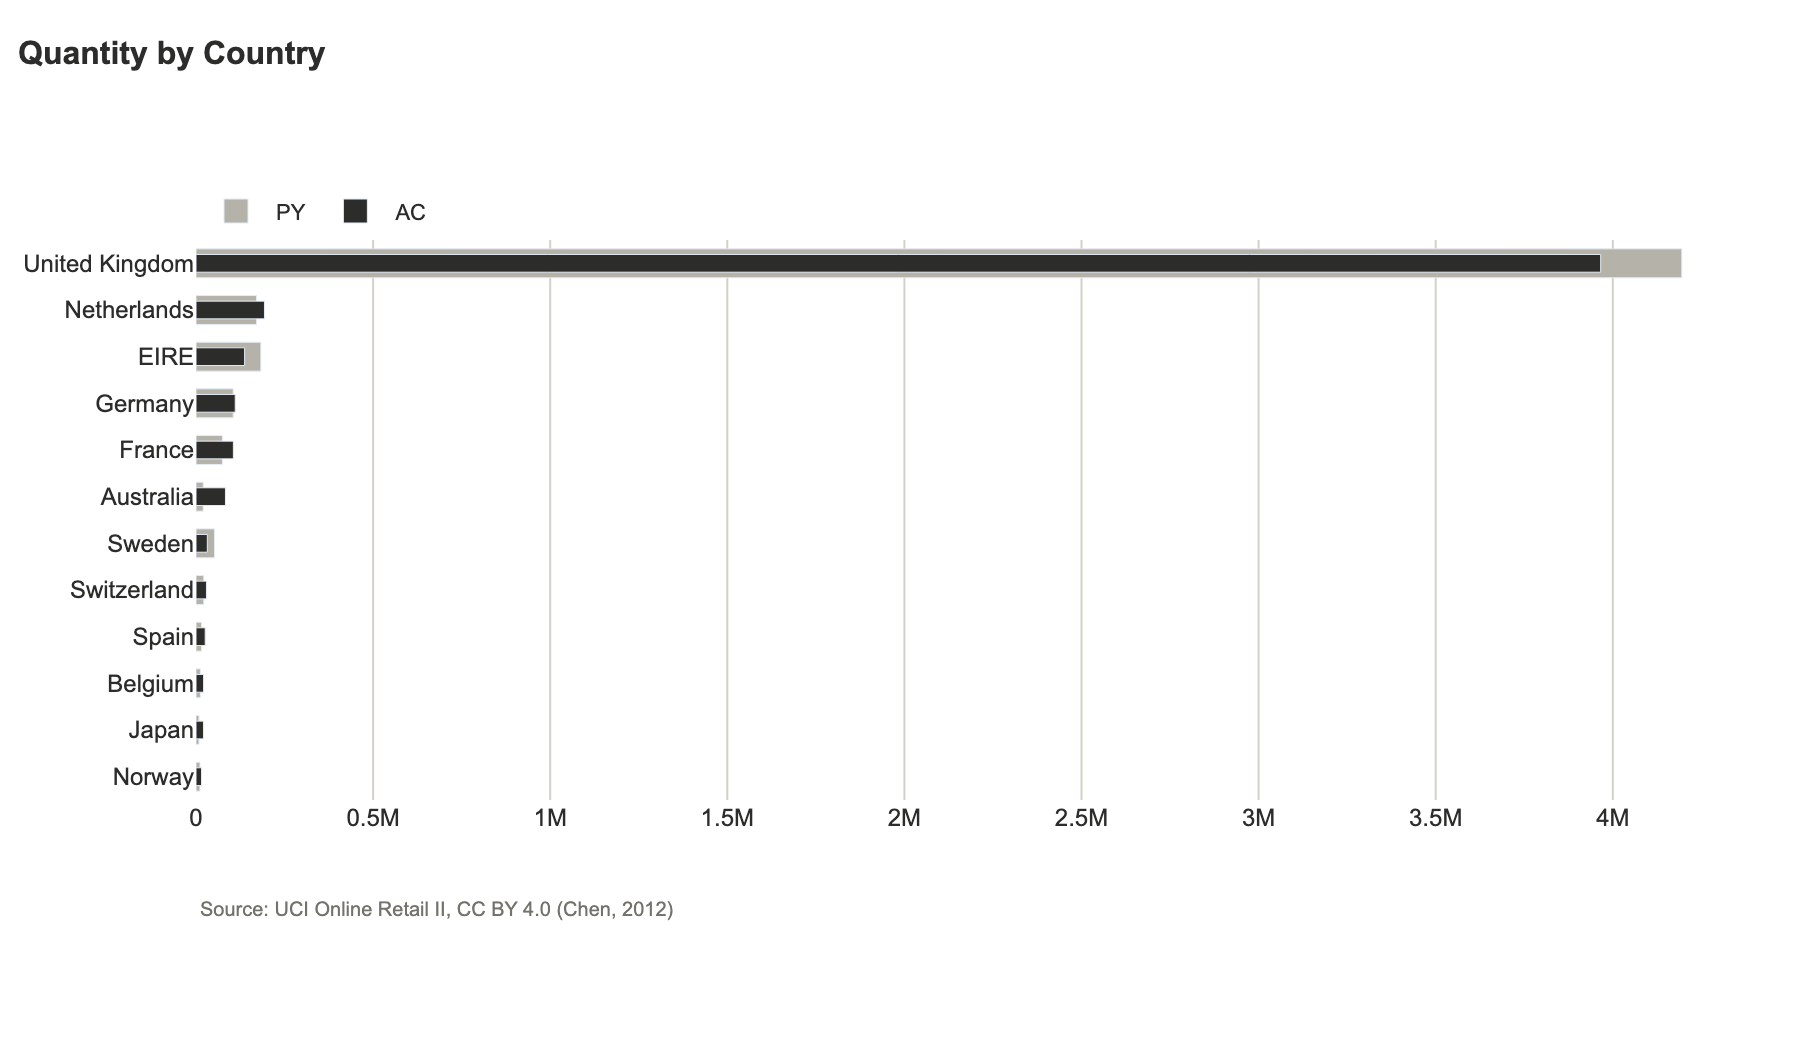
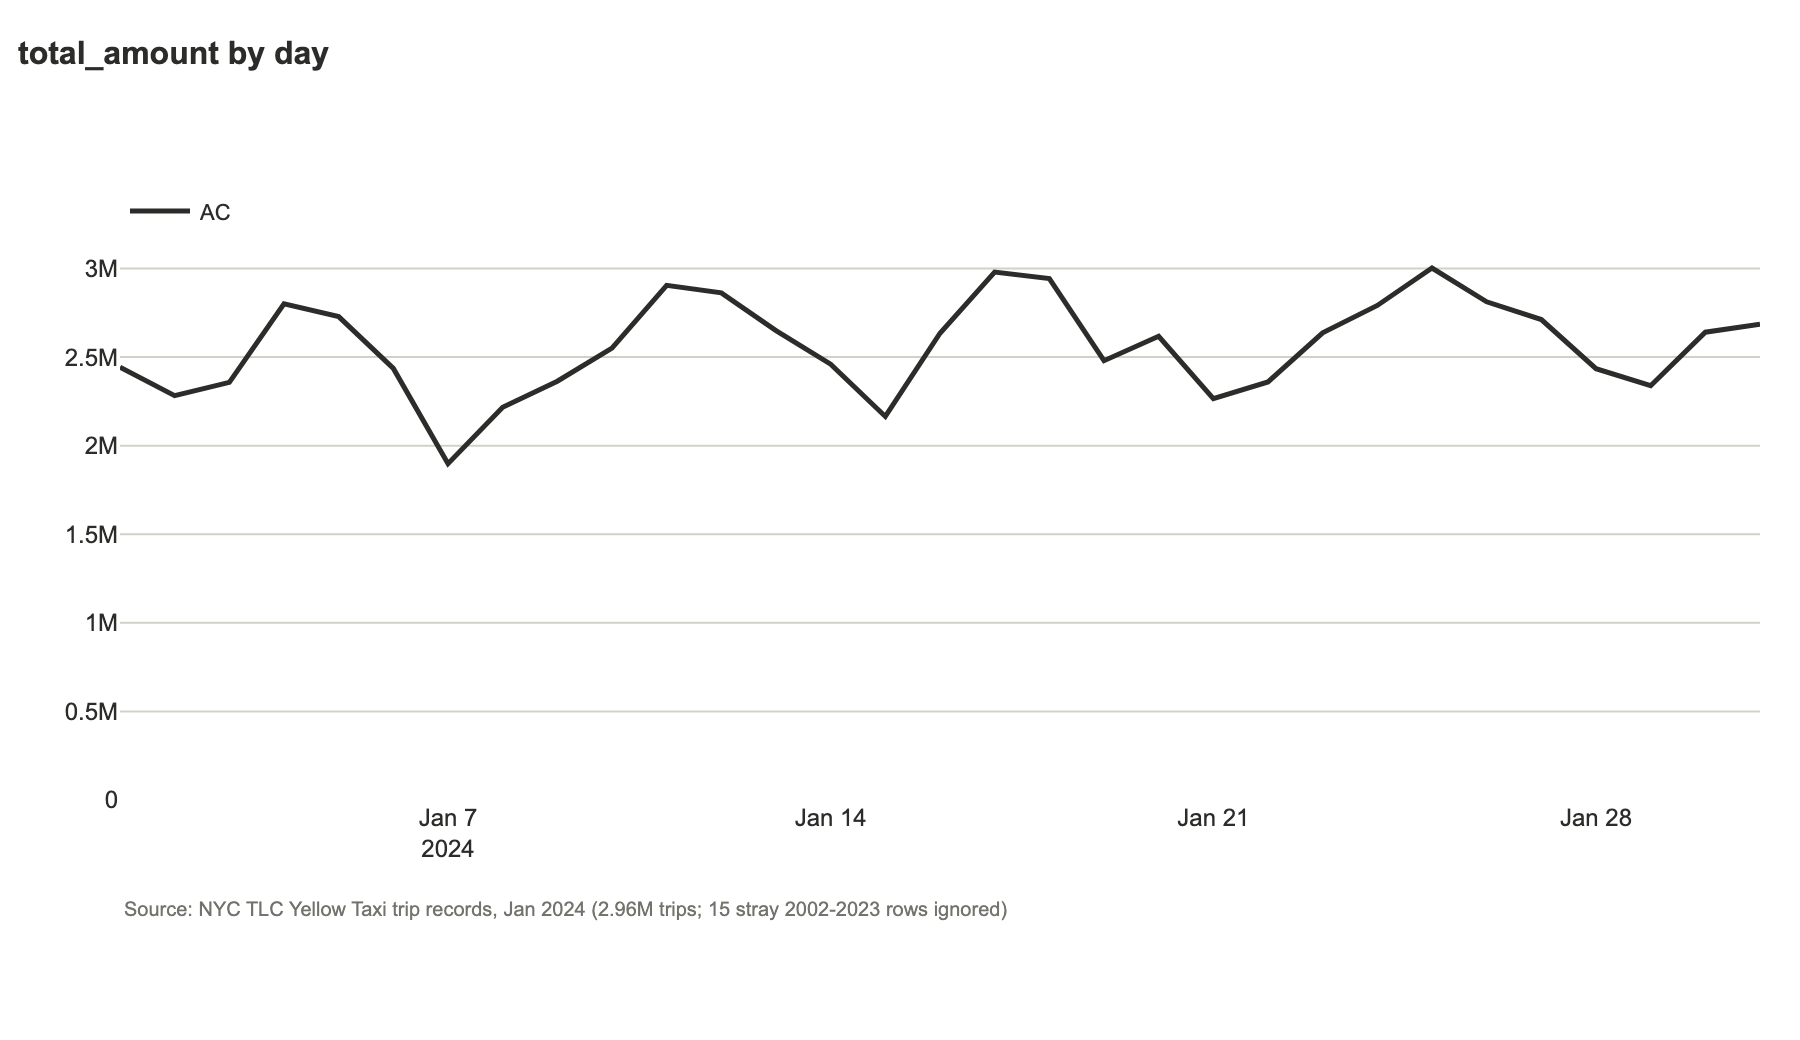
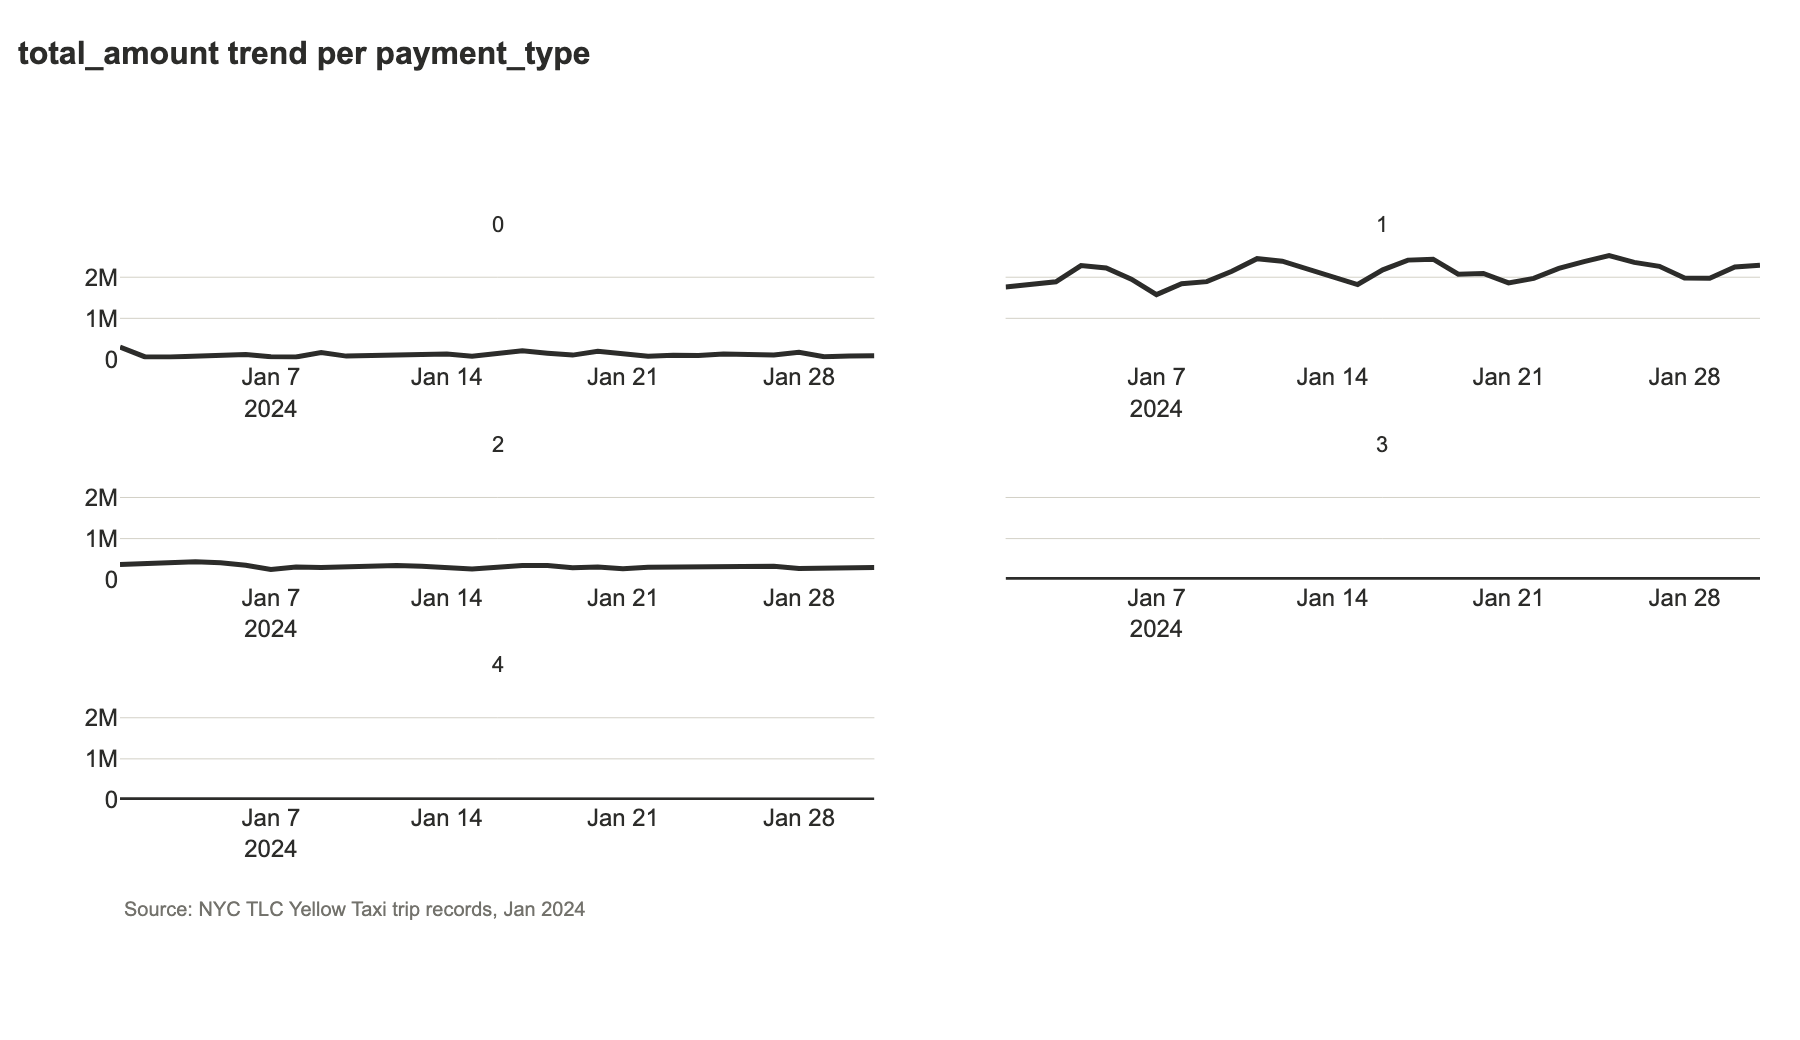
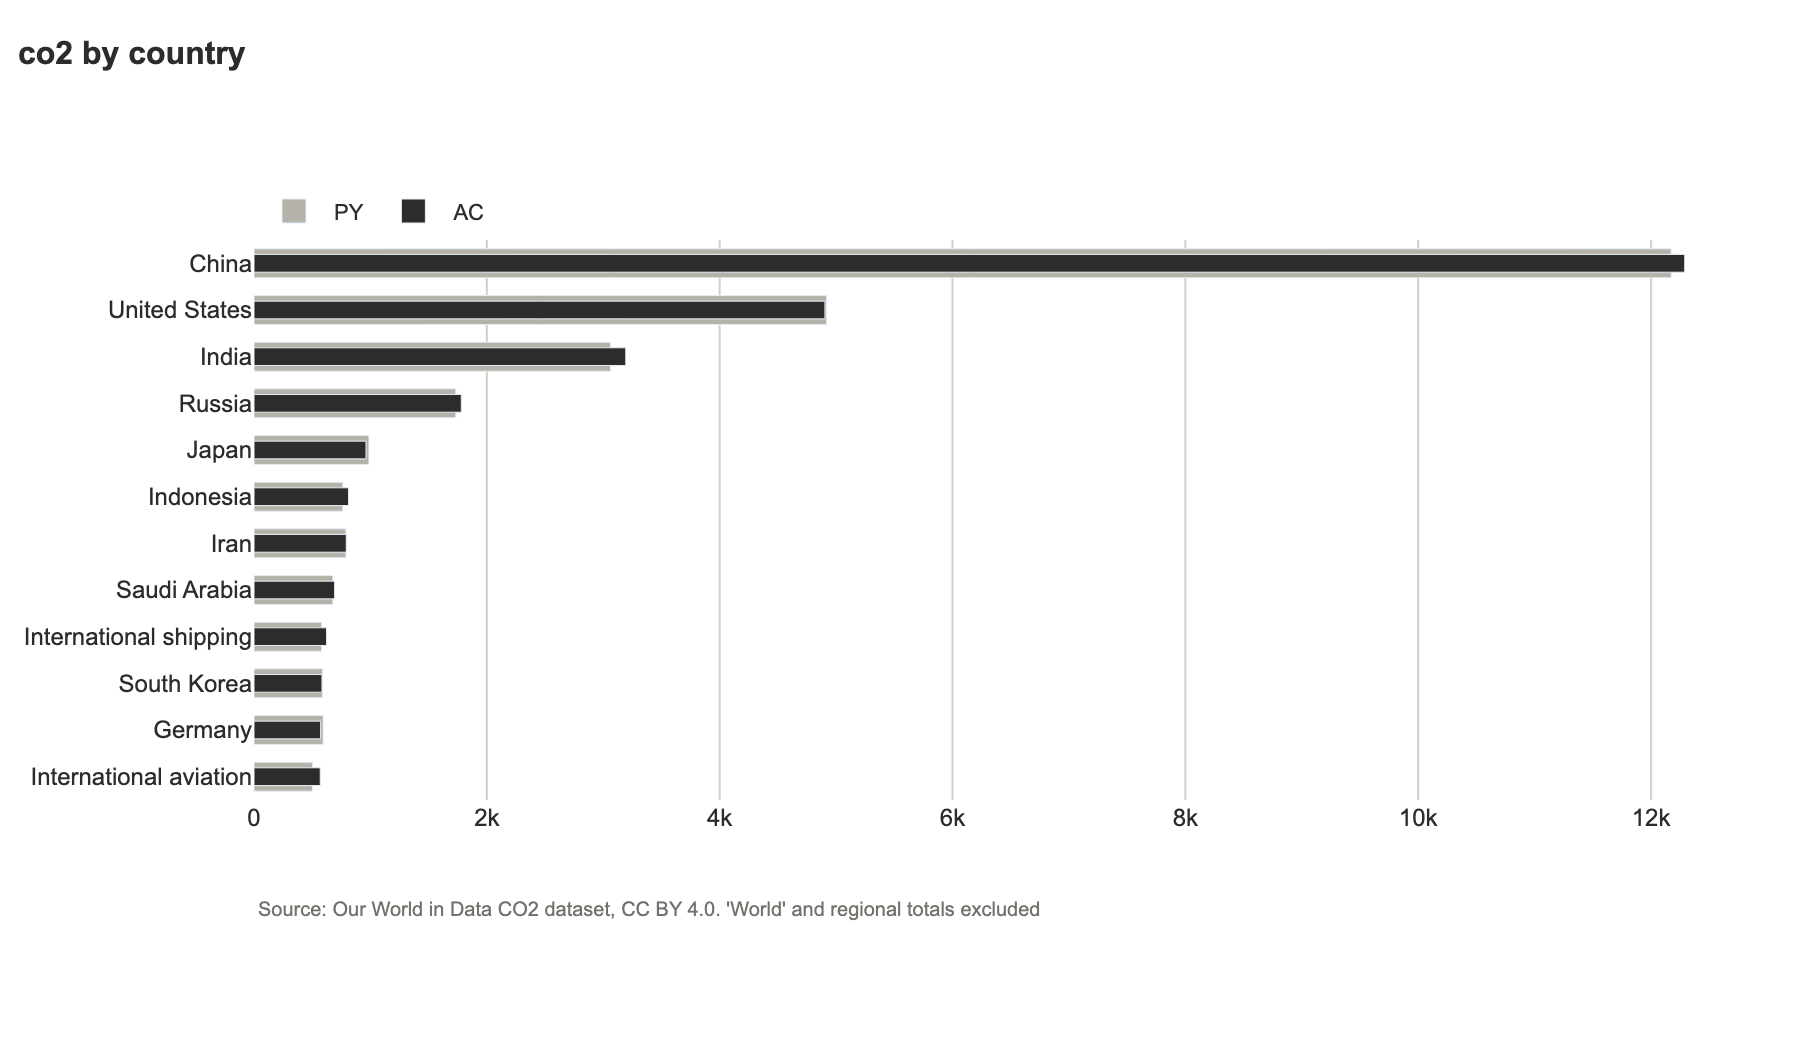
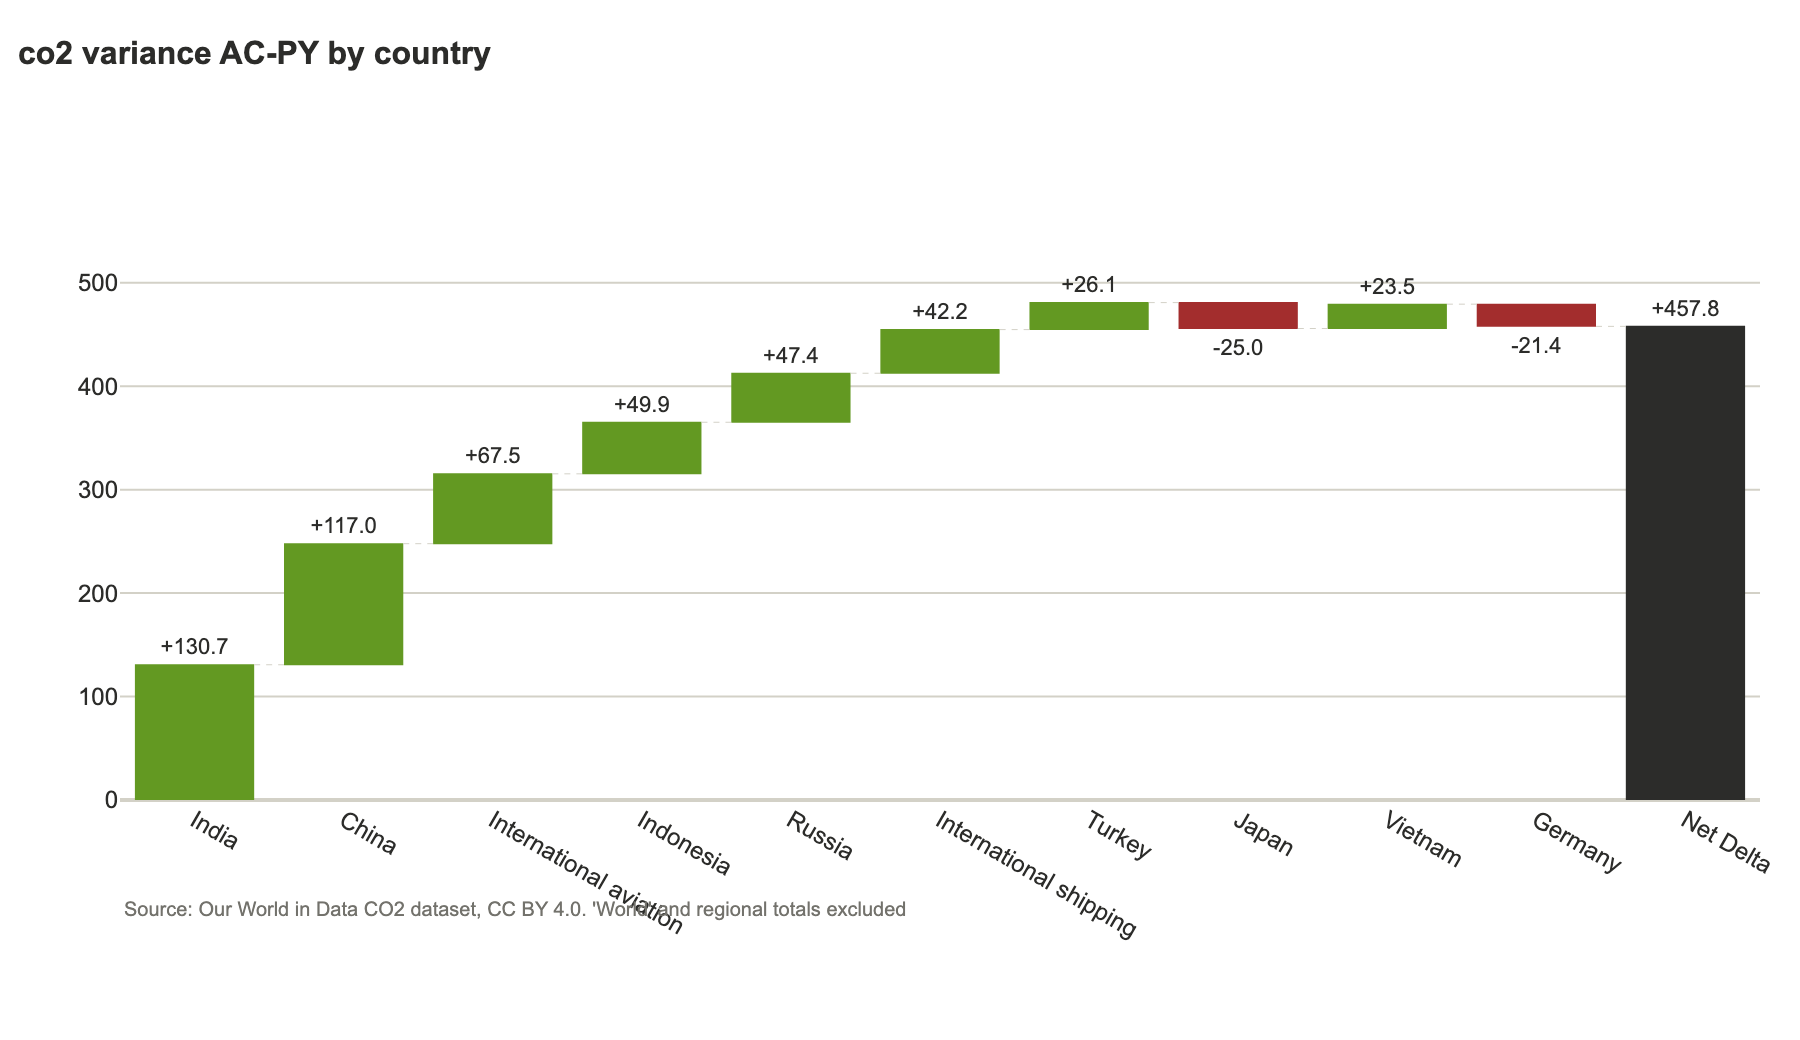
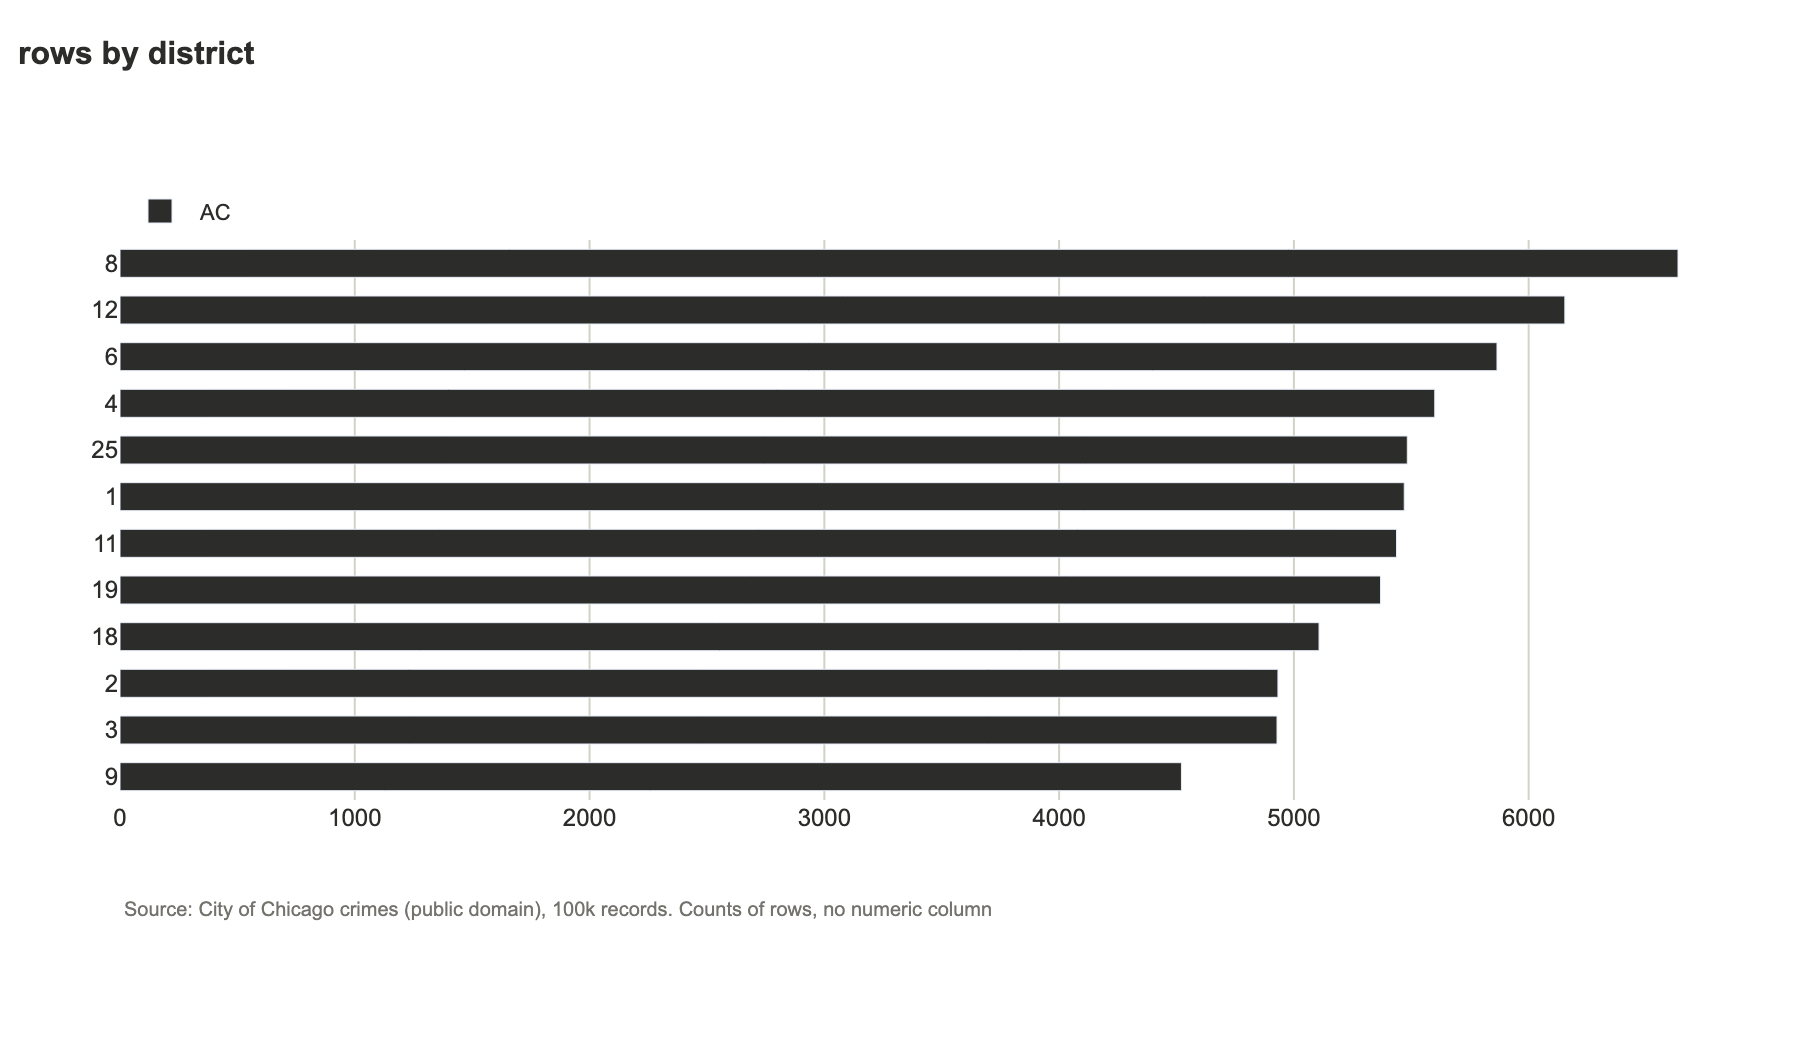
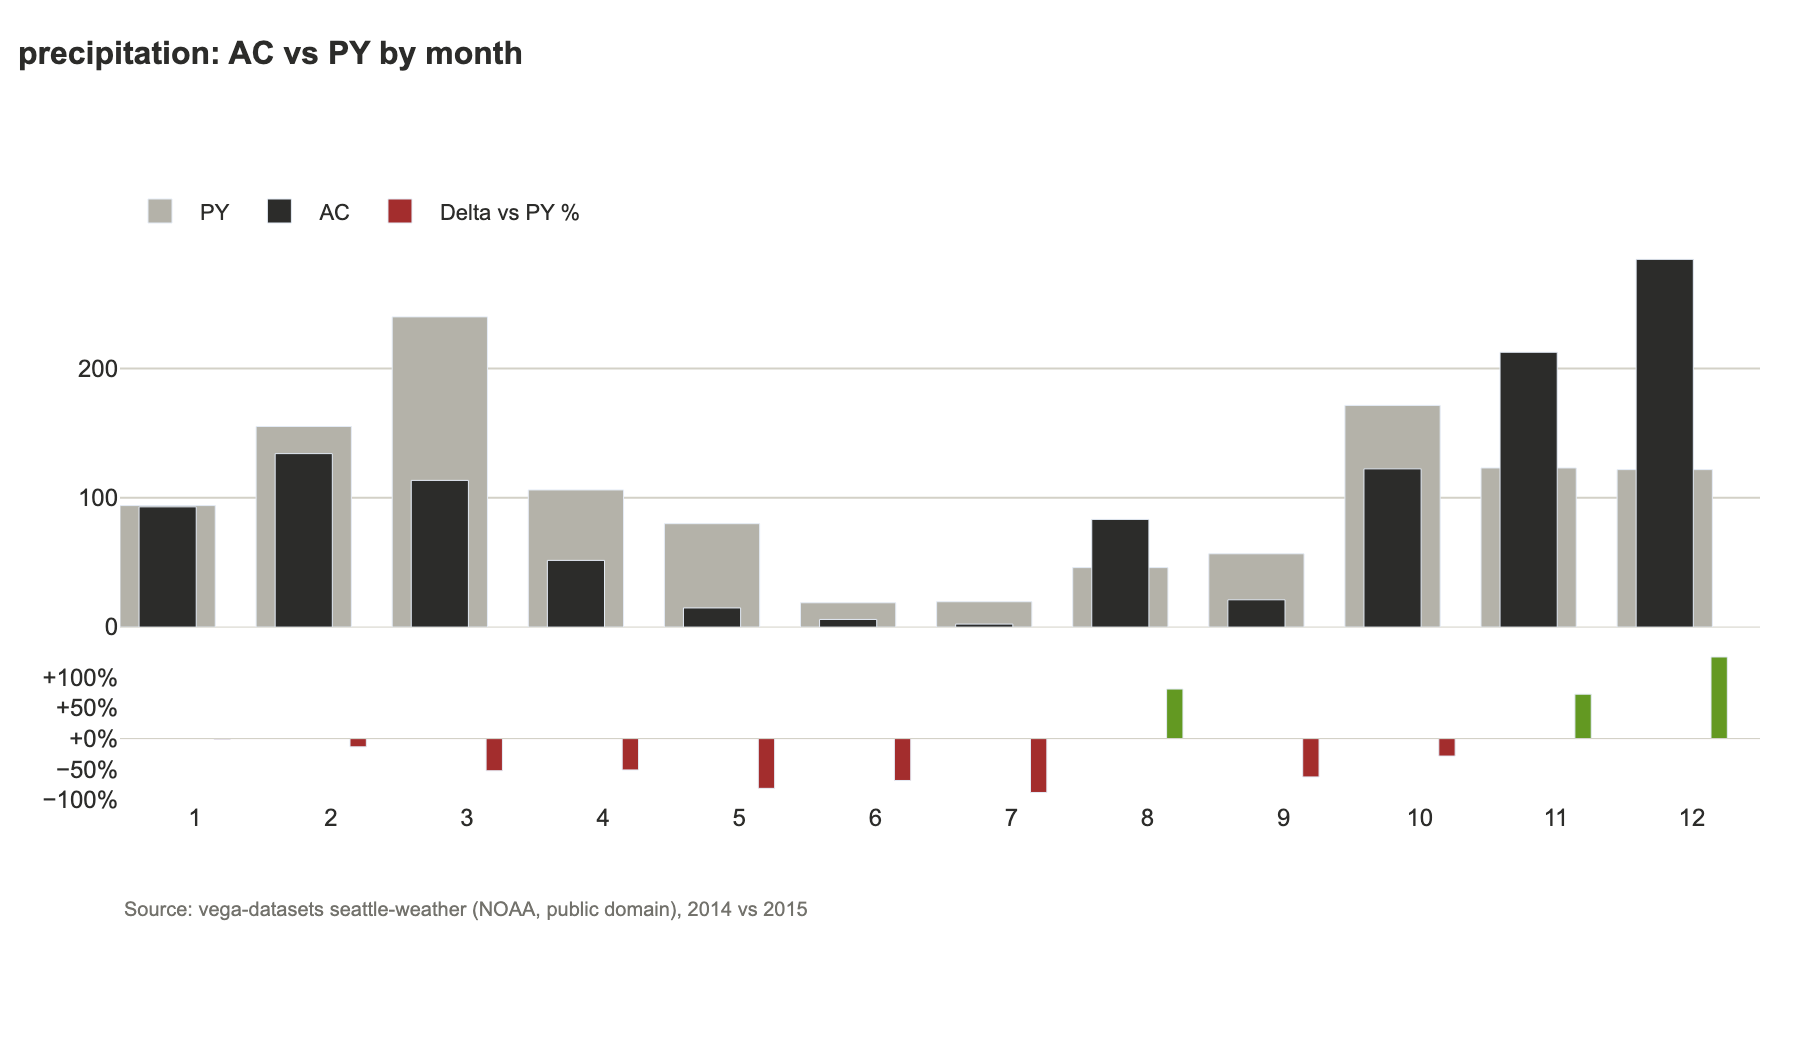
Every chart above and below is the planner's own output for a real public dataset (nothing hand-drawn); each image carries its source and licence.
| Chart | Dataset | What it shows |
|---|---|---|
| AC vs PY by month | UCI Online Retail II | 2011 against the same dates of 2010 |
| Bars by country | UCI Online Retail II | ranked, AC over PY |
| Daily trend | NYC taxi, Jan 2024 | daily grain because the data spans one month |
| Small multiples | NYC taxi, Jan 2024 | one scale across panels |
| Bars by country, variance | Our World in Data CO2 | "World" and regional totals excluded |
| Row counts by district | Chicago crimes | no numeric column, so it counts events |
| AC vs PY by month | Seattle weather | 2015 against 2014 |
What was tested
The test suites are kept out of this repository (unit tests, seed data, the downloaded datasets, the
harnesses and their reports all live in git-ignored tests/ and testdata/), and were run locally before
release. CI runs lint, an import check of every module, and an end-to-end smoke test of plan, render and lint.
| Suite | Data | Checks | Covers |
|---|---|---|---|
| Unit tests | small crafted frames | 112 | roles, tiers, plans, rendering, lint, MCP session, HTML escaping |
| Synthetic harness | 53 generated files | 2,351 | edge cases: negatives, nulls, infinities, 500k rows, 200 columns, a dozen date formats, hidden and obvious PII, prompt-injection text, path escapes, bad files |
| Real-data harness | 14 open datasets (below) | 559 | all four exposure tiers; no cell text at SCHEMA; small groups hidden at STATS and not recoverable by subtraction; PII never exposed; chart totals re-computed with plain pandas; plausibility review |
| MCP end to end | stdio server | 1 script | all six tools, tier ceiling, path-traversal refusals |
| Assistant test | real Claude sessions using the MCP server, no other tools | 12 prompts | tier ceilings respected, PII masked, small groups hidden, prompt injection in the data not obeyed, path escape refused |
| Dataset | Licence | Rows | Stresses |
|---|---|---|---|
| UCI Online Retail II | CC BY 4.0 | 1,067,371 | cancellations and returns, mixed-type invoice ids, missing customer ids |
| NYC TLC yellow taxi, Jan 2024 | open data | 2,964,624 | stray dates from 2002/2009/2023, negative fares, float counts with NaN |
| NYC 311, Jan 2024 | public domain | 100,000 | street addresses, free text, many sparse columns |
| Chicago crimes 2023 (sample) | public domain | 100,000 | code columns, coordinates, no numeric measure |
| Our World in Data CO2 | CC BY 4.0 | 50,411 | 79 columns, heavy missing data, regional totals beside countries |
| Movies, cars, gapminder, stocks | vega-datasets | 406 to 3,201 | text dates, JSON, nulls |
| Seattle weather, flights, titanic, penguins, diamonds | NOAA, seaborn-data | 144 to 53,940 | month names, small groups, no time column |
Real data found problems synthetic data did not, all fixed and covered by unit tests: code columns such as
zip, district and iucr read as measures or dates; invoice ids with cancellation prefixes turned
into numbers and blanked; latitude and longitude summed; regional totals double counted; stray dates
picked as the comparison year; a part-year compared with a full year; monthly lines for one month of data;
street addresses missed as PII; ID-like columns charted as categories.
Not covered: charts are never judged for meaning (only for the rules listed above), PII detection is heuristic, and derived measures such as quantity times price are not built for you.
Charts built from CC BY datasets credit their sources in the image: Our World in Data, "CO2 and Greenhouse Gas Emissions" (CC BY 4.0); Chen, D. (2012), "Online Retail II", UCI Machine Learning Repository (CC BY 4.0).
What's included
-
grouped_column,horizontal_bar,variance_waterfall,small_multiples,line_comparison— chart primitives, framework-agnostic -
compare_periods,safe_delta_pct— period-over-period comparison helpers -
IBCSTheme— colors/layout as a dataclass you can override -
ibcs_plotly.streamlit_ext—kpi_card,legend_html,inject_theme_css -
ibcs_plotly.planner— dataset profiling, exposure tiers, chart plans, spec renderer, LLM export -
ibcs_plotly.check_figure— IBCS compliance checker for any Plotly figure -
ibcs_plotly.mcp_server— MCP server (ibcs-plotly-mcp) for AI-assisted chart planning
Not in scope yet: matplotlib/other backends, PDF/PPT export.
License
MIT
1 maintainer

Metadata
1 maintainer
Release files for ibcs-plotly 0.2.2
For a detailed explanation of source distributions (sdists) and built distributions (wheels), please see the package formats documentation.
Source distribution (sdist)
| File | Size | Uploaded | Provenance | Actions |
|---|---|---|---|---|
| ibcs_plotly-0.2.2.tar.gz | 1.6 MB | Without provenance | Details for ibcs_plotly-0.2.2.tar.gz |
Built distribution (wheel)
| File | Interpreter | ABI | Platform | Actions Reset |
|---|---|---|---|---|
| ibcs_plotly-0.2.2-py3-none-any.whl | Python 3 | none | any | Details for ibcs_plotly-0.2.2-py3-none-any.whl |
Total release size: 1.6 MB
Release files / ibcs_plotly-0.2.2.tar.gz
| Download URL | ibcs_plotly-0.2.2.tar.gz |
|---|---|
| Size | 1.6 MB |
| Tags | Source |
|
SHA-256 checksum How to use checksums |
8a17035733987485a904079bc7037eda179f4ae7331472dc18cac6765580f8bf
|
|
BLAKE2b-256 checksum How to use checksums |
000ebfe762dacd170f2a24ebd06f00f671961553b7a7a4b65e3be5fb086758b2
|
| Upload date | |
|
Uploaded using Trusted Publishing? What is trusted publishing? |
No |
| Uploaded via |
twine/7.0.0 CPython/3.11.9
|
Release files / ibcs_plotly-0.2.2-py3-none-any.whl
| Download URL | ibcs_plotly-0.2.2-py3-none-any.whl |
|---|---|
| Size | 37.9 kB |
| Tags | Python 3 |
|
SHA-256 checksum How to use checksums |
8b4766ebe01badfea84f1cbd686bec885ab3b7f92b662cbba28980e217300505
|
|
BLAKE2b-256 checksum How to use checksums |
285e21baad12b362bad668f2943478fcb882f4a1761146747cdf963b687d2cb3
|
| Upload date | |
|
Uploaded using Trusted Publishing? What is trusted publishing? |
No |
| Uploaded via |
twine/7.0.0 CPython/3.11.9
|
Security for ibcs-plotly 0.2.2
Provenance
Provenance describes where a file came from. On PyPI, provenance is shared via attestations, which provide a verifiable record of the build or publishing details. View details, limitations and caveats.
No provenance found
None of the files in this release were uploaded with provenance metadata.
A note on package security
PyPI is a repository for distributing packages, not a service for auditing them. While third-party security researchers and our staff do their best to detect and remove malicious packages, PyPI cannot guarantee the quality, security or suitability of any given package.
To learn more about protecting yourself from malicious actors, visit our package security documentation.