
IBL Style


Installation
pip install ibl-style
Figure guidelines
Original figures generated from Python or MATLAB code should be saved in PDF (or SVG) format. These formats are vector graphic formats, meaning that the quality is the same regardless of the final resolution. It's okay to temporarily convert figures to PNG for an initial submission of a paper, but be aware that PNG is a raster format which means the image has been converted to pixels and the resolution is now fixed. Unless absolutely necessary you should never use JPG/JPEG/GIF formats -- these raster formats are lossy formats and your figures may end up looking bad.
Size
Figures should be 90 mm for single column or 180 mm wide for double column. In most journals the maximum height of a figure is 170 mm.
Two convenience methods can be used to generate figures with the single colum (90mm x 170mm) or double column (180mm x 170mm) dimension
from ibl_style.utils import single_column_fig, double_column_fig

fig_single = single_column_fig()
fig_double = double_column_fig()
Font
Figures should use Helvetica for all fonts. You can find the necessary font files in this repository, double click the font file and choose install on Windows or Mac.
- Figure panel letters should be in lowercase 8-point bold font with no period
- Figure title should be in 8-point font with no period, only the first letter should be capitalized
- Axis labels should be in 7-point font with no period, only the first letter should be capitalized
- Tick labels should be in 6-point font
- Additional text on a figure should be in italics in 7-point font, only the first letter should be capitalized
Axes
- Axis lines should usually be 0.5 pt width, and ticks should be 0.25. Keep lines in the range 0.25-1 pt
- Axis labels should identify the value reported and (units) in parenthesis e.g
Distance (m), Time (ms) - The right and top spines should be removed from axis when unused
To ensure the above font and axes specifications are used by default you can import the recommended figure style and apply it to your figures e.g
from ibl_style.style import figure_style

figure_style()
Units
- Separate thousands with commas (1,000)
- Percentages should range from 0 to 100
- Use unicode characters for special symbols e.g to get the μ symbol use
ax.set_ylabel('Depth (\u03bcm)')
Colors
A standardised color scheme for the different recording labs and institutes in the IBL has been defined and should be used consistently throughout different papers. To import the color schemes, use the following code
from ibl_style.style import get_lab_colors, get_institute_colors
lab_colors = get_lab_colors()
institute_colors = get_institute_colors()
Multi-panel figures
To flexibly position plots within a multi-panel figure we recommend using figrid.
- Panels in the x direction (width) should be separated by ~15mm
- Panels in the y direction (height) should be separated by ~20mm
- Panel labels should be placed in the upper left corner and lie outside all axis labels
A couple of helper functions exist in ibl_style.utils (get_coord_pos and add_label) that can be used alongside the
methods from figrid to allow you to place panels and labels according to the specifications above.
See below for an example of how they can be used.
Removing whitespace
To remove whitespace around the border of a figure use a variation of the following code
from ibl_style.utils import MM_TO_INCH
# Remove 7.5 mm of whitespace around figure in all directions
adjust = 7.5
# Depending on the location of axis labels leave a bit more space
extra =  5
width, height = fig.get_size_inches() / MM_TO_INCH
fig.subplots_adjust(top=1-adjust/height, bottom=(adjust + extra)/height,
                    left=adjust/width, right=1-adjust/width)
Try to avoid using matplotlib methods such as plt.tight_layout or plt.savefig(bbox_inches='tight')
as these change the size of the figure.
Example
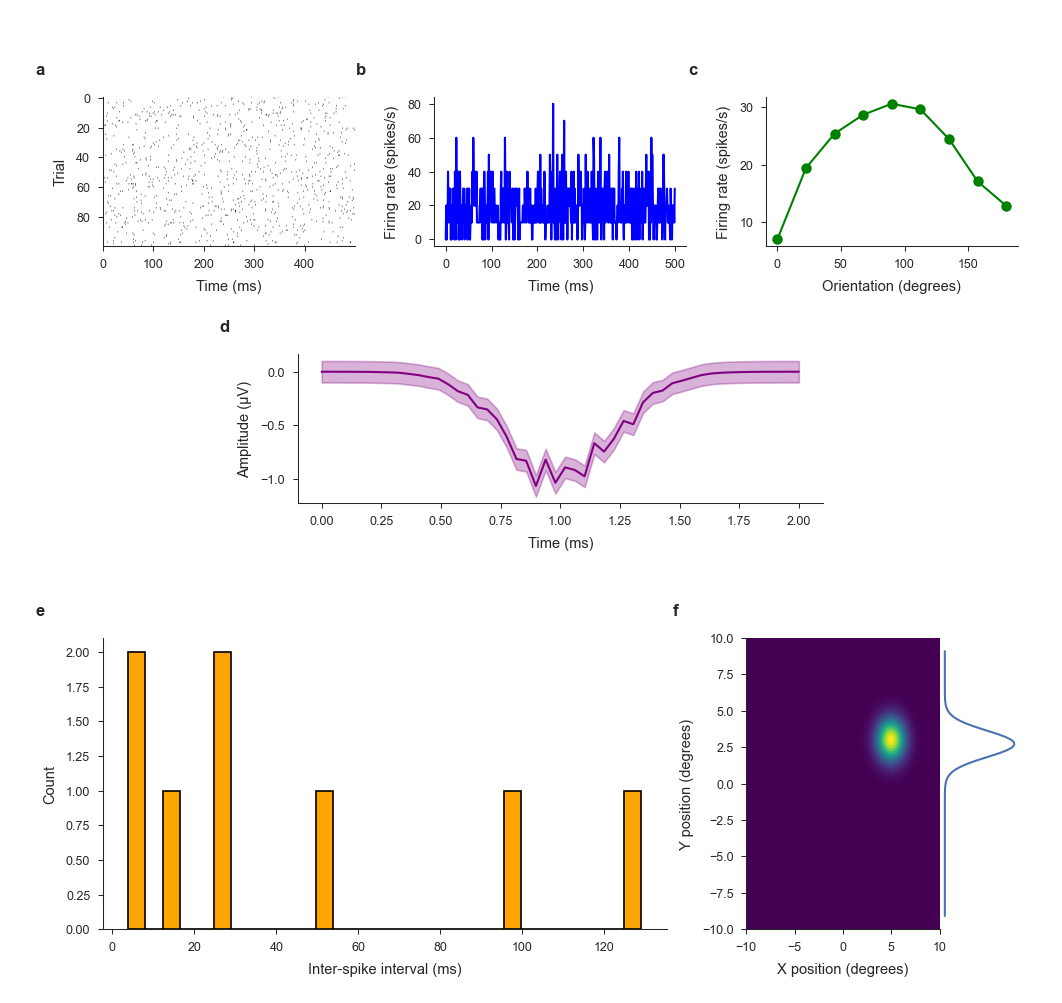
Here we walk through an example using the above tools to generate a double column, multipanel figure with the recommended styling using figrid.
First we set the figure style and generate a figure
from ibl_style.utils import get_coords, add_label, MM_TO_INCH, double_column_fig
from ibl_style.style import figure_style
import figrid as fg

# Define the default styling used for figures
figure_style()

# Make a double column figure
fig = double_column_fig()

# Get the dimensions of the figure in mm
width, height = fig.get_size_inches() / MM_TO_INCH
Next we get the xspan and yspan for each panel
# Get the coordinates of the row and column spans for our figure

# COLUMNS
# Get the column positions (xspans) along the width of the figure.
# Each row has a different number of columns so we need to specify each row one by one
# The first row contains
# - Three columns along the width with equal ratio (ratios=[1, 1, 1])
# - A spacing of 15 mm between the columns (space=15). Note how we use mm as the default unit
# - The padding of the first column from the left of the figure is 10mm (pad=10)
# - The columns span the full width of the figure
xspans1 = get_coords(width, ratios=[1, 1, 1], space=15, pad=10, span=(0, 1))

# The second row contains
# - One column that spans the 60 % of the width of the figure
xspans2 = get_coords(width, ratios=[1], pad=10, span=(0.2, 0.8))

# The third row contains
# - Two columns along the width with ratios 1:3 (ratios=[1, 3])
xspans3 = get_coords(width, ratios=[2, 1], space=15, pad=10, span=(0, 1))
# We further split the 2nd column in row 3 into 2 sub figures with no spacing between them
xspans3_2 = get_coords(width, ratios=[2, 1], space=0, pad=0, span=xspans3[1])

# ROWS
# Get the row positions (yspans) along the height of the figure.
# Here we specify that we want
# - Three rows along the height with ratios 1:1:2 (ratios=[1, 1, 2])
# - A spacing of 20 mm between rows 1 and 2 and a spacing of 25 mm between rows 2 and 3 the panels (space=[10, 15])
# - The padding of the first row from the top of the figure is 10mm (pad=10)
# - The rows span the full width of the figure
yspans = get_coords(height, ratios=[1, 1, 2], space=[20, 25], pad=10, span=(0, 1))
Once we have the coordinates of our rows and columns we can then use figrid to add axis in the correct locations
axs = {'a': fg.place_axes_on_grid(fig, xspan=xspans1[0], yspan=yspans[0]),
       'b': fg.place_axes_on_grid(fig, xspan=xspans1[1], yspan=yspans[0]),
       'c': fg.place_axes_on_grid(fig, xspan=xspans1[2], yspan=yspans[0]),
       'd': fg.place_axes_on_grid(fig, xspan=xspans2[0], yspan=yspans[1]),
       'e': fg.place_axes_on_grid(fig, xspan=xspans3[0], yspan=yspans[2]),
       'f_1': fg.place_axes_on_grid(fig, xspan=xspans3_2[0], yspan=yspans[2]),
       'f_2': fg.place_axes_on_grid(fig, xspan=xspans3_2[1], yspan=yspans[2]),
}
Next we can plot some example data onto the individual panels
from ibl_style.examples import plot_example
plot_example(axs)
We can then add labels to the figure
labels = []
padx = 12
pady = 5
labels.append(add_label('a', fig, xspans1[0], yspans[0], padx, pady, fontsize=8))
labels.append(add_label('b', fig, xspans1[1], yspans[0], padx, pady, fontsize=8))
labels.append(add_label('c', fig, xspans1[2], yspans[0], padx, pady, fontsize=8))
labels.append(add_label('d', fig, xspans2[0], yspans[1], padx, pady, fontsize=8))
labels.append(add_label('e', fig, xspans3[0], yspans[2], padx, pady, fontsize=8))
labels.append(add_label('f', fig, xspans3[1], yspans[2], padx, pady, fontsize=8))

fg.add_labels(fig, labels)
Finally we can adjust the white space around the plots and save our figure
adjust = 7.5
# Depending on the location of axis labels leave a bit more space
extra =  5
fig.subplots_adjust(top=1-adjust/height, bottom=(adjust + extra)/height,
                    left=adjust/width, right=1-adjust/width)

fig.savefig('example_figure.pdf')
You should get a figure like this,
Contributing
Changes are merged by pull requests. Release checklist:
- Update version in
ibl_style/__init__.py - Update
CHANGELOG.md - Create a pull request to the
mainbranch on GitHub - Once the PR is merged, create a new tag and push the tag
Once a tag is pushed on main the package is uploaded to PyPI using GitHub Actions.
1 maintainer

Metadata
1 maintainer
Release files for ibl-style 0.1.0
For a detailed explanation of source distributions (sdists) and built distributions (wheels), please see the package formats documentation.
Source distribution (sdist)
| File | Size | Uploaded | |
|---|---|---|---|
| ibl_style-0.1.0.tar.gz | 558.2 kB | Details |
Built distribution (wheel)
| File | Interpreter | ABI | Platform | Reset |
|---|---|---|---|---|
| ibl_style-0.1.0-py3-none-any.whl | Python 3 | none | any | Details |
Total release size: 569.5 kB
Release files / ibl_style-0.1.0.tar.gz
| Download URL | ibl_style-0.1.0.tar.gz |
|---|---|
| Size | 558.2 kB |
| Tags | Source |
|
SHA-256 checksum How to use checksums |
ce2b2ab01ffe213da913db7465be0d9240f49742167886a8527d859b7b513010
|
|
BLAKE2b-256 checksum How to use checksums |
8c3f0a5bbe9b163bb79bf40f44bf5c26463d184c902642204c185c4f4f101b83
|
| Upload date | |
|
Uploaded using Trusted Publishing? What is trusted publishing? |
No |
| Uploaded via |
twine/6.0.1 CPython/3.9.21
|
Release files / ibl_style-0.1.0-py3-none-any.whl
| Download URL | ibl_style-0.1.0-py3-none-any.whl |
|---|---|
| Size | 11.4 kB |
| Tags | Python 3 |
|
SHA-256 checksum How to use checksums |
896b79040806e98e1599cebb660ca38a1b2ee3d2f113788f2be6c1d3048d6c7d
|
|
BLAKE2b-256 checksum How to use checksums |
f636201ba723b2917bdacf76296269ee2074698754a48b3548b9c86f256119f4
|
| Upload date | |
|
Uploaded using Trusted Publishing? What is trusted publishing? |
No |
| Uploaded via |
twine/6.0.1 CPython/3.9.21
|














