Ionospheric Bubble Probability
Project description
The ionospheric bubble probability statistical model is a Swarm L2 product, named IBP_CLI. The output of the Ionospheric Bubble Probability (IBP) product is an index, that depends on the day of year or the month of the year, geographic longitude, local time and solar flux index.
The output floating point index ranges 0-1 and characterizes the percentage probability of low latitude bubble occurence at the specified time, location and solar flux.
This empirical IBP model has been derived from magnetic observations obtained by the CHAMP and Swarm missions. The model is representative for the altitude range 350 - 500 km and low geographic latitudes of +/- 45 degree.
Documentation
Detailed documentation can be found at: https://ibp-model.readthedocs.io
Quick Start
Installation
Using pip:
$ pip install ibpmodelDependencies:
numpy
pandas
matplotlib
scipy
cdflib
Usage
The return value of the function ibpmodel.calculateIBPindex() is of type pandas.DataFrame.
>>> import ibpmodel as ibp
>>> ibp.calculateIBPindex(day_month=15,           # Day of Year or Month
              longitude=0,                        # Longitude in degree
              local_time=20.9,                    # Local time in hours
              f107=150)                           # F10.7 cm Solar Flux index
   Doy  Month  Lon    LT  F10.7     IBP
0   15      1    0  20.9    150  0.3547
>>> ibp.calculateIBPindex(day_month=['Jan','Feb','Mar'], local_time=22)
Doy Month Lon LT F10.7 IBP
0 15 1 -180 22 150 0.0739
1 15 1 -175 22 150 0.0722
2 15 1 -170 22 150 0.0717
3 15 1 -165 22 150 0.0728
4 15 1 -160 22 150 0.0771
.. ... ... ... .. ... ...
211 74 3 155 22 150 0.2061
212 74 3 160 22 150 0.2025
213 74 3 165 22 150 0.1994
214 74 3 170 22 150 0.1967
215 74 3 175 22 150 0.1943
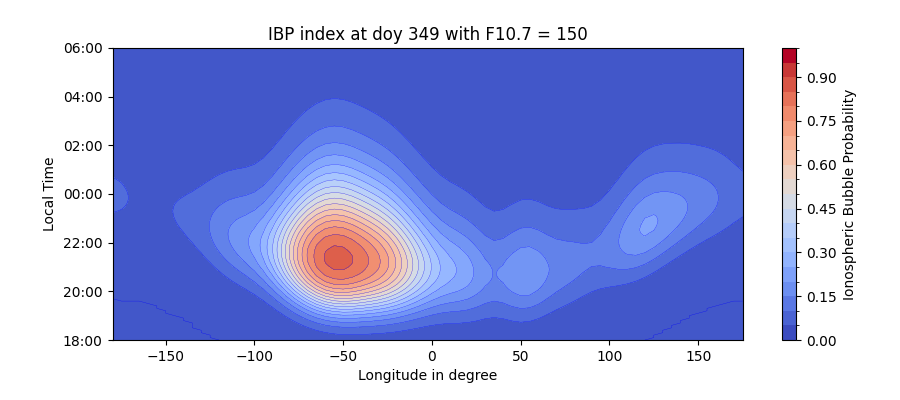
[216 rows x 6 columns]>>> ibp.plotIBPindex(doy=349)
>>>
The IBP model reproduces the high occurrence probability of EPDs ranging between 50-90% over the South American (75-25°W) sector and low occurrence probability over the Pacific sector during the period around December solstice.
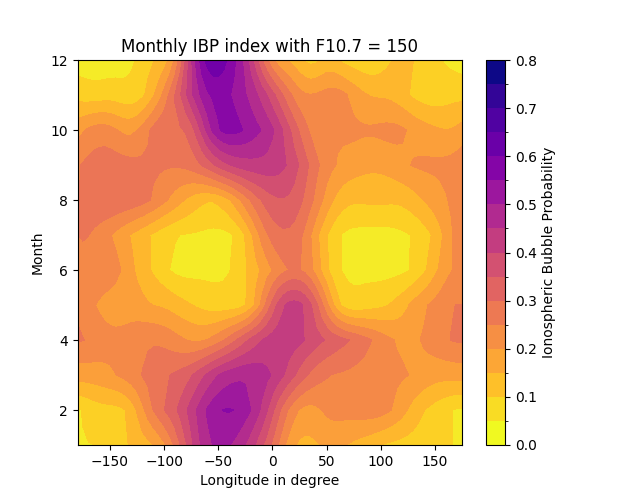
>>> ibp.plotButterflyData(f107=150)
>>>
The monthly global occurrence rate of EPDs from the IBP model, is derived for a fixed value of F10.7=150 s.f.u for all integer longitudes at a resolution of 5° at the middle of each month and averaged between 19 and 1 LT. The seasonal and longitudinal variations of the EPD occurrence rates are particularly well-characterized by the IBP model as compared to its climatology with highest rates seen around the equinoxes and winter solstice in the America-Atlantic-Africa region and lowest rates during November-February in the Pacific sector and during May-July in the America-Atlantic and Indian sectors.
References
Stolle, C., Siddiqui, T. A., Schreiter, L., Das, S. K., Rusch, I., Rother, M., & Doornbos, E. (2024). An empirical model of the occurrence rate of low latitude post‐sunset plasma irregularities derived from CHAMP and Swarm magnetic observations. Space Weather, 22, e2023SW003809. https://doi.org/10.1029/2023SW003809
Lucas Schreiter, Anwendungsorientierte Modellierung der Auftretenswahrscheinlichkeit und relativen Häufigkeit von äquatorialen Plasmabubbles, Master’s thesis, Institute of Mathematics, University of Potsdam, 2016. (in German only.)
Information for developers
Setup environment
$ git clone https://igit.iap-kborn.de/ibp/ibp-model.git
$ cd ibp-model
$ pip install -r requirements-dev.txt
$ pip install -e .
Test of package using doctest
$ python src/ibpmodel/ibpcalc.pyNo error should occur.
Test run of the documentation
$ cd docs
$ make clean && make html
The docs/build/html/ directory contains the html files. Open index.html in browser. The results of the code examples on the usage page are generated automatically. Therefore the ibpmodel package must be installed (pip install -e .).
Project details
Download files
Download the file for your platform. If you're not sure which to choose, learn more about installing packages.


