
ifadw-treeviz
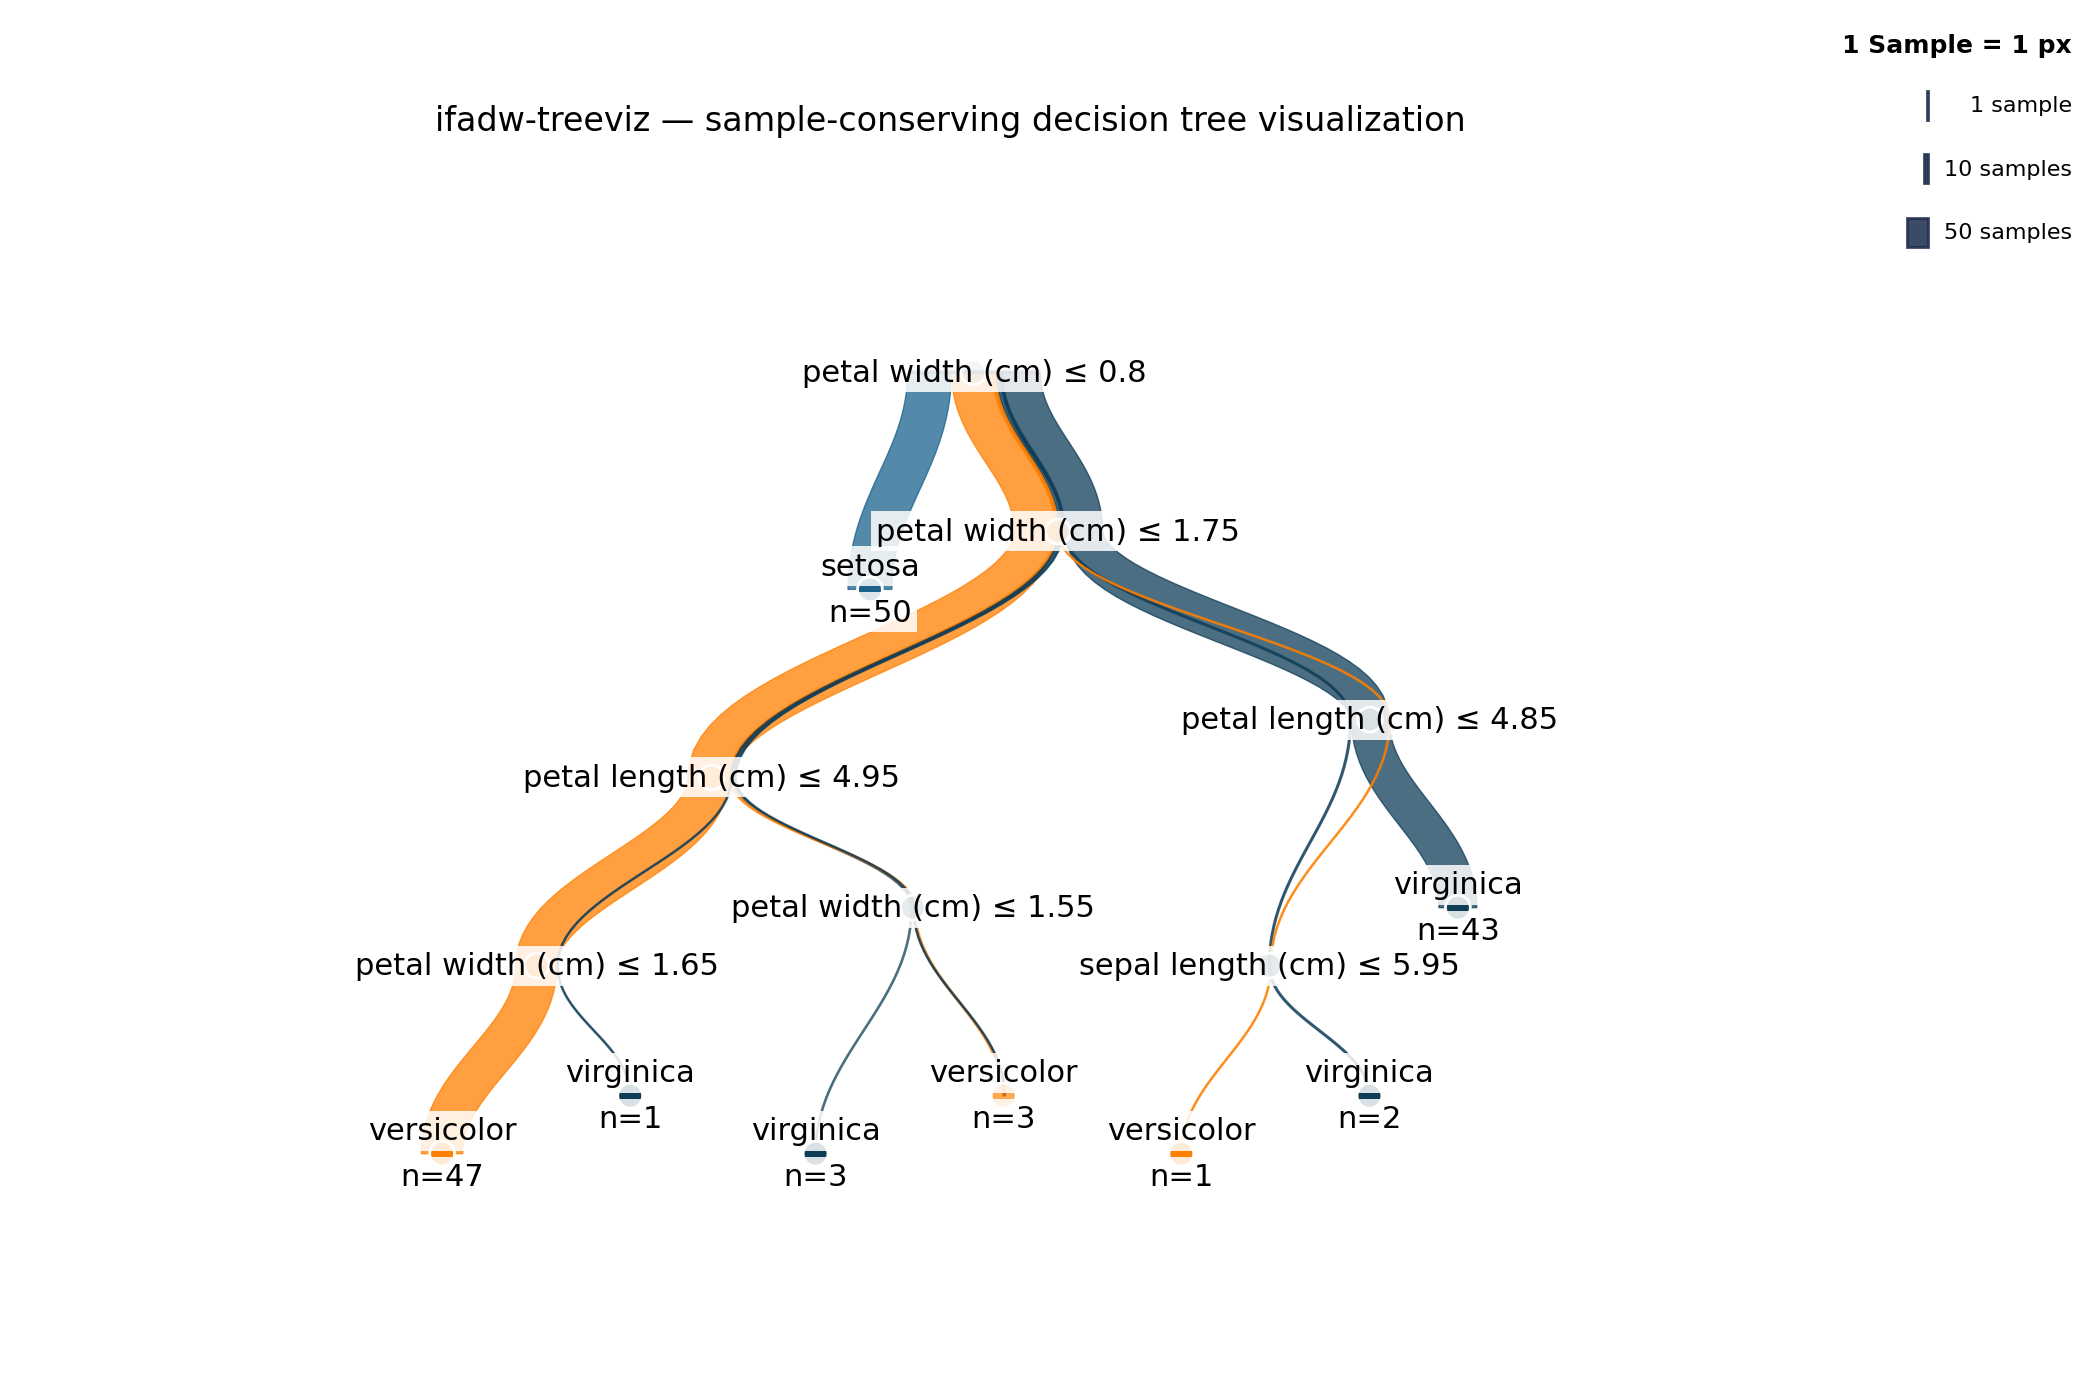
Sample-conserving decision tree visualization for scikit-learn. Every sample contributes a constant edge-width slice from the root to its leaf. Edge widths sum mathematically to the parent node's sample count at every branch — what you see is what the model splits.



Installation
pip install ifadw-treeviz                     # Plotly only
pip install "ifadw-treeviz[mpl]"              # plus matplotlib for PDF/PNG/SVG
Or via conda-forge:
conda install -c conda-forge ifadw-treeviz
For the latest development version from source:
pip install git+https://codeberg.org/IfaDW/ifadw-treeviz.git
Requires Python 3.12+.
Quick Start
from sklearn.datasets import load_iris
from sklearn.tree import DecisionTreeClassifier
import ifadw_treeviz as itv

iris = load_iris()
clf = DecisionTreeClassifier(max_depth=4, random_state=0).fit(
    iris.data, iris.target
)

# Interactive HTML
fig = itv.draw_tree(
    clf,
    feature_names=iris.feature_names,
    class_names=iris.target_names.tolist(),
)
fig.write_html("iris_tree.html")

# Static PDF (requires the [mpl] extra)
fig_mpl = itv.draw_tree_mpl(
    clf,
    feature_names=iris.feature_names,
    class_names=iris.target_names.tolist(),
)
fig_mpl.savefig("iris_tree.pdf", bbox_inches="tight", dpi=150)
Why?
Decision trees from scikit-learn are usually visualized via
sklearn.tree.plot_tree or export_graphviz. Both are functional but
visually flat: each node is a box, each edge is a line, sample
distributions live in text. They show the structure but not the flow.
pybaobabdt (Sengupta, van den Elzen, van Wijk; TU/e Eindhoven)
introduced a different paradigm: render the tree as a flow of sample
bands. Branch widths encode sample counts, class composition is visible
in stripes, the visual hierarchy emerges from the geometry itself.
Reading a pybaobabdt tree feels like reading a Sankey diagram — the
data flow is the picture.
ifadw-treeviz adopts that paradigm with a modern Python toolchain:
Plotly for interactivity, matplotlib for static export, type-checked
strict-mypy code, full pytest coverage, and a layered architecture
(layout, geometry, rendering as separate modules). The bands are
rendered as sample polygons along the centerline Bezier with
perpendicular offsets at every sample point, so band widths stay
consistent regardless of edge orientation and taper smoothly between
parent and child sample counts.
Features
- Multi-band Bezier flows: continuous bands from root to leaf, encoding class distribution and sample counts in geometry
- Two renderers: Plotly for interactive HTML with hover details, matplotlib for static PDF/PNG/SVG export
- Hover information: full feature names, sample counts, and class distributions visible on hover (Plotly)
- Phi-asymmetric layout: subtle deterministic asymmetry breaks the rigidity of strict Reingold-Tilford-Walker layouts
- Customizable branding: six font/label parameters, three built-in
palettes (
colorblinddefault,ifadw,viridis) - Word-wrap labels: long feature names are wrapped at word boundaries; truncated to 2 lines with ellipsis only when necessary
- Accessibility-first: colorblind-safe Okabe-Ito palette as default; high-contrast labels with semi-transparent backgrounds
Performance Notes
For trees with many nodes, rendering performance and HTML size matter:
- Recommended
max_depth: 4-6 for HTML output, up to 8-10 for PDF. Beyond that, the tree becomes hard to read regardless of rendering. max_depth=Noneis supported but produces extremely large outputs on real-world data. A depth-30 tree on 100k samples can have 50k+ nodes and several MB of HTML — unwieldy for interactive use.- Many classes (>8): the library auto-switches from the
colorblindpalette toviridisfor better distinguishability. Passpalette="tab20"for an alternative discrete palette with 20 colors, or passpalette=PALETTES["colorblind"](thePaletteinstance) to keep the cycled colorblind palette. - HTML-size warning: when the estimated output exceeds ~2 MB the
renderer emits a
UserWarninglisting the standard mitigations (smallermax_depth,edge_curve='straight', or static PDF/PNG viadraw_tree_mpl). - For static export (PDF/PNG/SVG via
draw_tree_mpl), tree size matters less since the renderer handles many nodes efficiently.
Sample Conservation (v0.9.3+)
ifadw-treeviz uses sample-conserving edge geometry: every sample
contributes a constant edge-width slice from the root to its leaf.
Edge widths sum mathematically to the parent node's sample count at
every branch. The root node renders as a horizontal line of fixed
width (default 0.7 layout units; configurable via
wurzel_linien_breite) on which all sample-bands originate at
proportional slots.
For trees with very many samples (>10k) or many leaves, individual
bands may reach sub-pixel widths at the default scale. The library
emits a UserWarning in this case. Workarounds:
- Reduce
max_depthto consolidate leaves. - Use
draw_tree_mplfor vector PDF export (sub-pixel bands remain precise in vector format). - Use
draw_tree_zoom_levels(...)to write a series of HTMLs at progressively higherwurzel_linien_breitescales — see below.
The Edge-Dicke-Legende rendered top-right (configurable via
legend_position) shows "1 Sample = N px" plus three demonstration
bands so users can visually calibrate band widths against sample
counts. At sub-pixel scaling the legend adapts its demo values (e.g.
200 / 2000 / 10000 instead of 1 / 10 / 50) so each band stays
visually distinct. Disable it with show_edge_width_legend=False.
Zoom and Detail Levels (v0.9.5+)
For interactive zoom in HTML output, use Plotly's built-in tools (no extra setup needed):
- Box zoom: click the "Zoom" button in the modebar and drag a rectangle, or hold Shift and drag.
- Scroll zoom: enable via
config={"scrollZoom": True}infig.write_html(..., config=...). - Reset view: double-click anywhere in the plot.
For trees with very dense classification (many classes x many leaves)
where the standard resolution renders sub-pixel bands, use the
draw_tree_zoom_levels(...) helper to write multiple HTMLs at
progressively higher pixel resolutions (v0.9.6 scales width /
height rather than the layout geometry — layout proportions stay
invariant, only the rendered SVG resolution grows):
import ifadw_treeviz as itv

itv.draw_tree_zoom_levels(
    clf,
    output_dir="./tree_zooms",
    base_name="iris",
    zoom_factors=(1.0, 3.0, 7.0),
    feature_names=iris.feature_names,
    class_names=iris.target_names.tolist(),
)
# Writes ./tree_zooms/iris_zoom1.0.html, ./tree_zooms/iris_zoom3.0.html, ...
For static export, prefer draw_tree_mpl and save to PDF — sub-pixel
bands remain precise in vector format regardless of scale.
Note: v0.9.4 shipped an experimental browser-side lazy-render with a vertical depth slider, but the JSON-embedding approach proved too heavy in practice (slow HTML loads, Firefox slider freezes). v0.9.5 rolls the experiment back to static rendering; the helpers above cover the practical use cases without the JS-side complexity.
Examples
The examples/ directory contains eight runnable scripts:
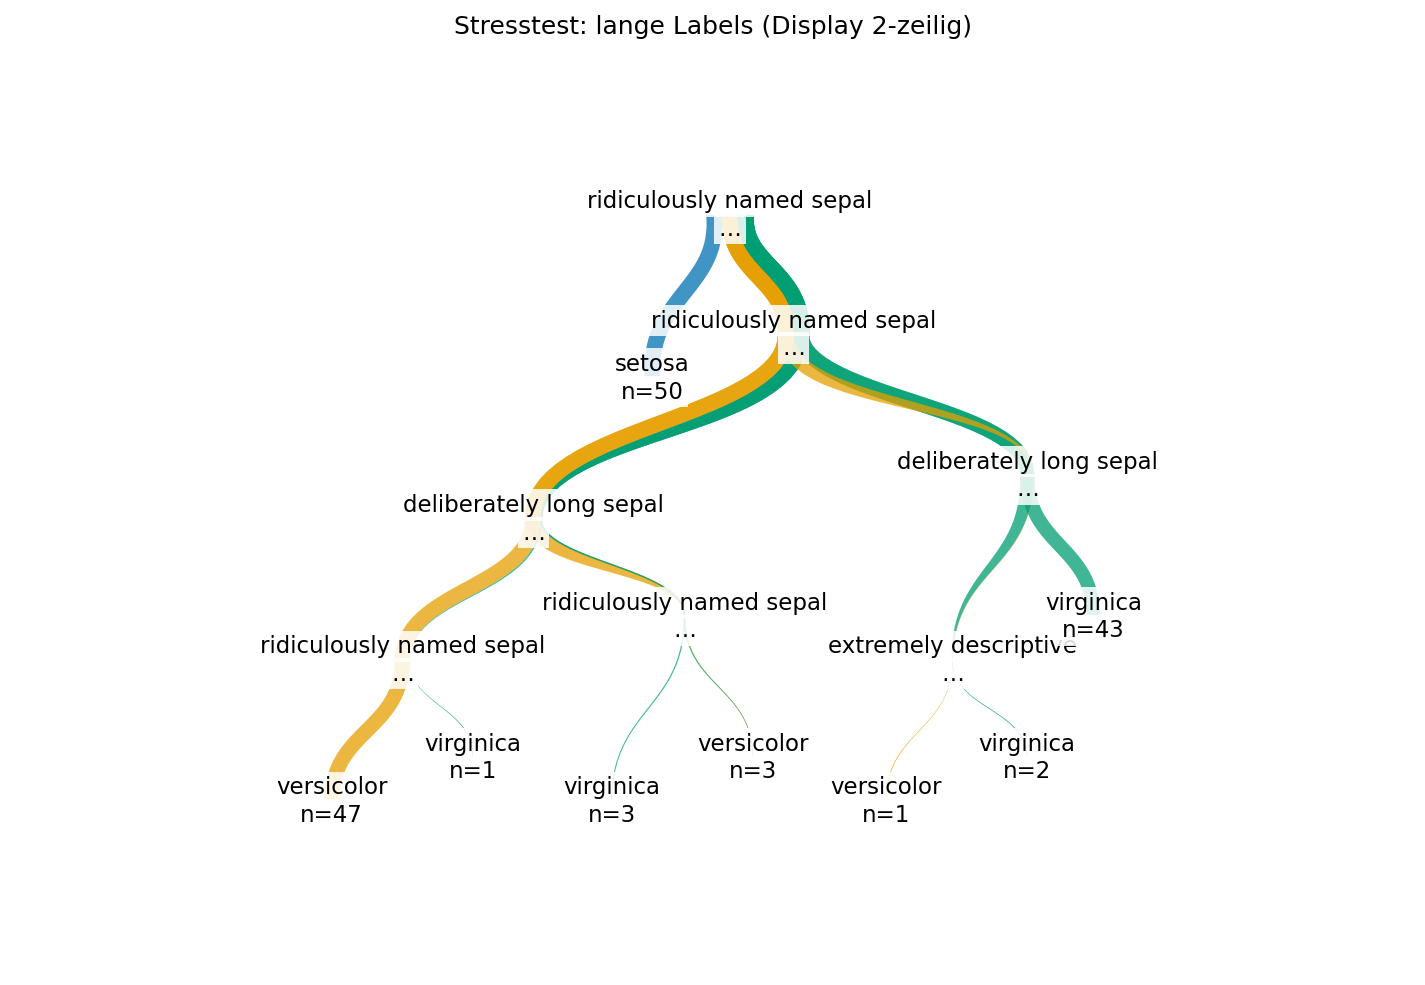
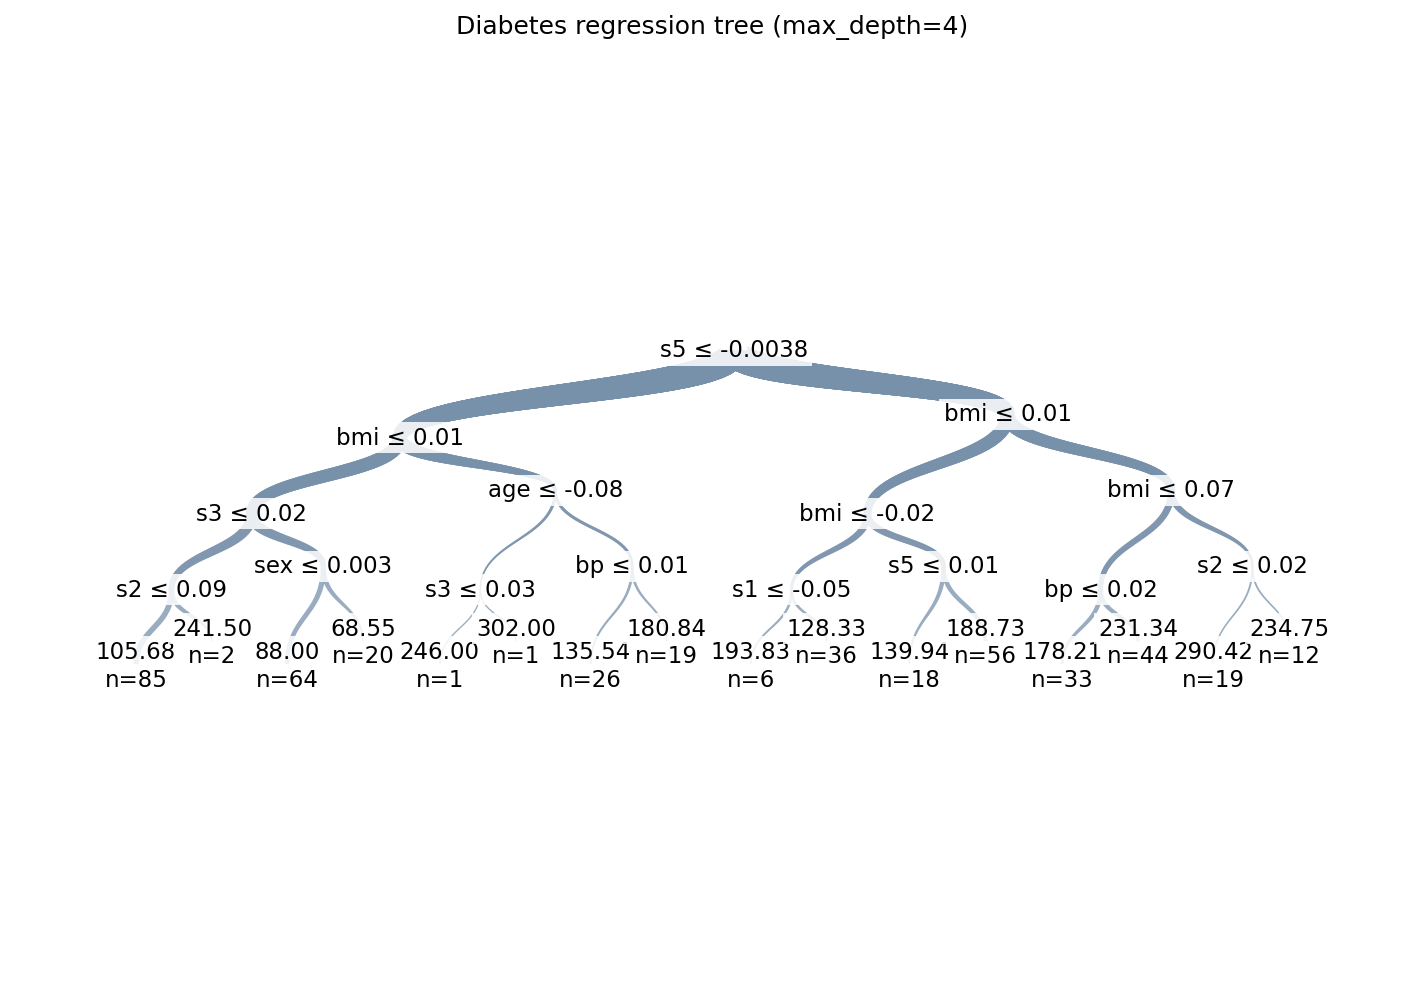
iris_basic.py— minimal Plotly classifier exampleiris_polish.py— branded example with custom palette and labelsiris_branding.py— IfaDW corporate-design paletteiris_long_labels.py— stress test with very long feature namesiris_matplotlib.py— static PDF exportdiabetes.py— regression tree examplesynthetic_classification.py— 10-class synthetic stress test that demonstrates the palette auto-switch and many-class behavioriris_legende_demo.py— v0.9.3 demo of the sample-conserving Wurzel-Linie + Edge-Dicke-Legendeiris_zoom_levels_demo.py— demo ofdraw_tree_zoom_levelsfor multi-resolution HTML export (v0.9.6: scales pixel resolution instead of layout geometry)
Examples Gallery
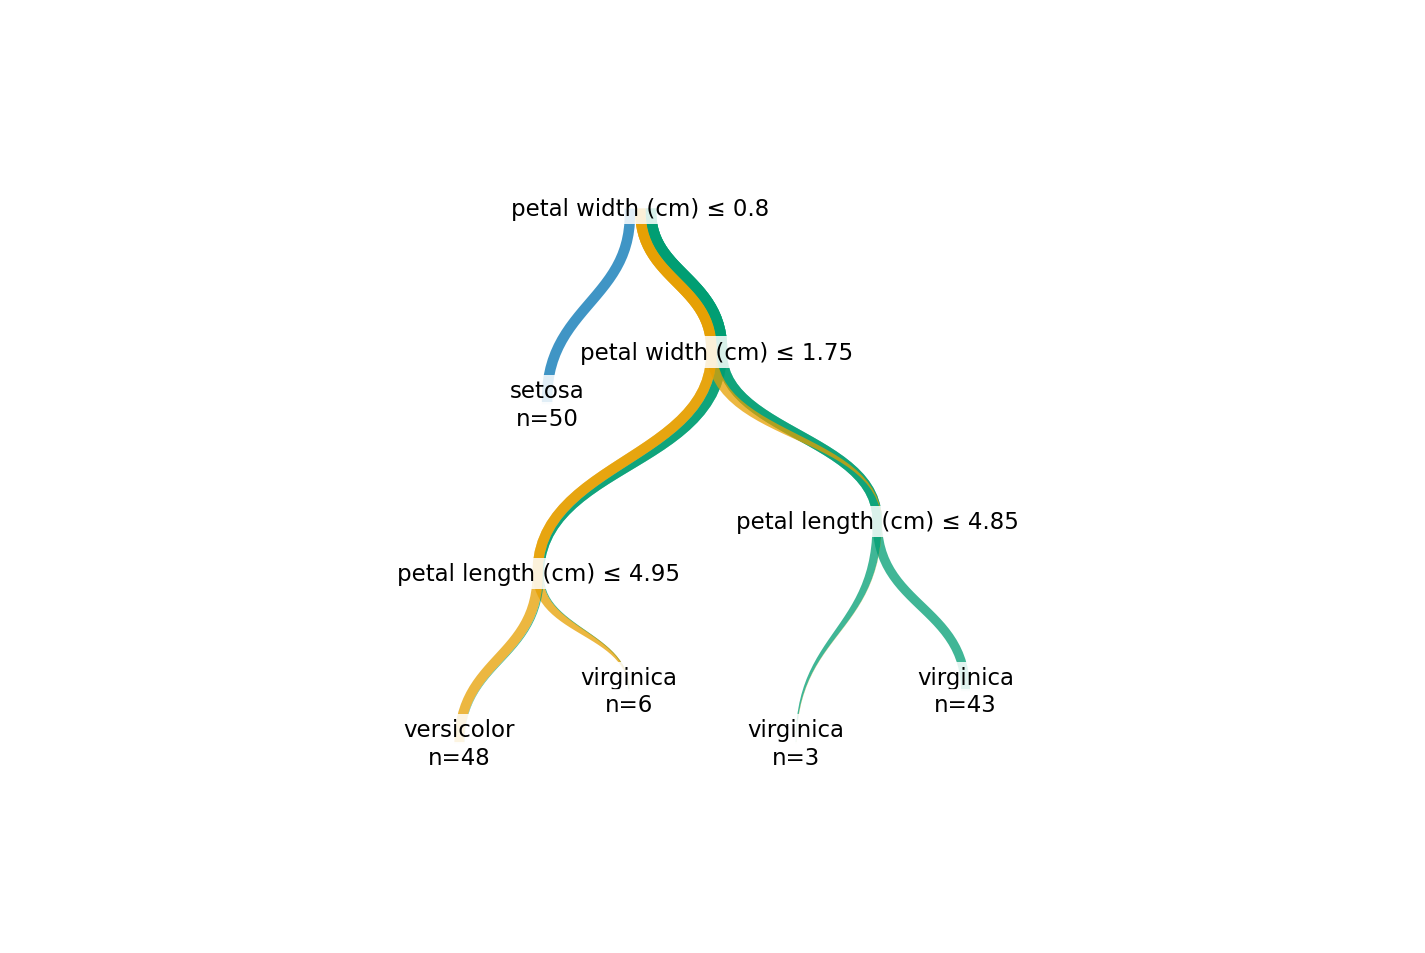
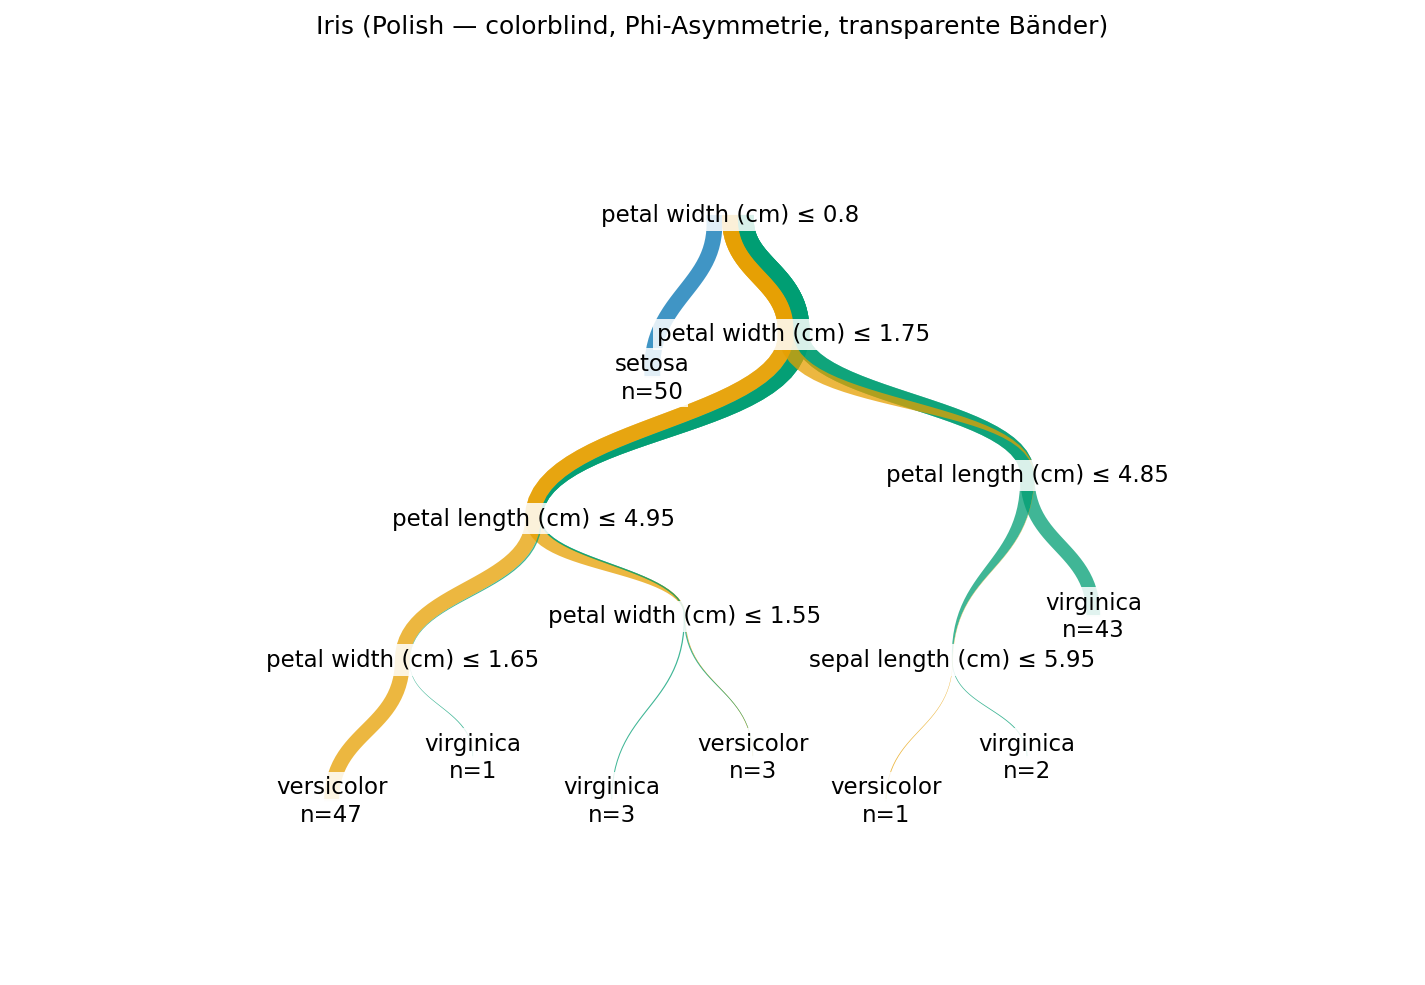
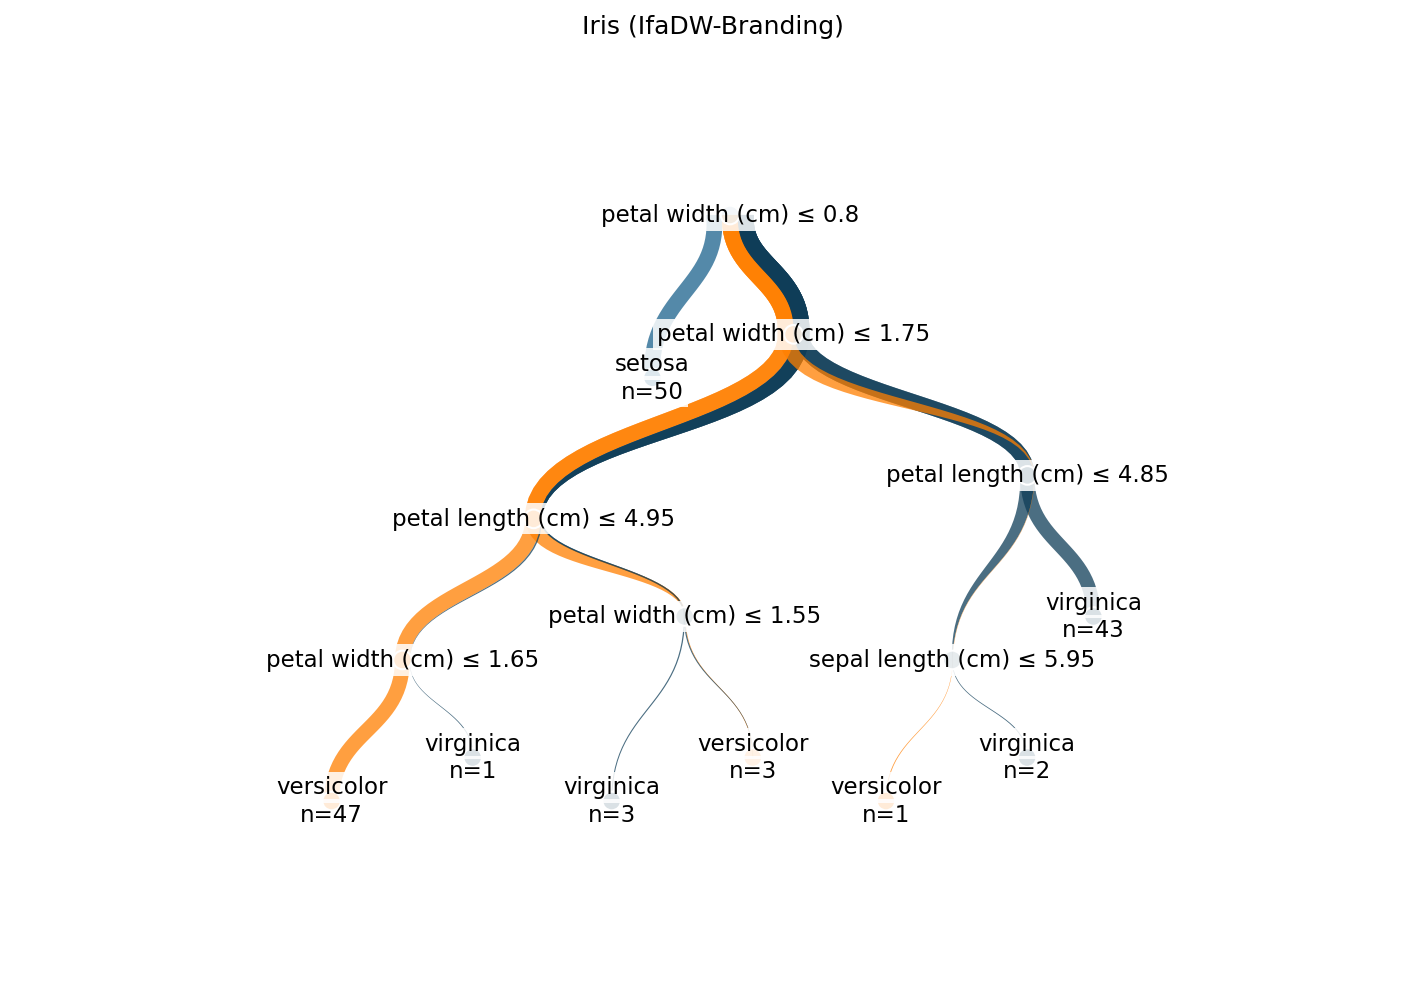
All screenshots below come from the matplotlib renderer; the Plotly
output is the same geometry plus interactive hover. Re-generate with
python docs/generate_screenshots.py.
Basic classification (Iris)
Polished branding
IfaDW corporate design
Long feature names with truncation
Regression tree (Diabetes)
Acknowledgments
This library is a reimplementation of the visualization paradigm introduced by pybaobabdt (Adrija Sengupta, Stef van den Elzen, Jarke van Wijk; TU/e Eindhoven), available at https://gitlab.tue.nl/20040367/pybaobab. Pybaobabdt is itself a Python library with Python dependencies (sklearn, numpy, pygraphviz, matplotlib, scipy, pandas); we acknowledge their foundational work.
ifadw-treeviz differs from pybaobabdt on technical grounds:
interactive Plotly output (in addition to static matplotlib),
strict-typed Python (mypy --strict), modern packaging
(pyproject.toml, pip install), and a layered architecture
separating layout, geometry, and rendering as distinct modules.
The implementation was developed by Daniel Daferner with significant assistance from Claude (Anthropic) for architecture, algorithm implementation, and test generation.
License
AGPL-3.0-or-later. See LICENSE.
Citation
If you use ifadw-treeviz in your research, please cite:
Daniel Daferner, IfaDW Institut für angewandte Datenwissenschaft GmbH.
ifadw-treeviz: Sample-conserving decision tree visualization.
Version 1.0.0. 2026. https://codeberg.org/IfaDW/ifadw-treeviz
See CITATION.cff for machine-readable citation data.
1 maintainer

Metadata
1 maintainer
Release files for ifadw-treeviz 1.0.2
For a detailed explanation of source distributions (sdists) and built distributions (wheels), please see the package formats documentation.
Source distribution (sdist)
| File | Size | Uploaded | |
|---|---|---|---|
| ifadw_treeviz-1.0.2.tar.gz | 165.7 kB | Details |
Built distribution (wheel)
| File | Interpreter | ABI | Platform | Reset |
|---|---|---|---|---|
| ifadw_treeviz-1.0.2-py3-none-any.whl | Python 3 | none | any | Details |
Total release size: 267.4 kB
Release files / ifadw_treeviz-1.0.2.tar.gz
| Download URL | ifadw_treeviz-1.0.2.tar.gz |
|---|---|
| Size | 165.7 kB |
| Tags | Source |
|
SHA-256 checksum How to use checksums |
793cbdac27887cb7a7522cb92952979b774867fac23189c006859ac10deeb3e7
|
|
BLAKE2b-256 checksum How to use checksums |
fd8fd93d294e52101c6a27e5ac6fd2602d94d4cb58d447c58762dbebf90d5483
|
| Upload date | |
|
Uploaded using Trusted Publishing? What is trusted publishing? |
No |
| Uploaded via |
twine/6.2.0 CPython/3.12.13
|
Release files / ifadw_treeviz-1.0.2-py3-none-any.whl
| Download URL | ifadw_treeviz-1.0.2-py3-none-any.whl |
|---|---|
| Size | 101.7 kB |
| Tags | Python 3 |
|
SHA-256 checksum How to use checksums |
18f54e936eb83d3f2bc559b880ed719fcd0bdf29070b212703f573a5212560a6
|
|
BLAKE2b-256 checksum How to use checksums |
316ef4180aeb9620e515efb82f1b39cef3e53704ee091db75613dee6293fde9f
|
| Upload date | |
|
Uploaded using Trusted Publishing? What is trusted publishing? |
No |
| Uploaded via |
twine/6.2.0 CPython/3.12.13
|














