
imdtrack








The India Meteorological Department (RSMC New Delhi) cyclone best-track record — every depression and cyclonic storm in the North Indian Ocean (Bay of Bengal & Arabian Sea) since 1982 — as a tidy pandas DataFrame or a CF-style xarray Dataset, kept up to date automatically.
IMD publishes the record as a single, hand-maintained Excel workbook. imdtrack
turns it into clean, analysis-ready tables. The parsed dataset is committed to
this repo (under data/) and refreshed by a monthly GitHub Action, so
imd.load() just downloads the pre-parsed data — no Excel parsing on your side.
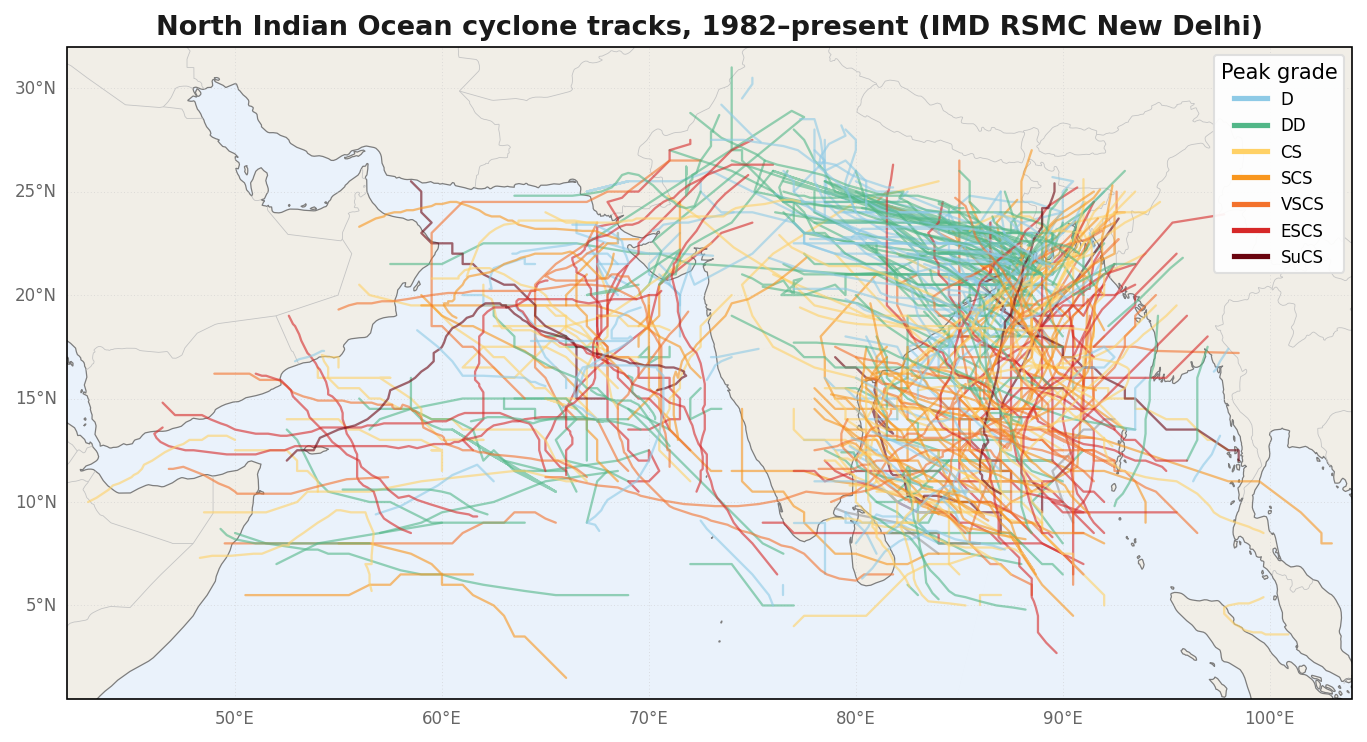
Every storm in the record — 428 systems since 1982 — coloured by peak IMD intensity grade. Two lines of code (below).
Install
pip (from PyPI):
pip install imdtrack            # core: pandas + pyarrow (reads the published parquet)
pip install imdtrack[xarray]    # + xarray/numpy for .to_xarray()
pip install imdtrack[plot]      # + cartopy/matplotlib for map plotting
pip install imdtrack[all]       # xarray + numpy + openpyxl
conda / mamba / micromamba (from conda-forge) — create a
dedicated environment and install in one step. The commands are interchangeable
across the whole conda family; conda ships with Anaconda/Miniconda, while
mamba/micromamba are faster drop-in replacements:
# create a new environment named "imd" with imdtrack in it, then activate it
conda create -n imd -c conda-forge imdtrack
conda activate imd

# — or, using mamba / micromamba (same flags) —
mamba create -n imd -c conda-forge imdtrack        # mamba activate imd
micromamba create -n imd -c conda-forge imdtrack   # micromamba activate imd

# add it to an environment you already have active
conda install -c conda-forge imdtrack              # or: mamba / micromamba install ...
The conda-forge build bundles a prebuilt cartopy, so map plotting works out of the box — no compiler, no GEOS/PROJ, and no Python-version limit.
uv (from PyPI):
uv add imdtrack                 # into a uv project  (uv add "imdtrack[plot]" for an extra)
uv pip install imdtrack         # into the active environment
| Extra | Adds | For |
|---|---|---|
| (none) | pandas, pyarrow | loading the data as DataFrames |
xarray |
xarray, numpy | bt.to_xarray() |
plot |
cartopy, matplotlib | imd.plot_track() map plots |
pipeline |
openpyxl | parsing the IMD workbook yourself (source="imd") |
With pip/uv,
cartopyhas no Python 3.14 wheel yet, so the[plot]extra needs Python ≤ 3.13 (or a system GEOS+PROJ to build it). Installing from conda-forge avoids this entirely.
Usage
import imdtrack as imd

bt = imd.load()                 # pre-parsed dataset from GitHub (cached)
df = bt.observations            # tidy DataFrame: one row per 3-hourly fix
ds = bt.to_xarray()             # (storm, step) xarray.Dataset

bt = imd.load(update=True)      # re-download only if the repo published new data

bt.storm("2020-001")            # one storm's track (AMPHAN)
bt.storms                       # one row per storm (peak grade, max wind, ...)
bt.remarks                      # landfall / weakening notes, linked by storm_id
The tidy observations frame
| column | meaning |
|---|---|
storm_id |
stable id, "<year>-<serial>" e.g. 2020-001 |
year, serial |
year and serial number of the system within that year |
basin |
BOB (Bay of Bengal), ARB (Arabian Sea), or LAND |
name |
cyclone name (blank for unnamed / older systems) |
time |
observation time (UTC, datetime64) |
lat, lon |
position (°N, °E) |
ci_no |
Dvorak CI / T-number |
pressure |
estimated central pressure (hPa) |
wind |
maximum sustained surface wind (knots) |
pressure_drop |
pressure drop / ΔP (hPa) |
grade |
ordered category: D < DD < CS < SCS < VSCS < ESCS < SuCS |
oci, oci_diameter |
outermost closed isobar pressure (hPa) & diameter (°) |
step |
0-based fix index within the storm |
The xarray Dataset
Laid out like IBTrACS:
a ragged track becomes a 2-D (storm, step) grid. Per-fix variables span both
dims; storm-level metadata (name, basin, year, …) are storm coordinates.
ds = bt.to_xarray()
ds.sel(storm="2020-001")["wind"].max()      # AMPHAN peak intensity
ds.where(ds.basin == "ARB", drop=True)      # Arabian Sea storms only
See the documentation for a full walkthrough and a North Indian Ocean climatology example.
Plotting
The optional [plot] extra draws publication-quality Cartopy
maps, coloured by IMD intensity grade. Plot every track at once — by peak
grade (the figure above) or by sub-basin:
import imdtrack as imd

bt = imd.load().clean()                        # QC-clean the whole record
imd.plot_tracks(bt.observations, color="grade")   # colour by peak intensity
imd.plot_tracks(bt.observations, color="basin")   # Bay of Bengal vs Arabian Sea
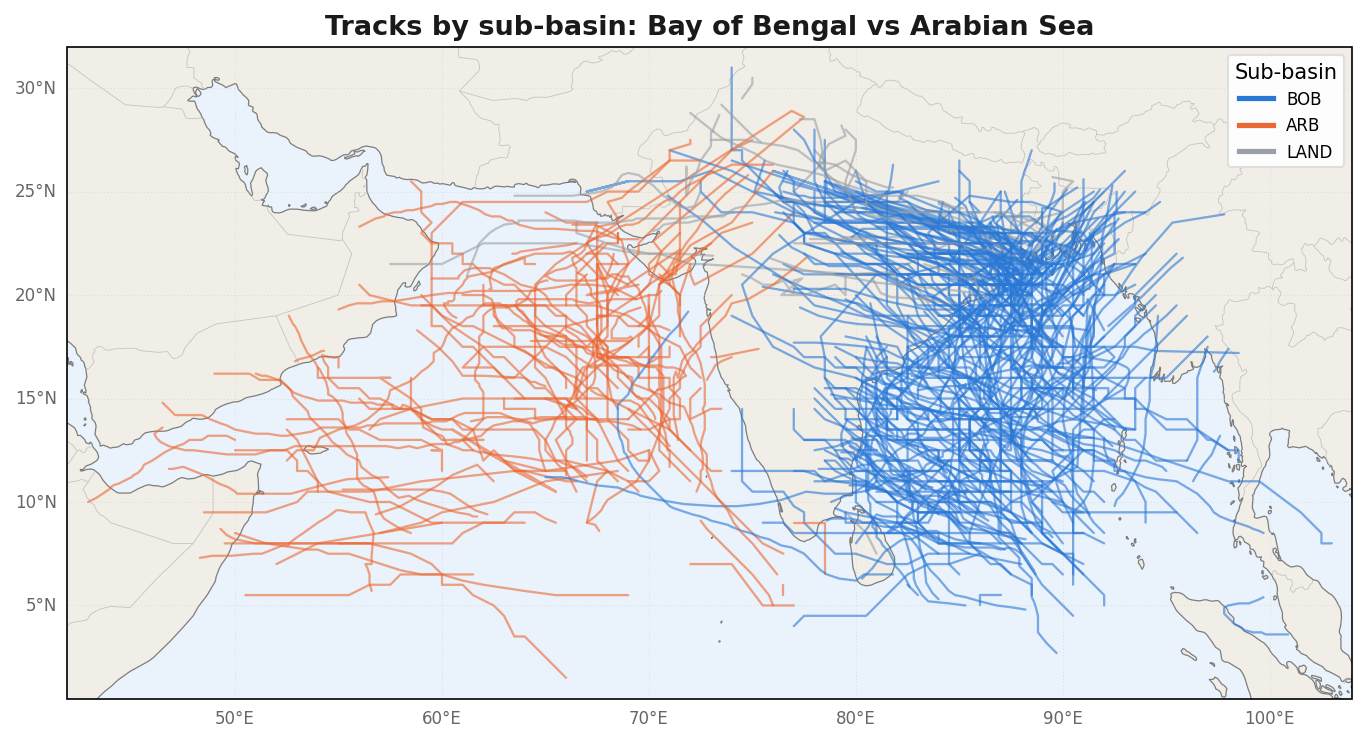
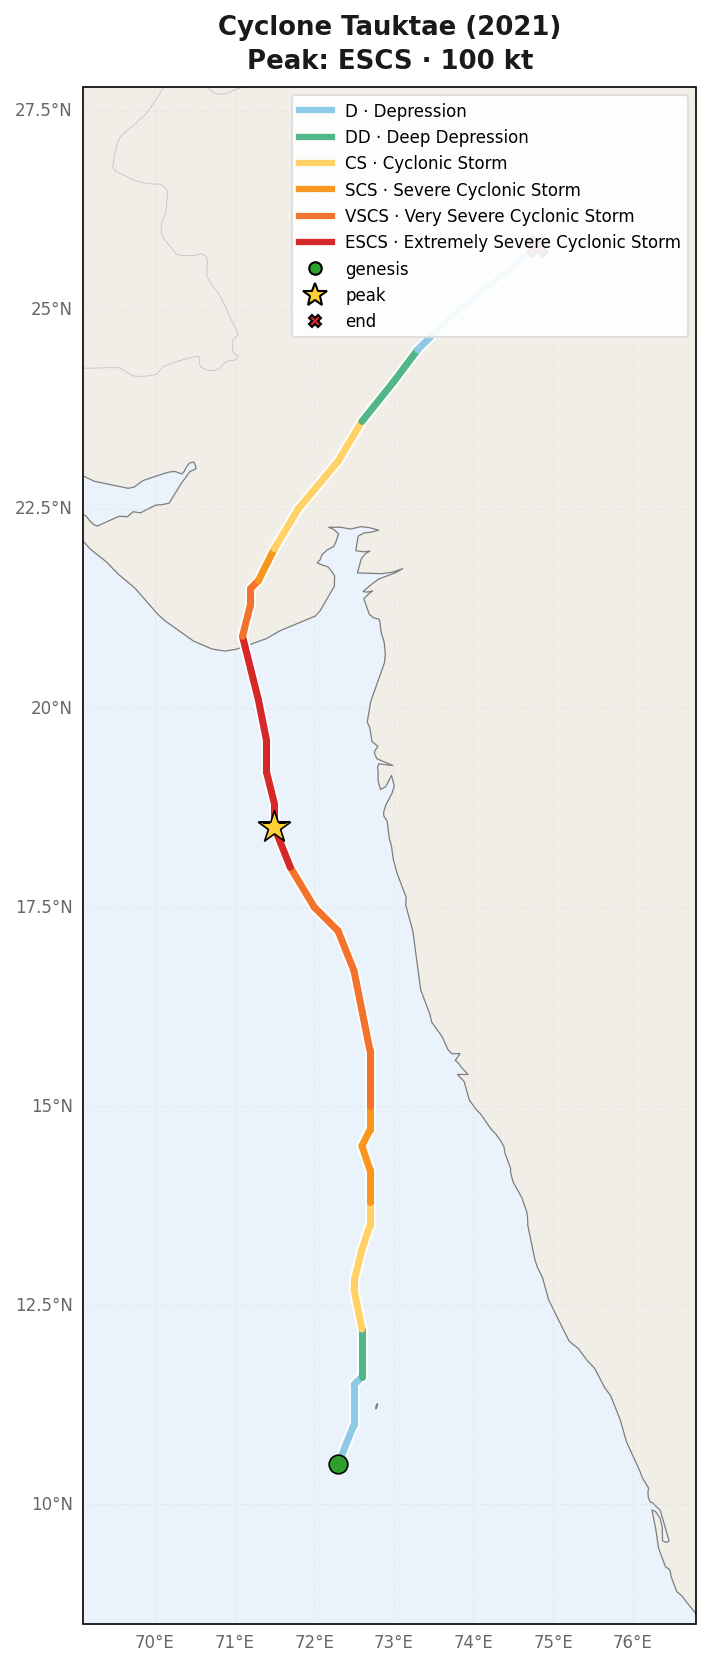
Or a single storm, coloured by grade with genesis / peak / end marked:
imd.plot_track(bt.storm("tauktae"), color="grade") # or any storm_id / name
Staying up to date
A monthly GitHub Action re-fetches the
IMD workbook and, only if it parses and passes validation, updates data/ — a
broken upload can never overwrite the good published data. You normally don't
have to do anything; imd.load(update=True) pulls the latest.
Data quality
The library mirrors the IMD workbook faithfully, including its occasional data-entry errors. Two conservative, non-destructive checks flag them — the source values are never altered:
pos_suspect— a fix whose coordinates imply an impossible jump (isolated position spike), e.g. a corrupted latitude.date_suspect— a day/month-transposed date, e.g. Nargis (2008) where May 1–3 were stored as "01/05, 02/05, 03/05" (Jan/Feb/Mar 5).
bt = imd.load()
bt.observations.query("pos_suspect or date_suspect")   # inspect flagged fixes
bt.clean()                        # drop position spikes (or clean(how="mask"))
bt.clean(fix_dates=True)          # also swap day/month back and re-order the track
These catch the common, well-defined cases; a few storms have messier date
corruption that is left as-is (visible as an implausibly long start_time–end_time span).
Notes & caveats
- Data © India Meteorological Department. This library only reformats it; verify against IMD for operational use. The most recent season is tentative until IMD's post-season review.
- Older years often lack storm names and some fields (e.g. central pressure);
those appear as
NaN.
Citation
Please cite imdtrack via its Zenodo Concept DOI — stable across releases,
always resolving to the latest version:
Syed, H. A. (2026). imdtrack: A Python library for the IMD North Indian Ocean cyclone best-track record. https://doi.org/10.5281/zenodo.21301659
GitHub's "Cite this repository" button reads CITATION.cff.
License
BSD 3-Clause. See LICENSE.
1 maintainer

Metadata
1 maintainer
Release files for imdtrack 0.3.0
For a detailed explanation of source distributions (sdists) and built distributions (wheels), please see the package formats documentation.
Source distribution (sdist)
| File | Size | Uploaded | |
|---|---|---|---|
| imdtrack-0.3.0.tar.gz | 1.7 MB | Details |
Built distribution (wheel)
| File | Interpreter | ABI | Platform | Reset |
|---|---|---|---|---|
| imdtrack-0.3.0-py3-none-any.whl | Python 3 | none | any | Details |
Total release size: 1.7 MB
Release files / imdtrack-0.3.0.tar.gz
| Download URL | imdtrack-0.3.0.tar.gz |
|---|---|
| Size | 1.7 MB |
| Tags | Source |
|
SHA-256 checksum How to use checksums |
ef1849eeb48e21b973bf60dfa57a10c90547677d81e128aaa69a77a6a2b5c953
|
|
BLAKE2b-256 checksum How to use checksums |
8c3538ef1742d26acd75361a89ae0cdb58c8ae0d445943724661421a4af08189
|
| Upload date | |
|
Uploaded using Trusted Publishing? What is trusted publishing? |
Yes |
| Uploaded via |
twine/7.0.0 CPython/3.13.14
|
Provenance
Provenance describes where a file came from. On PyPI, provenance is shared via attestations, which provide a verifiable record of the build or publishing details. View details, limitations and caveats.


PyPI Publish Attestation
PyPI verified that this artifact, at this checksum, originated from the publisher listed below.
Signed by GitHub Actions, verified by PyPI on Aug 9, 2026.
Transparency logRelease files / imdtrack-0.3.0-py3-none-any.whl
| Download URL | imdtrack-0.3.0-py3-none-any.whl |
|---|---|
| Size | 40.4 kB |
| Tags | Python 3 |
|
SHA-256 checksum How to use checksums |
e5ad1f3745c9d87224a26b73bba55af9b155bd005cdf9de73f2e6647ac364319
|
|
BLAKE2b-256 checksum How to use checksums |
ea5953b5bb8340d75c3aad6d4cf8e6af586ef0057e33c3404e22d068df6ba858
|
| Upload date | |
|
Uploaded using Trusted Publishing? What is trusted publishing? |
Yes |
| Uploaded via |
twine/7.0.0 CPython/3.13.14
|
Provenance
Provenance describes where a file came from. On PyPI, provenance is shared via attestations, which provide a verifiable record of the build or publishing details. View details, limitations and caveats.
PyPI Publish Attestation
PyPI verified that this artifact, at this checksum, originated from the publisher listed below.
Signed by GitHub Actions, verified by PyPI on Aug 9, 2026.
Transparency log













