
inspectpd


inspectpd is a collection of utilities for column-wise summary and
visualisation of pandas data frames, a Python port of the R package
inspectdf. Importing it adds
the following methods to pandas.DataFrame:
| Method | Summary |
|---|---|
.inspect_types() |
column dtypes |
.inspect_mem() |
memory usage of each column |
.inspect_na() |
prevalence of missing values in each column |
.inspect_cor() |
correlation coefficients between numeric columns |
.inspect_imb() |
feature imbalance of categorical columns |
.inspect_num() |
summaries of numeric columns |
.inspect_cat() |
summaries of categorical columns |
Every method returns a data frame, and every result has a .view() method
that draws it with plotnine.
Installation and use
pip install inspectpd
Import the package and call the methods on any data frame:
import pandas as pd
import inspectpd  # noqa: F401  (imported for its side effect of adding the methods)

df = pd.read_csv("my_data.csv")
df.inspect_na()
df.inspect_na().view()
Two small example data sets are bundled for trying things out: starwars
(characters from the Star Wars films) and tdf (Tour de France winners). The
examples below use them.
import inspectpd
from inspectpd import starwars, tdf
Things worth knowing:
- The same functions are available without the method syntax, for example
inspectpd.inspect_na(df). Because theimport inspectpdline looks unused, linters may flag it; either use the functions directly or add# noqa: F401. .view()returns a plotnine object. It displays on its own in a notebook; in a script or the REPL call.show()on it, or.save("plot.png").- Some result columns share a name with a pandas method (
corr,hist,size,min,max,mean,median). Read those with bracket syntax,result["corr"], becauseresult.corris the pandas method. - Column names must be unique. Inputs must be data frames; convert a Series
with
.to_frame().
Column types
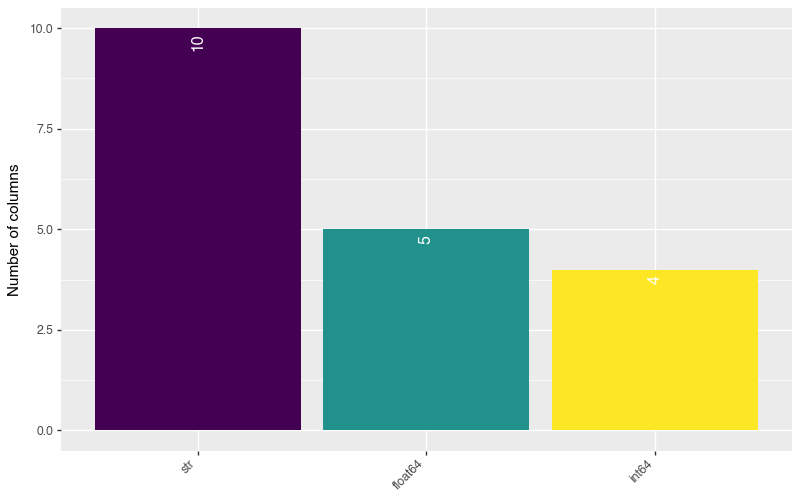
inspect_types() counts the columns of each dtype.
>>> tdf.inspect_types()
      type  cnt       pcnt                                           col_name
0      str   10  52.631579  [start_date, winner_name, winner_team, born, d...
1  float64    5  26.315789  [distance, time_overall, time_margin, height, ...
2    int64    4  21.052632             [edition, stage_wins, stages_led, age]
>>> tdf.inspect_types().view()
Memory usage
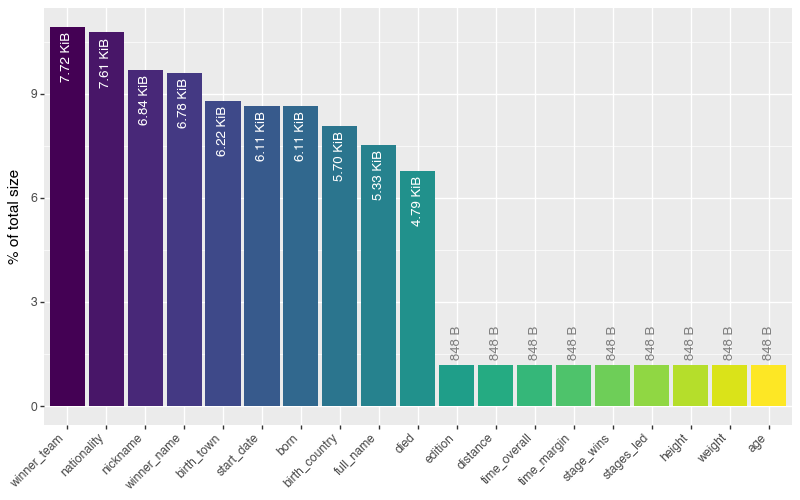
inspect_mem() reports the memory used by each column, with deep=True
accounting so that string columns are measured properly.
>>> tdf.inspect_mem().head()
      col_name  bytes      size       pcnt
0  winner_team   7905  7.72 KiB  10.926054
1  nationality   7790  7.61 KiB  10.767104
2     nickname   7006  6.84 KiB   9.683483
3  winner_name   6945  6.78 KiB   9.599171
4   birth_town   6371  6.22 KiB   8.805805
>>> tdf.inspect_mem().view()
Missing values
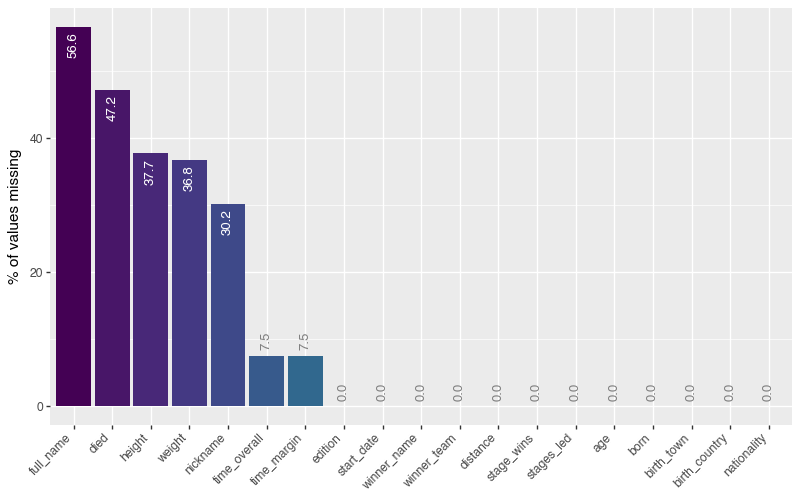
inspect_na() counts missing values in each column.
>>> tdf.inspect_na().head()
    col_name  cnt       pcnt
0  full_name   60  56.603774
1       died   50  47.169811
2     height   40  37.735849
3     weight   39  36.792453
4   nickname   32  30.188679
>>> tdf.inspect_na().view()
Correlation
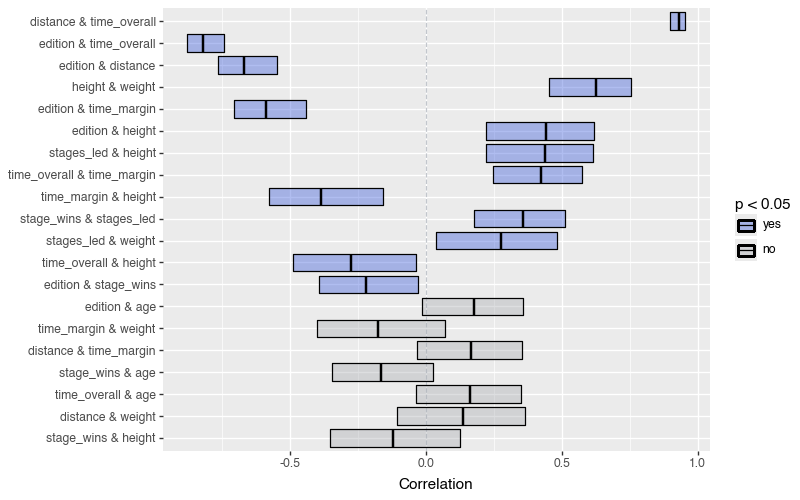
inspect_cor() returns one row per pair of numeric columns, strongest
correlation first, with a p-value and confidence interval from the Fisher z
transformation. pcnt_nna is the percentage of rows where both columns are
present; correlations use pairwise complete observations.
>>> tdf.inspect_cor().head()
      col_1         col_2    corr  p_value   lower   upper  pcnt_nna
0  distance  time_overall  0.9302      0.0  0.8974  0.9528   92.4528
1   edition  time_overall -0.8197      0.0 -0.8757 -0.7419   92.4528
2   edition      distance -0.6686      0.0 -0.7621 -0.5477  100.0000
3    height        weight  0.6272      0.0  0.4541  0.7546   62.2642
4   edition   time_margin -0.5874      0.0 -0.7038 -0.4403   92.4528
method can be "pearson" (the default), "spearman" or "kendall";
alpha sets the interval level; with_col restricts the output to
correlations with one column.
>>> tdf.inspect_cor(with_col="age", method="spearman").head(3)
        col_1 col_2    corr  p_value   lower   upper  pcnt_nna
0     edition   age  0.1818   0.0643 -0.0109  0.3614  100.0000
1  stage_wins   age -0.1739   0.0768 -0.3542  0.0189  100.0000
2      height   age  0.0840   0.5045 -0.1617  0.3200   62.2642
>>> tdf.inspect_cor().view(max_pairs=20)
The plot shows the interval for each pair, coloured by whether the p-value is
below the alpha the summary was computed with.
Feature imbalance
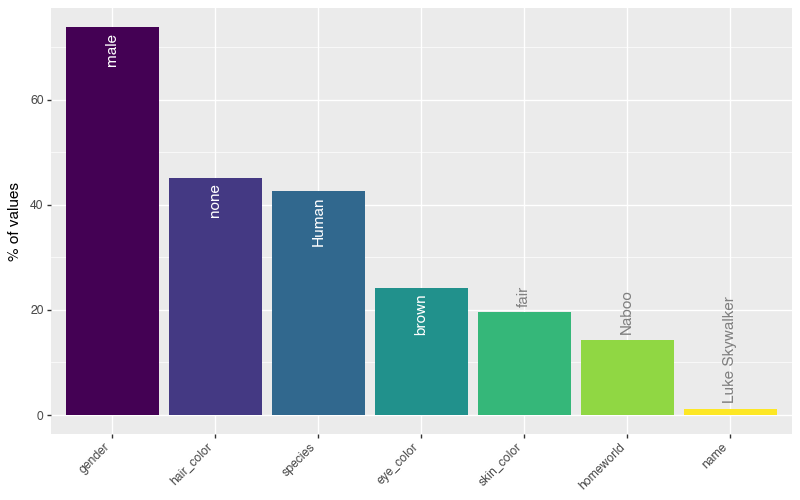
inspect_imb() finds the most common level in each categorical column and
how much of the column it takes up. Columns with category, object,
string or boolean dtype are treated as categorical.
>>> starwars.inspect_imb()
     col_name           value  cnt       pcnt
0      gender            male   62  73.809524
1  hair_color            none   37  45.121951
2     species           Human   35  42.682927
3   eye_color           brown   21  24.137931
4  skin_color            fair   17  19.540230
5   homeworld           Naboo   11  14.285714
6        name  Luke Skywalker    1   1.149425
>>> starwars.inspect_imb().view()
Numeric summaries
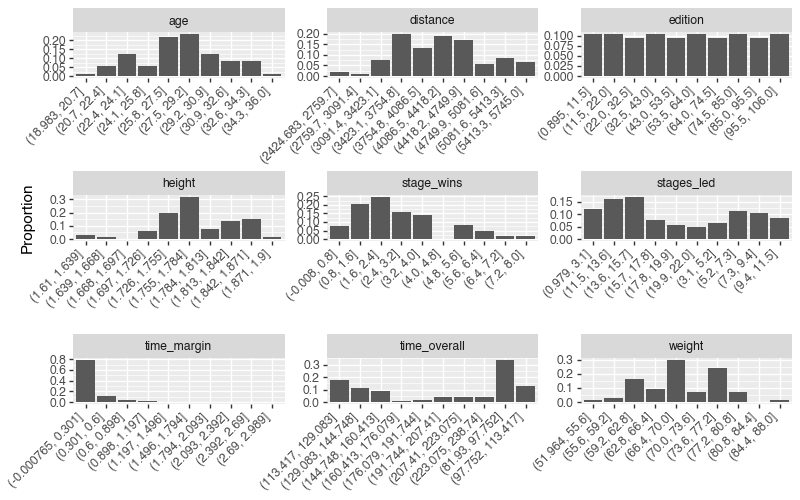
inspect_num() gives the usual summary statistics for every numeric column
(integer, float and nullable numeric dtypes), plus a ten-bin histogram in the
hist column.
>>> tdf.inspect_num().round(2).iloc[:, :9].head()
       col_name      min       q1   median  ...       q3      max      sd  pcnt_na
0       edition     1.00    27.25    53.50  ...    79.75   106.00   30.74     0.00
1      distance  2428.00  3657.88  4155.50  ...  4652.50  5745.00  704.28     0.00
2  time_overall    82.09    92.60   115.03  ...   142.68   238.74   41.56     7.55
3   time_margin     0.00     0.05     0.10  ...     0.25     2.99    0.48     7.55
4    stage_wins     0.00     1.00     2.00  ...     4.00     8.00    1.84     0.00
>>> tdf.inspect_num()["hist"][0].head(3)
           value      prop
0  (0.895, 11.5]  0.103774
1   (11.5, 22.0]  0.103774
2   (22.0, 32.5]  0.094340
>>> tdf.inspect_num().view()
Categorical levels
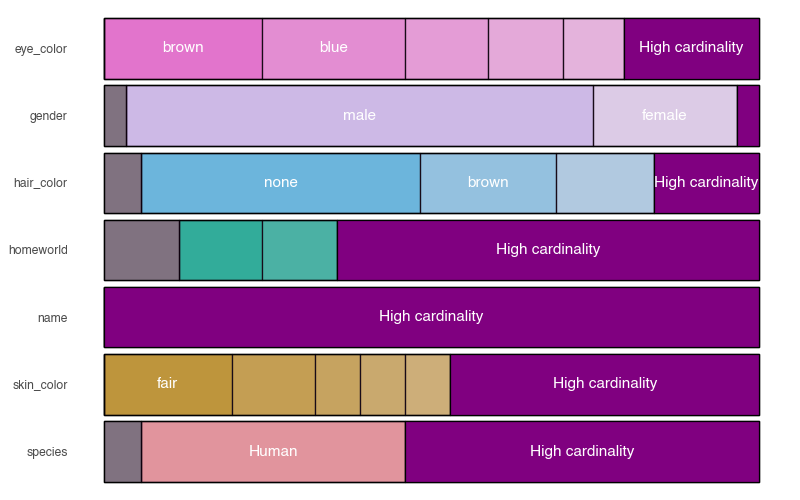
inspect_cat() tabulates every level of every categorical column. The
levels column holds a frame per column with the count and percentage of
each level; missing values are counted as a level.
>>> cat = starwars.inspect_cat()
>>> cat.drop(columns="levels")
     col_name  cnt          common  common_pcnt
0   eye_color   15           brown    24.137931
1      gender    5            male    71.264368
2  hair_color   13           none    42.528736
3   homeworld   49           Naboo    12.643678
4        name   87  Luke Skywalker     1.149425
5  skin_color   31           fair    19.540230
6     species   38           Human    40.229885
>>> cat["levels"][0].head(4)
    value       pcnt  cnt
0   brown  24.137931   21
1    blue  21.839080   19
2  yellow  12.643678   11
3   black  11.494253   10
The plot stacks the levels of each column. Missing values are shown in grey,
and high_cardinality pools levels that occur that many times or fewer into
a single purple block, which keeps columns of near-unique values readable.
>>> starwars.inspect_cat().view(high_cardinality=5)
Development
This project uses uv for environment management and pre-commit with ruff and mypy for linting, formatting and type checks.
# create the dev environment and install inspectpd (editable) + dev tools
uv sync

# install the git hooks
uv run pre-commit install

# run the test suite (any warning is a failure)
uv run pytest

# lint, format and type-check
uv run ruff check .
uv run ruff format .
uv run mypy

# build the sdist and wheel
uv build
To regenerate the plot images in docs/images/ after changing a plot, run
the .view() calls shown above and save each plot with
.save("docs/images/<name>.png", width=8, height=5, dpi=100).
Releasing to PyPI
The package version is derived from git tags via hatch-vcs. Tags must look
like v0.3.0; other tags are ignored. To cut a release:
git tag v0.3.0
git push origin v0.3.0
This triggers .github/workflows/release.yml, which builds the wheel and sdist, creates
a GitHub Release, and publishes to PyPI via OIDC (no API token needed).
One-time PyPI setup (Trusted Publisher): go to https://pypi.org/manage/account/publishing/ and add a publisher with:
| Field | Value |
|---|---|
| Owner | alastairrushworth |
| Repository | inspectpd |
| Workflow | release.yml |
| Environment | pypi |
Then create a matching pypi environment in the repo at
Settings → Environments → New environment.
1 maintainer

Release files for inspectpd 0.3.0
For a detailed explanation of source distributions (sdists) and built distributions (wheels), please see the package formats documentation.
Source distribution (sdist)
| File | Size | Uploaded | |
|---|---|---|---|
| inspectpd-0.3.0.tar.gz | 35.6 kB | Details |
Built distribution (wheel)
| File | Interpreter | ABI | Platform | Reset |
|---|---|---|---|---|
| inspectpd-0.3.0-py3-none-any.whl | Python 3 | none | any | Details |
Total release size: 71.4 kB
Release files / inspectpd-0.3.0.tar.gz
| Download URL | inspectpd-0.3.0.tar.gz |
|---|---|
| Size | 35.6 kB |
| Tags | Source |
|
SHA-256 checksum How to use checksums |
bf0f25d6f56bf559b8ffb5eb912e99eb45258bd4e80bcf3bdbcd1419f5c1e899
|
|
BLAKE2b-256 checksum How to use checksums |
ec0b10849fbe93d18c9acb6f68f16fe9c64824bfd77be3f6b19198dec282dc12
|
| Upload date | |
|
Uploaded using Trusted Publishing? What is trusted publishing? |
Yes |
| Uploaded via |
twine/7.0.0 CPython/3.13.14
|
Provenance
Provenance describes where a file came from. On PyPI, provenance is shared via attestations, which provide a verifiable record of the build or publishing details. View details, limitations and caveats.


PyPI Publish Attestation
PyPI verified that this artifact, at this checksum, originated from the publisher listed below.
Signed by GitHub Actions, verified by PyPI on Sep 8, 2026.
Transparency logRelease files / inspectpd-0.3.0-py3-none-any.whl
| Download URL | inspectpd-0.3.0-py3-none-any.whl |
|---|---|
| Size | 35.8 kB |
| Tags | Python 3 |
|
SHA-256 checksum How to use checksums |
575566d0e31ded4e692f685d706ee6f7d9b915f81484169ac129dc7211b3cee2
|
|
BLAKE2b-256 checksum How to use checksums |
3b3dc4ea620c9dee6c22ec62ea3a8e557b6c4937a2863265a6a9eb064f253792
|
| Upload date | |
|
Uploaded using Trusted Publishing? What is trusted publishing? |
Yes |
| Uploaded via |
twine/7.0.0 CPython/3.13.14
|
Provenance
Provenance describes where a file came from. On PyPI, provenance is shared via attestations, which provide a verifiable record of the build or publishing details. View details, limitations and caveats.
PyPI Publish Attestation
PyPI verified that this artifact, at this checksum, originated from the publisher listed below.
Signed by GitHub Actions, verified by PyPI on Sep 8, 2026.
Transparency log













