A Python library for analyzing solar observations from the Interface Region Imaging Spectrograph (IRIS).

Project description
interface-region-imaging-spectrograph


A Python library for downloading and analyzing images from the Interface Region Imaging Spectrograph (IRIS), a NASA small explorer satellite which observes the Sun in ultraviolet.
Installation
This library is published on PyPI and is installed using pip
pip install interface-region-imaging-spectrograph
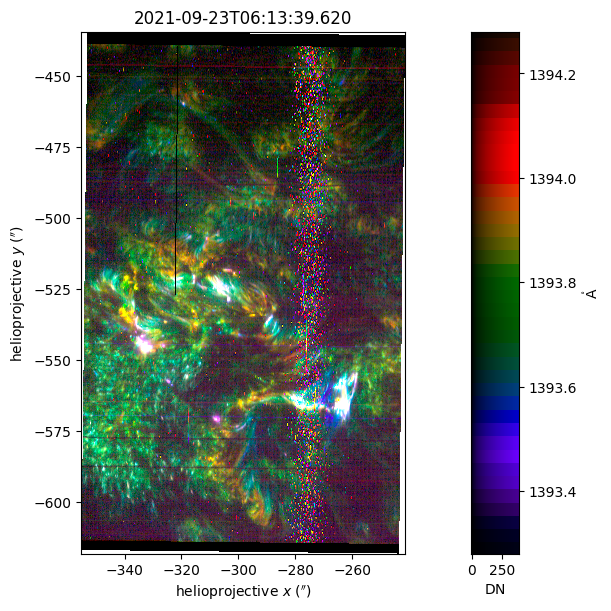
Gallery
Download spectrograph rasters from a specified time range and plot the Si IV 1403 Angstrom spectral line as a false-color image.
Release history Release notifications | RSS feed


Download files
Download the file for your platform. If you're not sure which to choose, learn more about installing packages.
Source Distribution
Built Distribution
Filter files by name, interpreter, ABI, and platform.
If you're not sure about the file name format, learn more about wheel file names.
Copy a direct link to the current filters
File details
Details for the file interface_region_imaging_spectrograph-1.0.1.tar.gz.
File metadata
- Download URL: interface_region_imaging_spectrograph-1.0.1.tar.gz
- Upload date:
- Size: 1.2 MB
- Tags: Source
- Uploaded using Trusted Publishing? No
- Uploaded via: twine/6.1.0 CPython/3.13.12
File hashes
| Algorithm | Hash digest | |
|---|---|---|
| SHA256 |
ca461a13d02df0f2140894af850935db06f48b9c0a3961df28d43ddac3a2e820
|
|
| MD5 |
e3a6dd70a1ed6cd865e8369f5095c53f
|
|
| BLAKE2b-256 |
3a07c9ee0760a17b53ad4c9b38cad4778ab48f3bc61e9d1ce5a240fa2c5c8d06
|
File details
Details for the file interface_region_imaging_spectrograph-1.0.1-py3-none-any.whl.
File metadata
- Download URL: interface_region_imaging_spectrograph-1.0.1-py3-none-any.whl
- Upload date:
- Size: 23.4 kB
- Tags: Python 3
- Uploaded using Trusted Publishing? No
- Uploaded via: twine/6.1.0 CPython/3.13.12
File hashes
| Algorithm | Hash digest | |
|---|---|---|
| SHA256 |
5224cb09909b03d96bb26f695deee9c2521569f93464dba571b0ec4c0edb26df
|
|
| MD5 |
5b050c06ab9c7dfa9bcaed77f6965b13
|
|
| BLAKE2b-256 |
278e85ac4557e5f19f822c21abe9a52ea32016bb9141d9fd20ae69df88cb78c8
|


