InterPareto: Pandas DataFrames to Interactive Pareto Analysis

Project description
InterPareto: Pandas DataFrames to Interactive Pareto Analysis
interpareto is a Python utility for creating interactive Pareto charts from pandas.DataFrame objects. It generates standalone HTML files with dynamic visualizations using Plotly.js—viewable in any browser without Jupyter notebooks, servers, or frameworks.
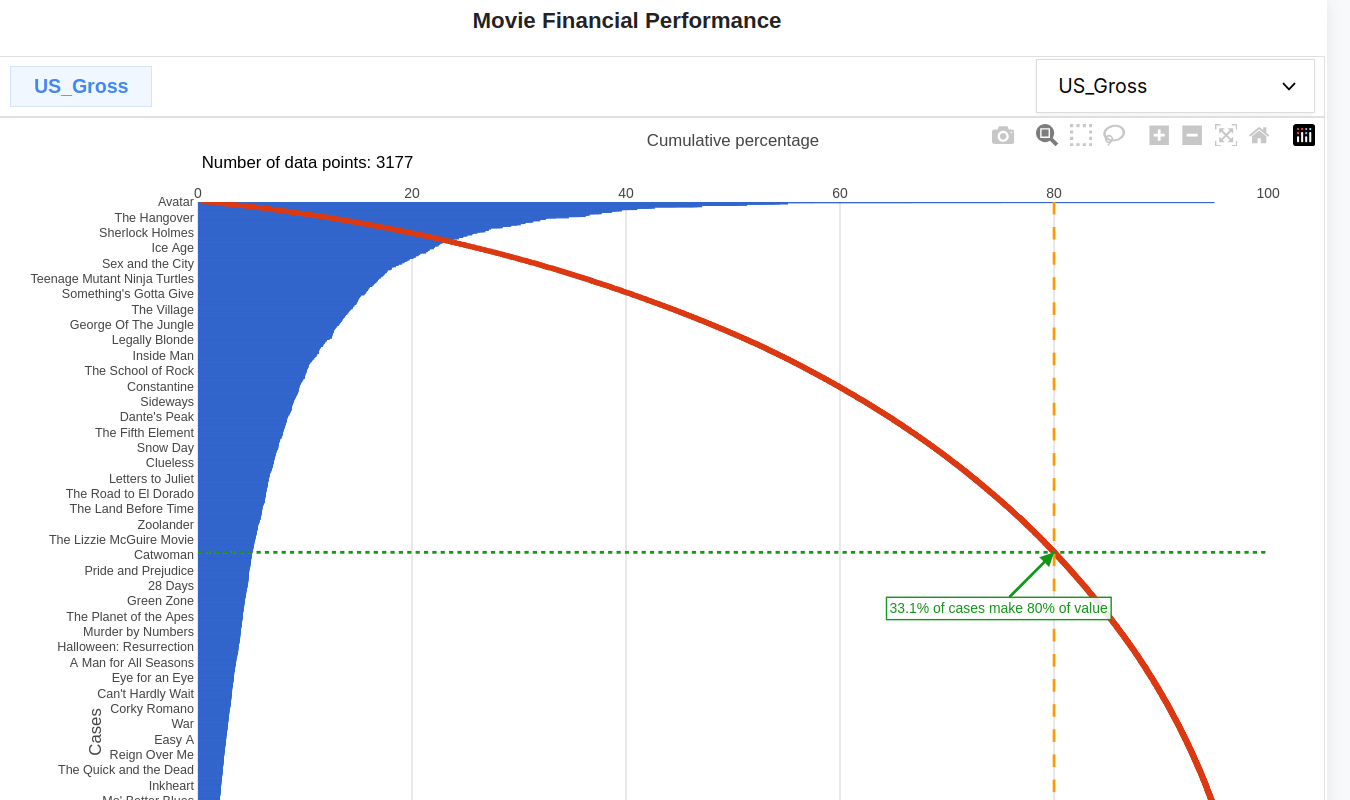
The result is an interactive chart, where the data column used in the plot can be switched.
Example that uses well known movie dataset.
📌 Note
InterPareto doesn’t use Plotly for Python or any server to run. Instead, it generates standalone HTML files with embedded interactive charts using Plotly.js (JavaScript). No server, Jupyter, or browser rendering engine is required at runtime.
This design allows charts to be:
- Viewed offline in any modern web browser,
- Embedded into web apps if needed.
Installation
pip install interpareto
Quick start
import pandas as pd
import interpareto as ipar
sample_df = ipar.generate_pareto_data(100)
ipar.render(sample_df, title="Sample Data Analysis")
Of course, not all datasets are suitable for this kind of analysis — but many are.
Ideal for analyzing:
- Positive numeric values (sales, defects, costs)
- Skewed distributions (few large, many small values)
- Categorical data with measurable impact
- Data w- here the 80/20 principle may apply
Avoid using with:
- Normally distributed data
- Data with many zero/negative values
- Data without clear categories
Features
- Converts
pandas.DataFrameto interactive standalone HTML Pareto charts - Dynamic column selection: Switch between different data columns in real-time
- Smart data processing: Automatically detects and removes index-like columns
- Data cleaning: Handles NaN values, negatives, and zeros with detailed reporting
- Self-contained HTML files with embedded data—no external dependencies at runtime
- Works independently of web servers—viewable offline in any browser
- Minimal HTML snippet generation: Generate embeddable HTML content for Flask or other web frameworks
Basic usage
import pandas as pd

import interpareto as ipar

# Simple example with 15 data points
df = pd.DataFrame({
    "Product": ["A", "B", "C", "D", "E", "F", "G", "H", "I", "J", "K", "L", "M", "N", "O"],
    "Sales": [5000, 3200, 2800, 2100, 1900, 1500, 1200, 900, 750, 650, 500, 400, 300, 200, 150],
    "Profit": [1200, 800, 333, 222, 40, 111, 100, 90, 12, 60, 60, 55, 45, 12, 2]
})

# Generate chart
ipar.render(df, title="Sales Analysis", to_file="sales_pareto.html")
Pareto analysis is based on the Pareto Principle (80/20 rule), which states that roughly 80% of effects come from 20% of causes. InterPareto automatically:
- Sorts data: Orders values from highest to lowest
- Calculates cumulative percentages: Shows running totals as percentage of whole
- Identifies the 80% threshold: Highlights where 80% of total value is reached
- Annotates key insights: Shows what percentage of categories contribute to 80% of value
Main Functions
render
ipar.render(
    df: pd.DataFrame,
    to_file: Optional[str] = None,
    title: str = "Pareto dashboard",
    templ_path: str = TEMPLATE_PATH,
    startfile: bool = True,
    warnings: bool = True
) -> Union[str, file_object]
Parameters:
df: Input pandas DataFrame with numeric columns for analysisto_file: Output HTML file path. If None, returns HTML string instead of writing filetitle: Title for the Pareto dashboardtempl_path: Path to custom HTML template (uses default if not specified)startfile: If True, automatically opens the generated HTML file in default browserwarnings: If True, displays data processing warnings in the output
Returns:
- HTML string if
to_file=None - File object if
to_fileis specified
render_inline
ipar.render_inline(
    df: pd.DataFrame,
    **kwargs
) -> str
Generates minimal HTML content suitable for embedding in Flask or other web framework templates. This function:
- Returns only the chart markup and JavaScript
- Excludes full HTML document structure (no
<html>,<head>,<body>tags) - Important: Requires Plotly.js to be loaded in the host page
- Perfect for embedding interactive Pareto analysis in existing web applications
Parameters:
- Same as
render()exceptto_fileis not allowed (always returns string)
generate_pareto_data
ipar.generate_pareto_data(N: int = 15) -> pd.DataFrame
Generates sample data following various statistical distributions for testing and demonstration purposes.
Parameters:
N: Number of data points to generate
Returns:
- DataFrame with sample data including Pareto, normal, uniform, and other distributions
Automatic Data Cleaning
InterPareto automatically processes your data to ensure optimal visualization:
- Index-like column detection: Removes columns that appear to be indices or sequential numbers
- Duplicate index handling: Removes duplicate row indices, keeping the first occurrence
- Numeric column selection: Automatically selects the first 10 numeric columns
- Missing value handling: Removes rows with NaN values
- Negative and zero filtering: Excludes rows with negative values or zeros (configurable)
Processing Warnings
The library provides detailed feedback about data processing:
# Example processing output
"""
Dropped column 'ID': looks like index
Column 'Revenue': 2 NaNs, (1 negative values, 3 zeros)
Column 'Customers': 0 NaNs, (0 negative values, 1 zeros)
"""
Web Framework Integration
Complete Flask Example
Here's a complete Flask application demonstrating how to embed interactive Pareto charts:
from flask import Flask, render_template_string
import interpareto as ipar

app = Flask(__name__)

@app.route("/")
def home():
    # Generate sample data (or use your own DataFrame)
    df = ipar.generate_pareto_data(50)

    df_title = "Pareto Chart Rendered inline in <strong>Flask</strong>"

    # Generate the embeddable Pareto chart HTML
    string_pareto = ipar.render_inline(df, title=df_title, warnings=False)

    return render_template_string(
        """
        <!DOCTYPE html>
        <html>
        <head>
            <title>Flask Pareto Dashboard</title>
            <meta name="viewport" content="width=device-width, initial-scale=1.0">

            <!-- Required: Plotly.js for chart rendering -->
            <script src="https://cdnjs.cloudflare.com/ajax/libs/plotly.js/2.26.0/plotly.min.js"></script>

            <style>
                body {
                    font-family: "Segoe UI", Roboto, sans-serif;
                    margin: 0;
                    padding: 20px;
                    background-color: #f8f9fa;
                }
                .container {
                    max-width: 1200px;
                    margin: 0 auto;
                    background: white;
                    padding: 20px;
                    border-radius: 8px;
                    box-shadow: 0 2px 10px rgba(0,0,0,0.1);
                }
                h1 {
                    color: #333;
                    text-align: center;
                    margin-bottom: 30px;
                }
            </style>
        </head>
        <body>
            <div class="container">
                <h1>My Flask Pareto Dashboard</h1>
                {{ inline_pareto | safe }}
            </div>
        </body>
        </html>
        """,
        inline_pareto=string_pareto,
    )

if __name__ == "__main__":
    app.run(debug=True)
Understanding Pareto Analysis
Chart Components
The generated Pareto chart includes:
- Horizontal bar chart: Shows individual values for each category
- Cumulative line: Displays running percentage total
- 80% threshold line: Horizontal dashed line at 80%
- Intersection annotation: Shows where cumulative line crosses 80%
- Dynamic controls: Dropdown to switch between different data columns
Customization Examples
📌 Note Currently, modifying chart colors or settings is possible by editing the built-in HTML/JS template or by using a custom template.
Note that the goal of this module is not to replicate functionality of Plotly for Python when it comes to customization.
# Use custom template
ipar.render(
    df,
    title="Branded Analysis",
    templ_path="custom_pareto_template.html",
    to_file="branded_pareto.html"
)

# Generate sample data for testing
sample_df = ipar.generate_pareto_data(100)
ipar.render(sample_df, title="Sample Data Analysis")
Requirements
- Python 3.7+
- pandas
- numpy
Chart Features
- Interactive tooltips: Hover for detailed information
- Column switching: Real-time data column selection
- Export options: Built-in Plotly export functionality
- Zoom and pan: Interactive chart exploration
Template System
Templates use comnt, a minimal markup system:
<!--[title-->
Dashboard Title
<!--title]-->

const data = /*[p_data*/ [...] /*p_data]*/;
MIT License
© Tomasz Sługocki
Release history Release notifications | RSS feed

Download files
Download the file for your platform. If you're not sure which to choose, learn more about installing packages.
Source Distribution
Built Distribution
Filter files by name, interpreter, ABI, and platform.
If you're not sure about the file name format, learn more about wheel file names.
Copy a direct link to the current filters
File details
Details for the file interpareto-0.0.2.tar.gz.
File metadata
- Download URL: interpareto-0.0.2.tar.gz
- Upload date:
- Size: 22.4 kB
- Tags: Source
- Uploaded using Trusted Publishing? No
- Uploaded via: twine/6.1.0 CPython/3.12.3
File hashes
| Algorithm | Hash digest | |
|---|---|---|
| SHA256 |
8136ac211fb253d9a9e34c9a2be512683c5aee77f335fd34362f6571fcc5928e
|
|
| MD5 |
d387edb560ea1e5140d0b4c198e845c2
|
|
| BLAKE2b-256 |
8559121123aa349cd46d8fdfbcca829ee9de9a74b8fcb38ea9270f54d1dec1d6
|
File details
Details for the file interpareto-0.0.2-py2.py3-none-any.whl.
File metadata
- Download URL: interpareto-0.0.2-py2.py3-none-any.whl
- Upload date:
- Size: 24.5 kB
- Tags: Python 2, Python 3
- Uploaded using Trusted Publishing? No
- Uploaded via: twine/6.1.0 CPython/3.12.3
File hashes
| Algorithm | Hash digest | |
|---|---|---|
| SHA256 |
906fbd1d5d6eb13e7c24fc1dd74510e4e075306aad1b5e3fd6dec2afe8aa1138
|
|
| MD5 |
20dcfec23fc0db0099688876aec2e0d6
|
|
| BLAKE2b-256 |
5a9167e84ec99d5c250549275bc866e63ad62d816cf88668dfd876bb08b88f66
|


