Python access to structure stock market information

Project description
invest
Python access to structure stock market information
To install: pip install invest
- invest
- Quick Start
- Configuring Ticker objects
- Getting (only) specific information about tickers
- BulkHistory
- All information
Quick Start
from invest import Tickers
Get a default list of tickers
tickers = Tickers()
tickers is a dict-like container of tickers. So you can do dict-like things with it, like...
- ask for it's length
len(tickers)
4039
- list the keys
list(tickers)[:5]
['EGLE', 'KMPH', 'LONG', 'CYBR', 'PTC']
- check for containment of a key
'GOOG' in tickers
True
The values of this dict-like object are Ticker instances.
ticker = tickers['GOOG']
ticker
Ticker('GOOG')
This ticker object is also dict-like. Let's see how many keys there are:
len(ticker)
40
What are these keys?
list(ticker)
['balancesheet',
 'dividends',
 'get_sustainability',
 'get_info',
 'get_institutional_holders',
 'sustainability',
 'quarterly_balance_sheet',
 'get_balance_sheet',
 'info',
 'quarterly_earnings',
 'isin',
 'earnings',
 'history',
 'get_balancesheet',
 'get_financials',
 'balance_sheet',
 'get_earnings',
 'options',
 'splits',
 'get_recommendations',
 'get_major_holders',
 'get_dividends',
 'actions',
 'recommendations',
 'cashflow',
 'get_cashflow',
 'get_splits',
 'major_holders',
 'institutional_holders',
 'option_chain',
 'get_actions',
 'quarterly_financials',
 'get_calendar',
 'quarterly_cashflow',
 'calendar',
 'financials',
 'quarterly_balancesheet',
 'get_mutualfund_holders',
 'get_isin',
 'mutualfund_holders']
Let's look at one of these, 'info', which contains a dict with a bunch of information about the ticker...
info = ticker['info']
print(*info, sep=', ')
zip, sector, fullTimeEmployees, longBusinessSummary, city, phone, state, country, companyOfficers, website, maxAge, address1, industry, previousClose, regularMarketOpen, twoHundredDayAverage, trailingAnnualDividendYield, payoutRatio, volume24Hr, regularMarketDayHigh, navPrice, averageDailyVolume10Day, totalAssets, regularMarketPreviousClose, fiftyDayAverage, trailingAnnualDividendRate, open, toCurrency, averageVolume10days, expireDate, yield, algorithm, dividendRate, exDividendDate, beta, circulatingSupply, startDate, regularMarketDayLow, priceHint, currency, trailingPE, regularMarketVolume, lastMarket, maxSupply, openInterest, marketCap, volumeAllCurrencies, strikePrice, averageVolume, priceToSalesTrailing12Months, dayLow, ask, ytdReturn, askSize, volume, fiftyTwoWeekHigh, forwardPE, fromCurrency, fiveYearAvgDividendYield, fiftyTwoWeekLow, bid, tradeable, dividendYield, bidSize, dayHigh, exchange, shortName, longName, exchangeTimezoneName, exchangeTimezoneShortName, isEsgPopulated, gmtOffSetMilliseconds, quoteType, symbol, messageBoardId, market, annualHoldingsTurnover, enterpriseToRevenue, beta3Year, profitMargins, enterpriseToEbitda, 52WeekChange, morningStarRiskRating, forwardEps, revenueQuarterlyGrowth, sharesOutstanding, fundInceptionDate, annualReportExpenseRatio, bookValue, sharesShort, sharesPercentSharesOut, fundFamily, lastFiscalYearEnd, heldPercentInstitutions, netIncomeToCommon, trailingEps, lastDividendValue, SandP52WeekChange, priceToBook, heldPercentInsiders, nextFiscalYearEnd, mostRecentQuarter, shortRatio, sharesShortPreviousMonthDate, floatShares, enterpriseValue, threeYearAverageReturn, lastSplitDate, lastSplitFactor, legalType, lastDividendDate, morningStarOverallRating, earningsQuarterlyGrowth, dateShortInterest, pegRatio, lastCapGain, shortPercentOfFloat, sharesShortPriorMonth, category, fiveYearAverageReturn, regularMarketPrice, logo_url
info['shortName']
'Alphabet Inc.'
info['sector']
'Communication Services'
df = ticker['history']
df
| Open | High | Low | Close | Volume | Dividends | Stock Splits | |
|---|---|---|---|---|---|---|---|
| Date | |||||||
| 2020-10-28 | 1559.739990 | 1561.349976 | 1514.619995 | 1516.619995 | 1834000 | 0 | 0 |
| 2020-10-29 | 1522.359985 | 1593.709961 | 1522.239990 | 1567.239990 | 2003100 | 0 | 0 |
| 2020-10-30 | 1672.109985 | 1687.000000 | 1604.459961 | 1621.010010 | 4329100 | 0 | 0 |
| 2020-11-02 | 1628.160034 | 1660.770020 | 1616.030029 | 1626.030029 | 2535400 | 0 | 0 |
| 2020-11-03 | 1631.780029 | 1661.699951 | 1616.619995 | 1650.209961 | 1661700 | 0 | 0 |
| 2020-11-04 | 1710.280029 | 1771.364990 | 1706.030029 | 1749.130005 | 3570900 | 0 | 0 |
| 2020-11-05 | 1781.000000 | 1793.640015 | 1750.510010 | 1763.369995 | 2065800 | 0 | 0 |
| 2020-11-06 | 1753.949951 | 1772.430054 | 1740.349976 | 1761.750000 | 1660900 | 0 | 0 |
| 2020-11-09 | 1790.900024 | 1818.060059 | 1760.020020 | 1763.000000 | 2268300 | 0 | 0 |
| 2020-11-10 | 1731.089966 | 1763.000000 | 1717.300049 | 1740.390015 | 2636100 | 0 | 0 |
| 2020-11-11 | 1750.000000 | 1764.219971 | 1747.364990 | 1752.709961 | 1264000 | 0 | 0 |
| 2020-11-12 | 1747.630005 | 1768.270020 | 1745.599976 | 1749.839966 | 1247500 | 0 | 0 |
| 2020-11-13 | 1757.630005 | 1781.040039 | 1744.550049 | 1777.020020 | 1499900 | 0 | 0 |
| 2020-11-16 | 1771.699951 | 1799.069946 | 1767.689941 | 1781.380005 | 1246800 | 0 | 0 |
| 2020-11-17 | 1776.939941 | 1785.000000 | 1767.000000 | 1770.150024 | 1147100 | 0 | 0 |
| 2020-11-18 | 1765.229980 | 1773.469971 | 1746.140015 | 1746.780029 | 1173500 | 0 | 0 |
| 2020-11-19 | 1738.380005 | 1769.589966 | 1737.005005 | 1763.920044 | 1249900 | 0 | 0 |
| 2020-11-20 | 1765.209961 | 1774.000000 | 1741.859985 | 1742.189941 | 2313500 | 0 | 0 |
| 2020-11-23 | 1749.599976 | 1753.900024 | 1717.719971 | 1734.859985 | 2161600 | 0 | 0 |
| 2020-11-24 | 1730.500000 | 1771.599976 | 1727.689941 | 1768.880005 | 1578000 | 0 | 0 |
| 2020-11-25 | 1772.890015 | 1778.540039 | 1756.540039 | 1771.430054 | 1045800 | 0 | 0 |
| 2020-11-27 | 1773.089966 | 1804.000000 | 1772.439941 | 1793.189941 | 884900 | 0 | 0 |
from mplfinance import plot as candlestick_plot  # pip install mplfinance if you don't have it already

candlestick_plot(df)
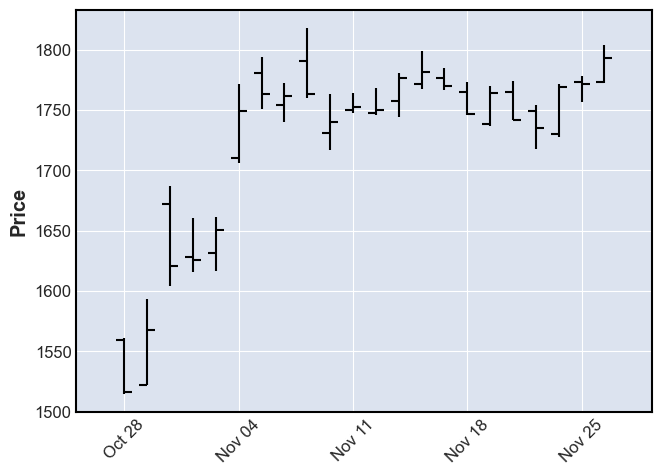
But these are daily metrics and only for the recent (yes, I'm doing this on a Thanksgiving week-end!) past.
How do I get something different? Like a longer history, and/or at a finer time-granularity?
See the next Configuring Ticker objects section on how to do that.
ticker_symbols argument
The first argument of Tickers is the ticker_symbols argument.
One can specify a collection (list, set, tuple, etc.) of ticker symbol strings, or a path to a file containing a pickle of such a collection.
The default is the string 'local_list' which has the effect of using a default list (currently of about 4000 tickers), but it's contents can change in the future.
Note that this ticker_symbols will have an effect on such affairs as list(tickers), len(tickers), or s in tickers, when it's relevant to use these.
But any Tickers object will allow access to any ticker symbol, regardless if it's in the ticker_symbols collection or not.
tickers = Tickers(ticker_symbols=('GOOG', 'AAPL', 'AMZN'))
assert list(tickers) == ['GOOG', 'AAPL', 'AMZN']
assert len(tickers) == 3
assert 'AAPL' in tickers
assert 'NFLX' not in tickers
# and yet we have access to NFLX info
assert tickers['NFLX']['info']['shortName'] == 'Netflix, Inc.'
Notes
- Both
TickersandTickerinstances have tab-triggered auto-suggestion enabled when you get an item. Example:tickers['AA<now press the TAB button...>. - The specification of
Configuring Ticker objects
Configure a Ticker instance
You can instantiate a Ticker instance directly, from any valid ticker symbol. The Tickers class is just a way to make a collection of tickers to work with.
from invest import Tickers, Ticker

ticker = Ticker('GOOG')
ticker
Ticker('GOOG')
But you'll notice that Ticker (and Tickers) have more than one argument.
from inspect import signature
print(signature(Tickers))
print(signature(Ticker))
(ticker_symbols='local_list', **kwargs_for_method_keys)
(ticker_symbol: str, **kwargs_for_method_keys)
What's this kwargs_for_method_keys?
Well, at the time of writing this, Ticker object is just a convenient dict-like interface to the attributes of the Ticker of the yfinance package which is itself a convenient python interface to the yahoo finance API.
When you do list(ticker), you're just getting a list of attributes of yfinance.Ticker: Both properties and methods that don't require any arguments. Though these methods don't require any arguments -- meaning all their arguments have defaults -- you can still specify if you want to use different defaults.
That's where kwargs_for_method_keys comes in. It specifies what arg=val pairs that should be used for particular methods of yfinance.Ticker.
If you want to know more about what you can do with the Ticker object, you might want to check out yfinance's and yahoo finance API's documentation.
For the basics though, invest provides the help_me_with function (as a standalone function or as a method in Tickers and Ticker) for quick access to essentials.
Ticker.help_me_with('history')
history
wraps <function TickerBase.history at 0x11a064940>, whose signature is:
(self, period='1mo', interval='1d', start=None, end=None, prepost=False, actions=True, auto_adjust=True, back_adjust=False, proxy=None, rounding=False, tz=None, **kwargs)

        :Parameters:
            period : str
                Valid periods: 1d,5d,1mo,3mo,6mo,1y,2y,5y,10y,ytd,max
                Either Use period parameter or use start and end
            interval : str
                Valid intervals: 1m,2m,5m,15m,30m,60m,90m,1h,1d,5d,1wk,1mo,3mo
                Intraday data cannot extend last 60 days
            start: str
                Download start date string (YYYY-MM-DD) or _datetime.
                Default is 1900-01-01
            end: str
                Download end date string (YYYY-MM-DD) or _datetime.
                Default is now
            prepost : bool
                Include Pre and Post market data in results?
                Default is False
            auto_adjust: bool
                Adjust all OHLC automatically? Default is True
            back_adjust: bool
                Back-adjusted data to mimic true historical prices
            proxy: str
                Optional. Proxy server URL scheme. Default is None
            rounding: bool
                Round values to 2 decimal places?
                Optional. Default is False = precision suggested by Yahoo!
            tz: str
                Optional timezone locale for dates.
                (default data is returned as non-localized dates)
            **kwargs: dict
                debug: bool
                    Optional. If passed as False, will suppress
                    error message printing to console.
Example
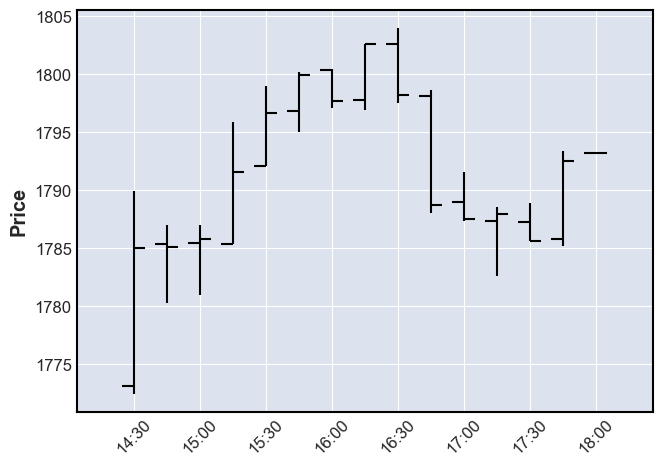
Here's you can get history to give you something different.
Say, get data for the last day, with a granularity of 15 minutes.
ticker = Ticker('GOOG', history=dict(period='1d', interval='15m'))
ticker
Ticker('GOOG', history={'period': '1d', 'interval': '15m'})
Your ticker is almost identical to the previous one we made, or the one we got from Tickers, except for the fact that asking for ticker['history'] is going to give you something different.
df = ticker['history']
df
| Open | High | Low | Close | Volume | Dividends | Stock Splits | |
|---|---|---|---|---|---|---|---|
| Datetime | |||||||
| 2020-11-27 09:30:00-05:00 | 1773.089966 | 1789.890015 | 1772.439941 | 1785.000000 | 119289 | 0 | 0 |
| 2020-11-27 09:45:00-05:00 | 1785.380005 | 1786.979980 | 1780.229980 | 1785.089966 | 50660 | 0 | 0 |
| 2020-11-27 10:00:00-05:00 | 1785.489990 | 1786.989990 | 1780.959961 | 1785.800049 | 50797 | 0 | 0 |
| 2020-11-27 10:15:00-05:00 | 1785.319946 | 1795.925049 | 1785.319946 | 1791.589966 | 72146 | 0 | 0 |
| 2020-11-27 10:30:00-05:00 | 1792.060059 | 1798.999878 | 1792.060059 | 1796.699951 | 48097 | 0 | 0 |
| 2020-11-27 10:45:00-05:00 | 1796.800049 | 1800.199951 | 1795.060059 | 1799.959961 | 56292 | 0 | 0 |
| 2020-11-27 11:00:00-05:00 | 1800.359985 | 1800.449951 | 1797.130005 | 1797.660034 | 41882 | 0 | 0 |
| 2020-11-27 11:15:00-05:00 | 1797.819946 | 1802.599976 | 1796.949951 | 1802.579956 | 60333 | 0 | 0 |
| 2020-11-27 11:30:00-05:00 | 1802.579956 | 1804.000000 | 1797.550049 | 1798.185059 | 45667 | 0 | 0 |
| 2020-11-27 11:45:00-05:00 | 1798.099976 | 1798.603027 | 1788.000000 | 1788.739990 | 47900 | 0 | 0 |
| 2020-11-27 12:00:00-05:00 | 1789.000000 | 1791.599976 | 1787.329956 | 1787.500000 | 36459 | 0 | 0 |
| 2020-11-27 12:15:00-05:00 | 1787.347534 | 1788.530029 | 1782.574951 | 1787.952759 | 46400 | 0 | 0 |
| 2020-11-27 12:30:00-05:00 | 1787.260010 | 1788.920044 | 1785.640015 | 1785.640015 | 45660 | 0 | 0 |
| 2020-11-27 12:45:00-05:00 | 1785.829956 | 1793.420044 | 1785.219971 | 1792.520020 | 97273 | 0 | 0 |
| 2020-11-27 13:00:00-05:00 | 1793.189941 | 1793.189941 | 1793.189941 | 1793.189941 | 46982 | 0 | 0 |
from mplfinance import plot as candlestick_plot  # pip install mplfinance if you don't have it already

candlestick_plt(df)
Configure a Tickers instance
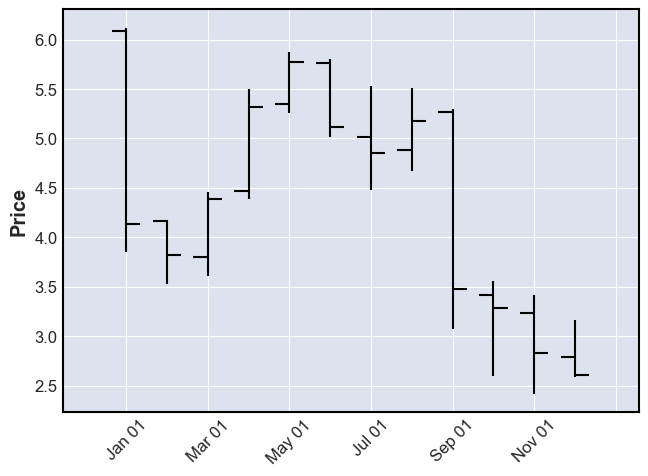
Let's say we wanted all ticker instances that Tickers gives us to have their history be over a specific interval of time in the past (say, during the 2020 pandemic), at 5 day intervals...
tickers = Tickers(ticker_symbols={'NFLX', 'AMZN', 'DAL'},  # demoing the fact that we can specify an explicit collection of ticker symbols
                  history=dict(start='2020-03-01', end='2020-10-31', interval='5d'))
list(tickers)
['DAL', 'AMZN', 'NFLX']
See that indeed, all tickers given by tickers are configured according to our wishes.
tickers['NFLX']
Ticker('NFLX', history={'start': '2020-03-01', 'end': '2020-10-31', 'interval': '5d'})
from mplfinance import plot as candlestick_plot # pip install mplfinance if you don't have it already
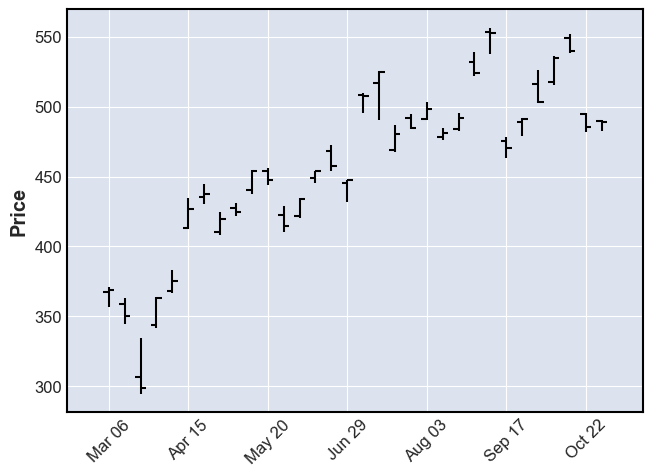
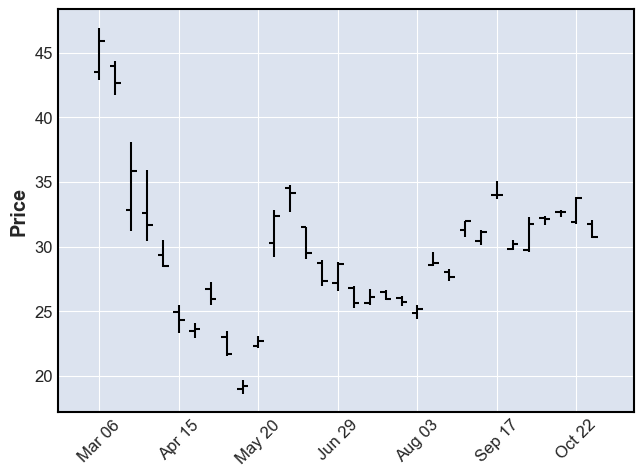
candlestick_plot(tickers['NFLX']['history'])
candlestick_plot(tickers['AMZN']['history'])
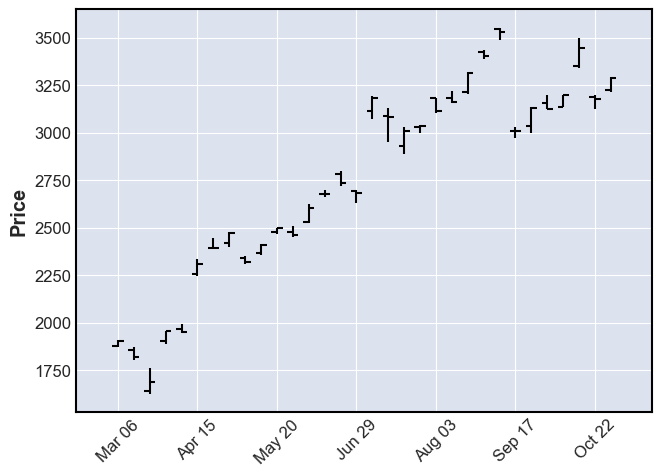
So Netflix and Amazon did well.
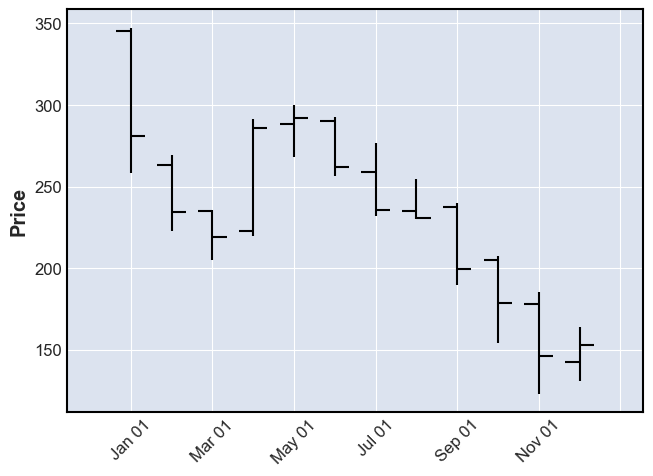
Delta, less so:
candlestick_plot(tickers['DAL']['history'])
Getting (only) specific information about tickers
Tickers and Ticker are convenient if you want to analyze several aspects of a ticker since you can poke around the various keys (e.g. info, history, etc.).
But if a particular analysis only needs one of these, it's more convenient to use TickersWithSpecificInfo,
which gives you the same interface as Tickers (in fact, it's a subclass if Tickers),
but fixes the key.
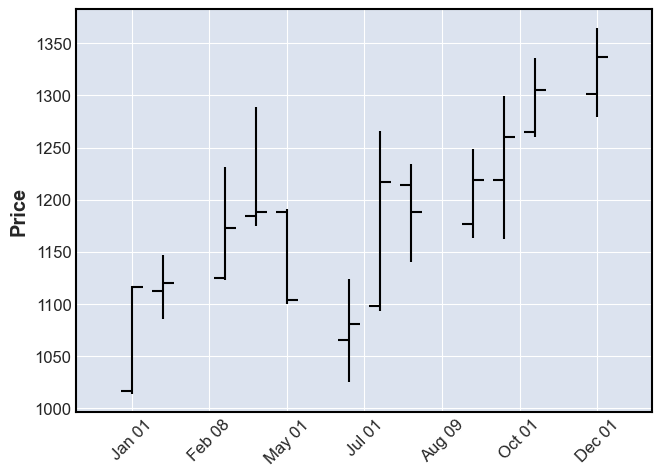
Example: Historical data
For example, if you're only interested in the historical data (a.k.a. the 'history' key), you might do this:
from invest import TickersWithSpecificInfo

tickers = TickersWithSpecificInfo(specific_key='history', start='2008-01-01', end='2009-01-01', interval='1mo')  # 2008 historical data, month granularity
tickers
TickersWithSpecificInfo(ticker_symbols=<local_list>, specific_key=history, start=2008-01-01, end=2009-01-01, interval=1mo)
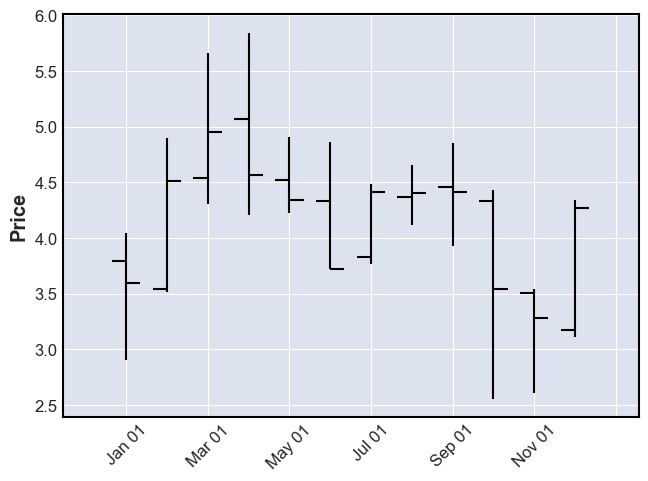
candlestick_plot(tickers['GOOG'])
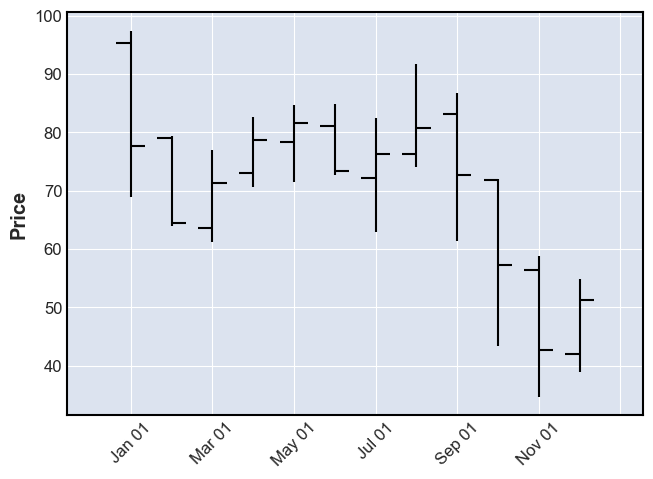
candlestick_plot(tickers['NFLX'])
candlestick_plot(tickers['AMZN'])
candlestick_plot(tickers['AAPL'])
Example: Specific 'info' fields
from invest import TickersWithSpecificInfo

the_info_that_i_want = ['shortName', 'sector', 'earningsQuarterlyGrowth', 'sharesShortPriorMonth']
tickers = TickersWithSpecificInfo(specific_key='info', val_trans=lambda d: {k: d[k] for k in the_info_that_i_want})
tickers
TickersWithSpecificInfo(ticker_symbols=<local_list>, specific_key=info, val_trans=<function <lambda> at 0x11c2374c0>)
Now, you won't get the overwhelming amount of information you usually get with info:
tickers['AAPL']
{'shortName': 'Apple Inc.',
 'sector': 'Technology',
 'earningsQuarterlyGrowth': -0.074,
 'sharesShortPriorMonth': 83252522}
faang_tickers = ('FB', 'AMZN', 'AAPL', 'NFLX', 'GOOG')
the_info_that_i_want = ['shortName', 'sector', 'earningsQuarterlyGrowth', 'sharesShortPriorMonth']
tickers = TickersWithSpecificInfo(faang_tickers, specific_key='info', val_trans=lambda d: {k: d[k] for k in the_info_that_i_want})
tickers
TickersWithSpecificInfo(ticker_symbols=('FB', 'AMZN', 'AAPL', 'NFLX', 'GOOG'), specific_key=info, val_trans=<function <lambda> at 0x11c237a60>)
info_df = pd.DataFrame(list(tickers.values()))
info_df
| shortName | sector | earningsQuarterlyGrowth | sharesShortPriorMonth | |
|---|---|---|---|---|
| 0 | Facebook, Inc. | Communication Services | 0.288 | 21187652 |
| 1 | Amazon.com, Inc. | Consumer Cyclical | 1.967 | 2509939 |
| 2 | Apple Inc. | Technology | -0.074 | 83252522 |
| 3 | Netflix, Inc. | Communication Services | 0.187 | 9416477 |
| 4 | Alphabet Inc. | Communication Services | 0.591 | 2381334 |
BulkHistory
from invest import BulkHistory

tickers = BulkHistory(start='2019-01-01', end='2020-01-01', interval='1mo')  # 2019 historical data, month granularity
tickers
BulkHistory(ticker_symbols=['FB', 'AMZN', 'AAPL', 'NFLX', 'GOOG'], history={'start': '2019-01-01', 'end': '2020-01-01', 'interval': '1mo'})
candlestick_plot(tickers['FB'])
[*********************100%***********************] 5 of 5 completed
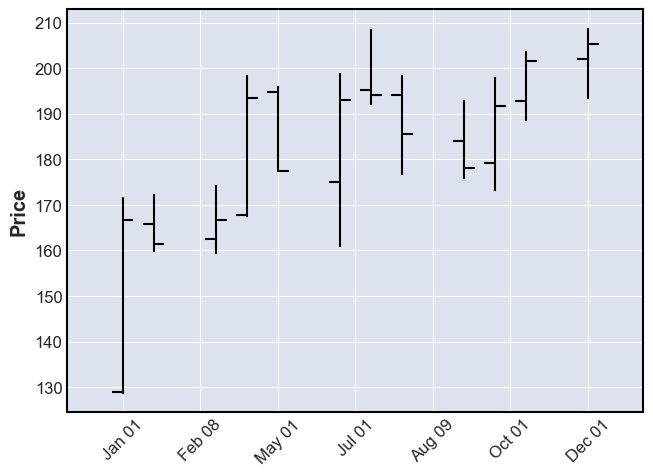
Notice that the data doesn't download again when we ask for GOOG data. That's because the first download bulk downloaded the data for our whole list of ticker symbols.
candlestick_plot(tickers['GOOG'])
Notes
-
- Though
Tickersallows you to deal with a collection of tickers, it does so (for time being) by calling yahoo's API for each individual ticker. The API does, on the other hand, contain some bulk tickers routes which we intend to integrate. For historical data (history), we haveBulkHistorythat uses the bulk API (throughyfinance.Tickers), but for other information (such at theinfokey), we don't (yet).
- Though
All information
Some utils to get all data on a single ticker.
from invest import Ticker
from invest import all_info, all_info_printable_string

ticker = Ticker('GOOG')
d = dict(all_info(ticker))  # all_info is a generator of (key, val) pairs (only for non-empty values), so can use dict to accumulate
list(d)  # list of keys (data names) we have data (values) for, for the given ticker
['financials',
 'quarterly_balance_sheet',
 'institutional_holders',
 'major_holders',
 'history',
 'quarterly_earnings',
 'info',
 'mutualfund_holders',
 'calendar',
 'option_chain',
 'quarterly_cashflow',
 'recommendations',
 'cashflow',
 'options',
 'balance_sheet',
 'quarterly_financials',
 'isin',
 'earnings']
print(f"The following data is for ticker: {ticker.ticker_symbol}\n\n")
print(all_info_printable_string(ticker))
The following data is for ticker: GOOG
----------financials-------------
2019-12-31 2018-12-31 2017-12-31 \
Research Development 2.6018e+10 2.1419e+10 1.6625e+10
Effect Of Accounting Charges None None None
Income Before Tax 3.9625e+10 3.4913e+10 2.7193e+10
Minority Interest None None None
Net Income 3.4343e+10 3.0736e+10 1.2662e+10
Selling General Administrative 2.7461e+10 2.3256e+10 1.9733e+10
Gross Profit 8.9961e+10 7.727e+10 6.5272e+10
Ebit 3.6482e+10 3.2595e+10 2.8914e+10
Operating Income 3.6482e+10 3.2595e+10 2.8914e+10
Other Operating Expenses None None None
Interest Expense -1e+08 -1.14e+08 -1.09e+08
Extraordinary Items None None None
Non Recurring None None None
Other Items None None None
Income Tax Expense 5.282e+09 4.177e+09 1.4531e+10
Total Revenue 1.61857e+11 1.36819e+11 1.10855e+11
Total Operating Expenses 1.25375e+11 1.04224e+11 8.1941e+10
Cost Of Revenue 7.1896e+10 5.9549e+10 4.5583e+10
Total Other Income Expense Net 3.143e+09 2.318e+09 -1.721e+09
Discontinued Operations None None None
Net Income From Continuing Ops 3.4343e+10 3.0736e+10 1.2662e+10
Net Income Applicable To Common Shares 3.4343e+10 3.0736e+10 1.2662e+10
2016-12-31
Research Development 1.3948e+10
Effect Of Accounting Charges None
Income Before Tax 2.415e+10
Minority Interest None
Net Income 1.9478e+10
Selling General Administrative 1.747e+10
Gross Profit 5.5134e+10
Ebit 2.3716e+10
Operating Income 2.3716e+10
Other Operating Expenses None
Interest Expense -1.24e+08
Extraordinary Items None
Non Recurring None
Other Items None
Income Tax Expense 4.672e+09
Total Revenue 9.0272e+10
Total Operating Expenses 6.6556e+10
Cost Of Revenue 3.5138e+10
Total Other Income Expense Net 4.34e+08
Discontinued Operations None
Net Income From Continuing Ops 1.9478e+10
Net Income Applicable To Common Shares 1.9478e+10
----------quarterly_balance_sheet-------------
2020-09-30 2020-06-30 2020-03-31 \
Intangible Assets 1.520000e+09 1.697000e+09 1.840000e+09
Total Liab 8.632300e+10 7.117000e+10 6.974400e+10
Total Stockholder Equity 2.129200e+11 2.073220e+11 2.036590e+11
Other Current Liab 2.406800e+10 2.193400e+10 2.187200e+10
Total Assets 2.992430e+11 2.784920e+11 2.734030e+11
Common Stock 5.730700e+10 5.593700e+10 5.368800e+10
Other Current Assets 5.425000e+09 5.579000e+09 5.165000e+09
Retained Earnings 1.555670e+11 1.516810e+11 1.510680e+11
Other Liab 1.323700e+10 1.278500e+10 1.406300e+10
Good Will 2.087000e+10 2.082400e+10 2.073400e+10
Treasury Stock 4.600000e+07 -2.960000e+08 -1.097000e+09
Other Assets 3.799000e+09 3.626000e+09 3.478000e+09
Cash 2.012900e+10 1.774200e+10 1.964400e+10
Total Current Liabilities 4.820000e+10 4.365800e+10 4.018900e+10
Deferred Long Term Asset Charges 9.720000e+08 8.950000e+08 7.300000e+08
Short Long Term Debt 9.990000e+08 9.990000e+08 NaN
Other Stockholder Equity 4.600000e+07 -2.960000e+08 -1.097000e+09
Property Plant Equipment 9.358200e+10 9.031500e+10 8.796600e+10
Total Current Assets 1.643690e+11 1.490690e+11 1.470180e+11
Long Term Investments 1.510300e+10 1.296100e+10 1.236700e+10
Net Tangible Assets 1.905300e+11 1.848010e+11 1.810850e+11
Short Term Investments 1.124670e+11 1.033380e+11 9.758500e+10
Net Receivables 2.551300e+10 2.159500e+10 2.373500e+10
Long Term Debt 1.282800e+10 2.963000e+09 3.960000e+09
Inventory 8.350000e+08 8.150000e+08 8.890000e+08
Accounts Payable 4.391000e+09 4.064000e+09 4.099000e+09
2019-12-31
Intangible Assets 1.979000e+09
Total Liab 7.446700e+10
Total Stockholder Equity 2.014420e+11
Other Current Liab 2.215900e+10
Total Assets 2.759090e+11
Common Stock 5.055200e+10
Other Current Assets 4.412000e+09
Retained Earnings 1.521220e+11
Other Liab 1.447800e+10
Good Will 2.062400e+10
Treasury Stock -1.232000e+09
Other Assets 3.063000e+09
Cash 1.849800e+10
Total Current Liabilities 4.522100e+10
Deferred Long Term Asset Charges 7.210000e+08
Short Long Term Debt NaN
Other Stockholder Equity -1.232000e+09
Property Plant Equipment 8.458700e+10
Total Current Assets 1.525780e+11
Long Term Investments 1.307800e+10
Net Tangible Assets 1.788390e+11
Short Term Investments 1.011770e+11
Net Receivables 2.749200e+10
Long Term Debt 3.958000e+09
Inventory 9.990000e+08
Accounts Payable 5.561000e+09
----------institutional_holders-------------
Holder Shares Date Reported % Out \
0 Vanguard Group, Inc. (The) 22204175 2020-09-29 0.0673
1 Blackrock Inc. 20032538 2020-09-29 0.0607
2 Price (T.Rowe) Associates Inc 13396372 2020-09-29 0.0406
3 State Street Corporation 11589194 2020-09-29 0.0351
4 FMR, LLC 7687258 2020-09-29 0.0233
5 Geode Capital Management, LLC 4431554 2020-09-29 0.0134
6 Capital International Investors 4071062 2020-09-29 0.0123
7 Northern Trust Corporation 3981710 2020-09-29 0.0121
8 AllianceBernstein, L.P. 3889575 2020-09-29 0.0118
9 Bank Of New York Mellon Corporation 3519043 2020-09-29 0.0107
Value
0 32631255580
1 29439817844
2 19687308291
3 17031479502
4 11297194356
5 6512611758
6 5982832715
7 5851521016
8 5716119420
9 5171585592
----------major_holders-------------
0 1
0 5.84% % of Shares Held by All Insider
1 68.32% % of Shares Held by Institutions
2 72.56% % of Float Held by Institutions
3 3396 Number of Institutions Holding Shares
----------history-------------
Open High Low Close Volume \
Date
2020-10-30 1672.109985 1687.000000 1604.459961 1621.010010 4329100
2020-11-02 1628.160034 1660.770020 1616.030029 1626.030029 2535400
2020-11-03 1631.780029 1661.699951 1616.619995 1650.209961 1661700
2020-11-04 1710.280029 1771.364990 1706.030029 1749.130005 3570900
2020-11-05 1781.000000 1793.640015 1750.510010 1763.369995 2065800
2020-11-06 1753.949951 1772.430054 1740.349976 1761.750000 1660900
2020-11-09 1790.900024 1818.060059 1760.020020 1763.000000 2268300
2020-11-10 1731.089966 1763.000000 1717.300049 1740.390015 2636100
2020-11-11 1750.000000 1764.219971 1747.364990 1752.709961 1264000
2020-11-12 1747.630005 1768.270020 1745.599976 1749.839966 1247500
2020-11-13 1757.630005 1781.040039 1744.550049 1777.020020 1499900
2020-11-16 1771.699951 1799.069946 1767.689941 1781.380005 1246800
2020-11-17 1776.939941 1785.000000 1767.000000 1770.150024 1147100
2020-11-18 1765.229980 1773.469971 1746.140015 1746.780029 1173500
2020-11-19 1738.380005 1769.589966 1737.005005 1763.920044 1249900
2020-11-20 1765.209961 1774.000000 1741.859985 1742.189941 2313500
2020-11-23 1749.599976 1753.900024 1717.719971 1734.859985 2161600
2020-11-24 1730.500000 1771.599976 1727.689941 1768.880005 1578000
2020-11-25 1772.890015 1778.540039 1756.540039 1771.430054 1045800
2020-11-27 1773.089966 1804.000000 1772.439941 1793.189941 884900
2020-11-30 1781.180054 1788.064941 1755.010010 1765.175049 871053
Dividends Stock Splits
Date
2020-10-30 0 0
2020-11-02 0 0
2020-11-03 0 0
2020-11-04 0 0
2020-11-05 0 0
2020-11-06 0 0
2020-11-09 0 0
2020-11-10 0 0
2020-11-11 0 0
2020-11-12 0 0
2020-11-13 0 0
2020-11-16 0 0
2020-11-17 0 0
2020-11-18 0 0
2020-11-19 0 0
2020-11-20 0 0
2020-11-23 0 0
2020-11-24 0 0
2020-11-25 0 0
2020-11-27 0 0
2020-11-30 0 0
----------quarterly_earnings-------------
Revenue Earnings
Quarter
4Q2019 46075000000 10671000000
1Q2020 41159000000 6836000000
2Q2020 38297000000 6959000000
3Q2020 46173000000 11247000000
----------info-------------
{'zip': '94043', 'sector': 'Communication Services', 'fullTimeEmployees': 132121, 'longBusinessSummary': 'Alphabet Inc. provides online advertising services in the United States, Europe, the Middle East, Africa, the Asia-Pacific, Canada, and Latin America. It offers performance and brand advertising services. The company operates through Google and Other Bets segments. The Google segment offers products, such as Ads, Android, Chrome, Google Cloud, Google Maps, Google Play, Hardware, Search, and YouTube, as well as technical infrastructure. It also offers digital content, cloud services, hardware devices, and other miscellaneous products and services. The Other Bets segment includes businesses, including Access, Calico, CapitalG, GV, Verily, Waymo, and X, as well as Internet and television services. The company has an agreement with Sabre Corporation to develop an artificial intelligence-driven technology platform for travel. Alphabet Inc. was founded in 1998 and is headquartered in Mountain View, California.', 'city': 'Mountain View', 'phone': '650-253-0000', 'state': 'CA', 'country': 'United States', 'companyOfficers': [], 'website': 'http://www.abc.xyz', 'maxAge': 1, 'address1': '1600 Amphitheatre Parkway', 'industry': 'Internet Content & Information', 'previousClose': 1793.19, 'regularMarketOpen': 1781.18, 'twoHundredDayAverage': 1534.4911, 'trailingAnnualDividendYield': None, 'payoutRatio': 0, 'volume24Hr': None, 'regularMarketDayHigh': 1788.065, 'navPrice': None, 'averageDailyVolume10Day': 1596760, 'totalAssets': None, 'regularMarketPreviousClose': 1793.19, 'fiftyDayAverage': 1673.1482, 'trailingAnnualDividendRate': None, 'open': 1781.18, 'toCurrency': None, 'averageVolume10days': 1596760, 'expireDate': None, 'yield': None, 'algorithm': None, 'dividendRate': None, 'exDividendDate': None, 'beta': 1.023111, 'circulatingSupply': None, 'startDate': None, 'regularMarketDayLow': 1755.01, 'priceHint': 2, 'currency': 'USD', 'trailingPE': 34.105736, 'regularMarketVolume': 870307, 'lastMarket': None, 'maxSupply': None, 'openInterest': None, 'marketCap': 1191815020544, 'volumeAllCurrencies': None, 'strikePrice': None, 'averageVolume': 1823157, 'priceToSalesTrailing12Months': 6.9411025, 'dayLow': 1755.01, 'ask': 1763.88, 'ytdReturn': None, 'askSize': 1100, 'volume': 870307, 'fiftyTwoWeekHigh': 1818.06, 'forwardPE': 28.793476, 'fromCurrency': None, 'fiveYearAvgDividendYield': None, 'fiftyTwoWeekLow': 1013.536, 'bid': 1762.58, 'tradeable': False, 'dividendYield': None, 'bidSize': 900, 'dayHigh': 1788.065, 'exchange': 'NMS', 'shortName': 'Alphabet Inc.', 'longName': 'Alphabet Inc.', 'exchangeTimezoneName': 'America/New_York', 'exchangeTimezoneShortName': 'EST', 'isEsgPopulated': False, 'gmtOffSetMilliseconds': '-18000000', 'quoteType': 'EQUITY', 'symbol': 'GOOG', 'messageBoardId': 'finmb_29096', 'market': 'us_market', 'annualHoldingsTurnover': None, 'enterpriseToRevenue': 6.452, 'beta3Year': None, 'profitMargins': 0.20798999, 'enterpriseToEbitda': 23.045, '52WeekChange': 0.3901559, 'morningStarRiskRating': None, 'forwardEps': 61.3, 'revenueQuarterlyGrowth': None, 'sharesOutstanding': 329867008, 'fundInceptionDate': None, 'annualReportExpenseRatio': None, 'bookValue': 314.169, 'sharesShort': 2606917, 'sharesPercentSharesOut': 0.0039, 'fundFamily': None, 'lastFiscalYearEnd': 1577750400, 'heldPercentInstitutions': 0.68324995, 'netIncomeToCommon': 35712999424, 'trailingEps': 51.752, 'lastDividendValue': None, 'SandP52WeekChange': 0.16843343, 'priceToBook': 5.6181226, 'heldPercentInsiders': 0.0584, 'nextFiscalYearEnd': 1640908800, 'mostRecentQuarter': 1601424000, 'shortRatio': 1.32, 'sharesShortPreviousMonthDate': 1602720000, 'floatShares': 609554771, 'enterpriseValue': 1107906789376, 'threeYearAverageReturn': None, 'lastSplitDate': 1430092800, 'lastSplitFactor': '10000000:10000000', 'legalType': None, 'lastDividendDate': None, 'morningStarOverallRating': None, 'earningsQuarterlyGrowth': 0.591, 'dateShortInterest': 1605225600, 'pegRatio': 2.09, 'lastCapGain': None, 'shortPercentOfFloat': None, 'sharesShortPriorMonth': 2381334, 'category': None, 'fiveYearAverageReturn': None, 'regularMarketPrice': 1781.18, 'logo_url': 'https://logo.clearbit.com/abc.xyz'}
----------mutualfund_holders-------------
Holder Shares Date Reported \
0 Vanguard Total Stock Market Index Fund 8166693 2020-06-29
1 Vanguard 500 Index Fund 6100848 2020-06-29
2 Growth Fund Of America Inc 3027888 2020-09-29
3 SPDR S&P 500 ETF Trust 3008850 2020-10-30
4 Invesco ETF Tr-Invesco QQQ Tr, Series 1 ETF 2986897 2020-10-30
5 Price (T.Rowe) Blue Chip Growth Fund Inc. 2867378 2020-06-29
6 Fidelity 500 Index Fund 2612122 2020-08-30
7 Vanguard Institutional Index Fund-Institutiona... 2566970 2020-06-29
8 Vanguard Growth Index Fund 2263691 2020-06-29
9 iShares Core S&P 500 ETF 2254397 2020-09-29
% Out Value
0 0.0248 11544518891
1 0.0185 8624219741
2 0.0092 4449784204
3 0.0091 4877375938
4 0.0091 4841789905
5 0.0087 4053354214
6 0.0079 4268677529
7 0.0078 3628694461
8 0.0069 3199976234
9 0.0068 3313061831
----------calendar-------------
Empty DataFrame
Columns: []
Index: [Earnings Date, Earnings Average, Earnings Low, Earnings High, Revenue Average, Revenue Low, Revenue High]
----------option_chain-------------
Options(calls=Empty DataFrame
Columns: [contractSymbol, lastTradeDate, strike, lastPrice, bid, ask, change, percentChange, volume, openInterest, impliedVolatility, inTheMoney, contractSize, currency]
Index: [], puts=Empty DataFrame
Columns: [contractSymbol, lastTradeDate, strike, lastPrice, bid, ask, change, percentChange, volume, openInterest, impliedVolatility, inTheMoney, contractSize, currency]
Index: [])
----------quarterly_cashflow-------------
2020-09-30 2020-06-30 \
Investments -9.372000e+09 -3.011000e+09
Change To Liabilities 7.000000e+08 2.570000e+08
Total Cashflows From Investing Activities -1.519700e+10 -8.448000e+09
Net Borrowings 9.802000e+09 -3.500000e+07
Total Cash From Financing Activities 5.460000e+08 -7.498000e+09
Change To Operating Activities 3.726000e+09 1.367000e+09
Net Income 1.124700e+10 6.959000e+09
Change In Cash 2.387000e+09 -1.902000e+09
Repurchase Of Stock -7.897000e+09 -6.852000e+09
Effect Of Exchange Rate 3.500000e+07 5.100000e+07
Total Cash From Operating Activities 1.700300e+10 1.399300e+10
Depreciation 3.478000e+09 3.367000e+09
Other Cashflows From Investing Activities -4.060000e+08 1.190000e+08
Change To Account Receivables -3.601000e+09 -8.000000e+07
Other Cashflows From Financing Activities -1.359000e+09 -6.110000e+08
Change To Netincome 1.522000e+09 1.340000e+09
Capital Expenditures -5.406000e+09 -5.391000e+09
2020-03-31 2019-12-31
Investments 3.936000e+09 3.370000e+09
Change To Liabilities -7.980000e+08 1.000000e+09
Total Cashflows From Investing Activities -1.847000e+09 -4.703000e+09
Net Borrowings -4.900000e+07 -4.700000e+07
Total Cash From Financing Activities -8.186000e+09 -7.326000e+09
Change To Operating Activities -4.517000e+09 5.481000e+09
Net Income 6.836000e+09 1.067100e+10
Change In Cash 1.146000e+09 2.466000e+09
Repurchase Of Stock -8.496000e+09 -6.098000e+09
Effect Of Exchange Rate -2.720000e+08 6.800000e+07
Total Cash From Operating Activities 1.145100e+10 1.442700e+10
Depreciation 3.108000e+09 3.283000e+09
Other Cashflows From Investing Activities 4.120000e+08 1.210000e+08
Change To Account Receivables 2.602000e+09 -4.365000e+09
Other Cashflows From Financing Activities 3.590000e+08 -1.181000e+09
Change To Netincome 4.465000e+09 1.695000e+09
Capital Expenditures -6.005000e+09 -6.052000e+09
----------recommendations-------------
Firm To Grade From Grade Action
Date
2012-03-14 15:28:00 Oxen Group Hold init
2012-03-28 06:29:00 Citigroup Buy main
2012-04-03 08:45:00 Global Equities Research Overweight main
2012-04-05 06:34:00 Deutsche Bank Buy main
2012-04-09 06:03:00 Pivotal Research Buy main
... ... ... ... ...
2020-07-31 11:44:08 Raymond James Outperform main
2020-08-25 17:05:53 UBS Buy main
2020-10-30 11:38:47 Raymond James Outperform main
2020-10-30 12:38:37 Credit Suisse Outperform main
2020-10-30 17:00:50 Mizuho Buy main
[226 rows x 4 columns]
----------cashflow-------------
2019-12-31 2018-12-31 \
Investments -4.017000e+09 -1.972000e+09
Change To Liabilities 4.650000e+08 1.438000e+09
Total Cashflows From Investing Activities -2.949100e+10 -2.850400e+10
Net Borrowings -2.680000e+08 -6.100000e+07
Total Cash From Financing Activities -2.320900e+10 -1.317900e+10
Change To Operating Activities 7.822000e+09 7.890000e+09
Net Income 3.434300e+10 3.073600e+10
Change In Cash 1.797000e+09 5.986000e+09
Repurchase Of Stock -1.839600e+10 -9.075000e+09
Effect Of Exchange Rate -2.300000e+07 -3.020000e+08
Total Cash From Operating Activities 5.452000e+10 4.797100e+10
Depreciation 1.165100e+10 9.029000e+09
Other Cashflows From Investing Activities 5.890000e+08 5.890000e+08
Change To Account Receivables -4.340000e+09 -2.169000e+09
Other Cashflows From Financing Activities -4.545000e+09 -4.043000e+09
Change To Netincome 7.707000e+09 3.298000e+09
Capital Expenditures -2.354800e+10 -2.513900e+10
2017-12-31 2016-12-31
Investments -1.944800e+10 -1.822900e+10
Change To Liabilities 1.121000e+09 3.330000e+08
Total Cashflows From Investing Activities -3.140100e+10 -3.116500e+10
Net Borrowings -8.600000e+07 -1.335000e+09
Total Cash From Financing Activities -8.298000e+09 -8.332000e+09
Change To Operating Activities 3.682000e+09 2.420000e+09
Net Income 1.266200e+10 1.947800e+10
Change In Cash -2.203000e+09 -3.631000e+09
Repurchase Of Stock -4.846000e+09 -3.693000e+09
Effect Of Exchange Rate 4.050000e+08 -1.700000e+08
Total Cash From Operating Activities 3.709100e+10 3.603600e+10
Depreciation 6.899000e+09 6.100000e+09
Other Cashflows From Investing Activities 1.419000e+09 -1.978000e+09
Change To Account Receivables -3.768000e+09 -2.578000e+09
Other Cashflows From Financing Activities -3.366000e+09 -3.304000e+09
Change To Netincome 8.284000e+09 7.158000e+09
Capital Expenditures -1.318400e+10 -1.021200e+10
----------options-------------
('2020-12-01', '2020-12-04', '2020-12-11', '2020-12-18', '2020-12-24', '2020-12-31', '2021-01-08', '2021-01-15', '2021-02-19', '2021-03-19', '2021-06-18', '2021-07-16', '2021-08-20', '2021-09-17', '2021-10-15', '2022-01-21', '2022-06-17', '2023-01-20')
----------balance_sheet-------------
2019-12-31 2018-12-31 2017-12-31 \
Intangible Assets 1.979000e+09 2.220000e+09 2.692000e+09
Total Liab 7.446700e+10 5.516400e+10 4.479300e+10
Total Stockholder Equity 2.014420e+11 1.776280e+11 1.525020e+11
Other Current Liab 2.215900e+10 1.761200e+10 1.065100e+10
Total Assets 2.759090e+11 2.327920e+11 1.972950e+11
Common Stock 5.055200e+10 4.504900e+10 4.024700e+10
Other Current Assets 4.412000e+09 4.236000e+09 2.983000e+09
Retained Earnings 1.521220e+11 1.348850e+11 1.132470e+11
Other Liab 1.447800e+10 1.653200e+10 1.664100e+10
Good Will 2.062400e+10 1.788800e+10 1.674700e+10
Treasury Stock -1.232000e+09 -2.306000e+09 -9.920000e+08
Other Assets 3.063000e+09 3.430000e+09 3.352000e+09
Cash 1.849800e+10 1.670100e+10 1.071500e+10
Total Current Liabilities 4.522100e+10 3.462000e+10 2.418300e+10
Deferred Long Term Asset Charges 7.210000e+08 7.370000e+08 6.800000e+08
Other Stockholder Equity -1.232000e+09 -2.306000e+09 -9.920000e+08
Property Plant Equipment 8.458700e+10 5.971900e+10 4.238300e+10
Total Current Assets 1.525780e+11 1.356760e+11 1.243080e+11
Long Term Investments 1.307800e+10 1.385900e+10 7.813000e+09
Net Tangible Assets 1.788390e+11 1.575200e+11 1.330630e+11
Short Term Investments 1.011770e+11 9.243900e+10 9.115600e+10
Net Receivables 2.749200e+10 2.119300e+10 1.870500e+10
Long Term Debt 3.958000e+09 3.950000e+09 3.943000e+09
Inventory 9.990000e+08 1.107000e+09 7.490000e+08
Accounts Payable 5.561000e+09 4.378000e+09 3.137000e+09
2016-12-31
Intangible Assets 3.307000e+09
Total Liab 2.846100e+10
Total Stockholder Equity 1.390360e+11
Other Current Liab 5.851000e+09
Total Assets 1.674970e+11
Common Stock 3.630700e+10
Other Current Assets 3.175000e+09
Retained Earnings 1.051310e+11
Other Liab 7.770000e+09
Good Will 1.646800e+10
Treasury Stock -2.402000e+09
Other Assets 2.202000e+09
Cash 1.291800e+10
Total Current Liabilities 1.675600e+10
Deferred Long Term Asset Charges 3.830000e+08
Other Stockholder Equity -2.402000e+09
Property Plant Equipment 3.423400e+10
Total Current Assets 1.054080e+11
Long Term Investments 5.878000e+09
Net Tangible Assets 1.192610e+11
Short Term Investments 7.341500e+10
Net Receivables 1.563200e+10
Long Term Debt 3.935000e+09
Inventory 2.680000e+08
Accounts Payable 2.041000e+09
----------quarterly_financials-------------
2020-09-30 2020-06-30 2020-03-31 \
Research Development 6.856e+09 6.875e+09 6.82e+09
Effect Of Accounting Charges None None None
Income Before Tax 1.3359e+10 8.277e+09 7.757e+09
Minority Interest None None None
Net Income 1.1247e+10 6.959e+09 6.836e+09
Selling General Administrative 6.987e+09 6.486e+09 7.38e+09
Gross Profit 2.5056e+10 1.9744e+10 2.2177e+10
Ebit 1.1213e+10 6.383e+09 7.977e+09
Operating Income 1.1213e+10 6.383e+09 7.977e+09
Other Operating Expenses None None None
Interest Expense -4.8e+07 -1.3e+07 -2.1e+07
Extraordinary Items None None None
Non Recurring None None None
Other Items None None None
Income Tax Expense 2.112e+09 1.318e+09 9.21e+08
Total Revenue 4.6173e+10 3.8297e+10 4.1159e+10
Total Operating Expenses 3.496e+10 3.1914e+10 3.3182e+10
Cost Of Revenue 2.1117e+10 1.8553e+10 1.8982e+10
Total Other Income Expense Net 2.146e+09 1.894e+09 -2.2e+08
Discontinued Operations None None None
Net Income From Continuing Ops 1.1247e+10 6.959e+09 6.836e+09
Net Income Applicable To Common Shares 1.1247e+10 6.959e+09 6.836e+09
2019-12-31
Research Development 7.222e+09
Effect Of Accounting Charges None
Income Before Tax 1.0704e+10
Minority Interest None
Net Income 1.0671e+10
Selling General Administrative 8.567e+09
Gross Profit 2.5055e+10
Ebit 9.266e+09
Operating Income 9.266e+09
Other Operating Expenses None
Interest Expense -1.7e+07
Extraordinary Items None
Non Recurring None
Other Items None
Income Tax Expense 3.3e+07
Total Revenue 4.6075e+10
Total Operating Expenses 3.6809e+10
Cost Of Revenue 2.102e+10
Total Other Income Expense Net 1.438e+09
Discontinued Operations None
Net Income From Continuing Ops 1.0671e+10
Net Income Applicable To Common Shares 1.0671e+10
----------isin-------------
US02079K1079
----------earnings-------------
Revenue Earnings
Year
2016 90272000000 19478000000
2017 110855000000 12662000000
2018 136819000000 30736000000
2019 161857000000 34343000000
Release history Release notifications | RSS feed


Download files
Download the file for your platform. If you're not sure which to choose, learn more about installing packages.
Source Distribution
Built Distribution
Filter files by name, interpreter, ABI, and platform.
If you're not sure about the file name format, learn more about wheel file names.
Copy a direct link to the current filters
File details
Details for the file invest-0.1.2.tar.gz.
File metadata
- Download URL: invest-0.1.2.tar.gz
- Upload date:
- Size: 56.3 kB
- Tags: Source
- Uploaded using Trusted Publishing? No
- Uploaded via: twine/5.1.1 CPython/3.10.13
File hashes
| Algorithm | Hash digest | |
|---|---|---|
| SHA256 |
afe8c3b1e63b785871c8a869fe5f1cbfd3d89ddcee821003637cc056f4a08ee7
|
|
| MD5 |
7bfbfa1aafd8e3bfaf6817b4cba84761
|
|
| BLAKE2b-256 |
a041086cc77c4c2752a8faae8fbed83e95db2491a5d767441e6b6c3cbd30b2f3
|
File details
Details for the file invest-0.1.2-py3-none-any.whl.
File metadata
- Download URL: invest-0.1.2-py3-none-any.whl
- Upload date:
- Size: 29.4 kB
- Tags: Python 3
- Uploaded using Trusted Publishing? No
- Uploaded via: twine/5.1.1 CPython/3.10.13
File hashes
| Algorithm | Hash digest | |
|---|---|---|
| SHA256 |
49ac6480e18cb717b35bb3ea34aaf251f0c4ae27d3f4c8aaeb813aadc3fa09eb
|
|
| MD5 |
889936f51ae17d9cbe314c0e6bd54557
|
|
| BLAKE2b-256 |
606da7d3a443b299a80589056e3811d1522faa9888f0b1cfd98b5046bcde478d
|


