Network and Disk I/O Stats Monitor

Project description
iometrics

Monitor and log Network and Disks statistics in MegaBytes per second.
Install
pip install iometrics
Usage
Pytorch-lightning integration
from pytorch_lightning import Trainer
from iometrics.pytorch_lightning.callbacks import NetworkAndDiskStatsMonitor

net_disk_stats = NetworkAndDiskStatsMonitor()

trainer = Trainer(callbacks=[net_disk_stats])
Metrics generated
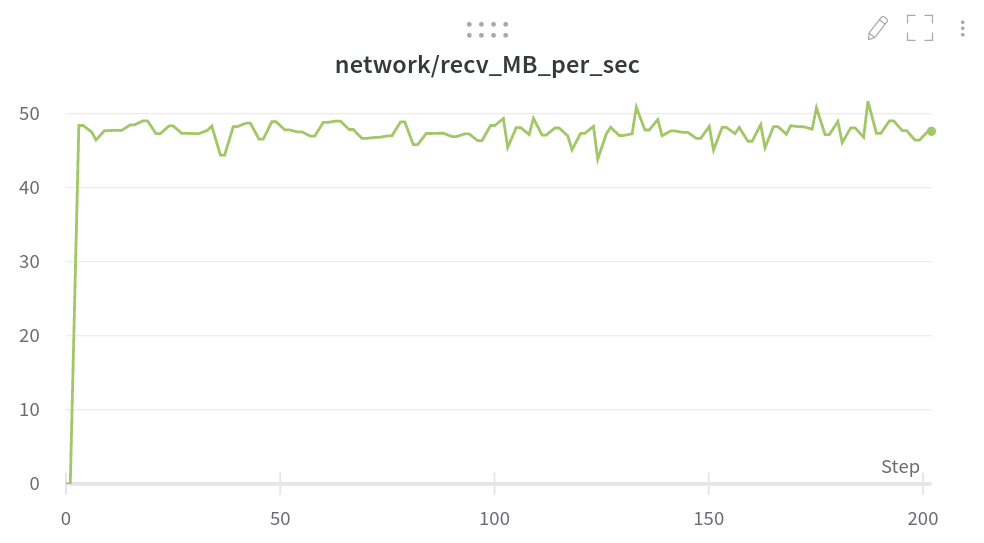
- network/recv_MB_per_sec – Received MB/s on all relevant network interfaces as a SUM.
- network/sent_MB_per_sec – Sent MB/s on all relevant network interfaces as a SUM.
- disk/util% – Disk utilization percentage as the average of all disk devices.
- disk/read_MB_per_sec – Disks read MB/s as the sum of all disk devices.
- disk/writ_MB_per_sec – Disks written MB/s as the sum of all disk devices.
- disk/io_read_count_per_sec – Disks read I/O operations per second as the sum of all disk devices.
- disk/io_writ_count_per_sec – Disks written I/O operations per second as the sum of all disk devices.
Screen shot
Pure-Python implementation (zero dependencies)
Quick check
python -c 'from iometrics.example import usage; usage()'
Example output
|        Network (MBytes/s)       | Disk Util |            Disk MBytes          |           Disk I/O          |
|     Received    |     Sent      |     %     |    MB/s Read    |  MB/s Written |     I/O Read    | I/O Write |
|   val  |   avg  |  val  |  avg  | val | avg |  val   |  avg   |  val  |  avg  |   val  |   avg  | val | avg |
| ------:| ------:| -----:| -----:| ---:| ---:| ------:| ------:| -----:| -----:| ------:| ------:| ---:| ---:|
|    4.6 |    3.5 |   0.1 |   0.1 |  49 |   2 |   52.8 |    1.1 |   0.0 |   0.9 |    211 |      4 |   5 |  18 |
|    4.1 |    3.5 |   0.1 |   0.1 |  61 |   3 |   60.4 |    2.4 |  40.3 |   1.7 |    255 |     10 | 149 |  21 |
Full code
import time
from iometrics import NetworkMetrics, DiskMetrics
from iometrics.example import DUAL_METRICS_HEADER
net  = NetworkMetrics()
disk = DiskMetrics()
for i in range(100):
    time.sleep(1)
    net.update_stats()
    disk.update_stats()
    if i % 15 == 0:
        print(DUAL_METRICS_HEADER)
    row = (
        f"| {net.mb_recv_ps.val:6.1f} | {net.mb_recv_ps.avg:6.1f} "
        f"| {net.mb_sent_ps.val:5.1f} | {net.mb_sent_ps.avg:5.1f} "
        f"| {int(disk.io_util.val):3d} | {int(disk.io_util.avg):3d} "
        f"| {disk.mb_read.val:6.1f} | {disk.mb_read.avg:6.1f} "
        f"| {disk.mb_writ.val:5.1f} | {disk.mb_writ.avg:5.1f} "
        f"| {int(disk.io_read.val):4d} | {int(disk.io_read.avg):4d} "
        f"| {int(disk.io_writ.val):3d} | {int(disk.io_writ.avg):3d} "
        f"|"
    )
    print(row)
Run in a Docker container
Containers don't have access to the host's network statistics, therefore this workaround is needed.
# on the host machine (not inside the container)
iometrics replicate proc &
after you run above script in the host you should mount the /host/proc/net/dev to the container. for example:
docker run -it -v "/tmp/proc_net_dev:/host/proc/net/dev:ro" <YOURIMAGE>
Contributing
See CONTRIBUTING.md


Download files
Download the file for your platform. If you're not sure which to choose, learn more about installing packages.
Source Distribution
Built Distribution
Filter files by name, interpreter, ABI, and platform.
If you're not sure about the file name format, learn more about wheel file names.
Copy a direct link to the current filters
File details
Details for the file iometrics-0.0.8.tar.gz.
File metadata
- Download URL: iometrics-0.0.8.tar.gz
- Upload date:
- Size: 14.5 kB
- Tags: Source
- Uploaded using Trusted Publishing? No
- Uploaded via: poetry/1.1.12 CPython/3.7.12 Linux/5.13.0-27-generic
File hashes
| Algorithm | Hash digest | |
|---|---|---|
| SHA256 |
dc0998cf6173d5ca2355a926a018cc213aa1c548d81929207c7f025a13cd2c98
|
|
| MD5 |
073d4b0154027397d741f24403d93cfd
|
|
| BLAKE2b-256 |
353a381e66b97ec120c89143ed1236499e51fca6d5cda6ae96f42efe73966b04
|
File details
Details for the file iometrics-0.0.8-py3-none-any.whl.
File metadata
- Download URL: iometrics-0.0.8-py3-none-any.whl
- Upload date:
- Size: 16.6 kB
- Tags: Python 3
- Uploaded using Trusted Publishing? No
- Uploaded via: poetry/1.1.12 CPython/3.7.12 Linux/5.13.0-27-generic
File hashes
| Algorithm | Hash digest | |
|---|---|---|
| SHA256 |
eba1f6f23204ea29aff74423c9895dc2fa41752e0cc76afc8eb84e7b3d362655
|
|
| MD5 |
2e64e2020b3c123550232cbfa68dadfa
|
|
| BLAKE2b-256 |
b573277f00b90962df7a480014eebcd2243184c2da42c34b7616126536b76867
|


