
IPMG — IP Management & Ping Monitoring Tool



Find out which hosts on your network are up — and what changed since last time.
IPMG pings hosts in parallel, resolves their names, and hands you a report you can send to someone: Excel, CSV, JSON, or Markdown. It works from the command line or from IPMG Web, a local browser UI, and it remembers every scan so it can tell you what moved.

Why not nmap -sn, fping, or Angry IP Scanner? They tell you what is up
right now. IPMG also remembers every scan and tells you what changed since the
last one: the host that dropped off, the device that appeared, the latency that
doubled. It writes the report you would otherwise build by hand.
How it compares
Website: sameeralam3127.github.io/ipmg · Live demo: IPMG Web with sample data · Command builder: pick what you want, copy the command
pip install ipmg
ipmg --discover        # scan the network you are on, right now
Please read: only scan networks you are authorized to scan. Unauthorized scanning may violate your organization's policies or the law.
Contents
How it compares · Install · Your first scan · Common tasks · Live results · Change detection · IPMG Web · What you can scan · Reports · All options · Security · More help · Contributing
How it compares
| IPMG | nmap -sn |
fping |
Angry IP Scanner | |
|---|---|---|---|---|
| Parallel ping sweep | Yes | Yes | Yes | Yes |
| Scan history and "what changed" | Built in | Save XML, compare with ndiff |
No | No |
| Reports | Excel, CSV, JSON, Markdown | XML, grepable text | Plain text | CSV, TXT, XML |
| Browser UI | IPMG Web, local | No (Zenmap is a desktop app) | No | Desktop app (Java) |
| Port checks | Common TCP ports | Full port and OS scanner | No | Via fetchers |
Reach for nmap when you need a real port or OS scanner. Reach for IPMG when you look after a network and need to know what moved since yesterday, with a report you can hand to someone.
Install
Linux and macOS — one command, works on every distribution:
curl -sSL https://raw.githubusercontent.com/sameeralam3127/ipmg/main/install.sh | bash
It installs uv (which brings its own Python, so your system Python does not matter), then installs IPMG as an isolated tool. Nothing is installed system-wide unless you run it as root.
On a minimal server or container image, add --with-deps and it will install
the handful of system packages it needs (curl, tar, gzip, ping) for you:
curl -sSL https://raw.githubusercontent.com/sameeralam3127/ipmg/main/install.sh | bash -s -- --with-deps
macOS and Linux with Homebrew:
brew install sameeralam3127/tap/ipmg
The formula lives in
sameeralam3127/homebrew-tap
and is updated with every release. Upgrade with brew upgrade ipmg, remove
with brew uninstall ipmg.
Windows — one command in PowerShell:
irm https://raw.githubusercontent.com/sameeralam3127/ipmg/main/install.ps1 | iex
It works in Windows PowerShell 5.1 and PowerShell 7 and needs no
administrator rights: it installs uv if it is missing, installs IPMG, adds it
to your user PATH, and checks that ipmg --version runs. To pin a release:
& ([scriptblock]::Create((irm https://raw.githubusercontent.com/sameeralam3127/ipmg/main/install.ps1))) -Version 2.3.0
Docker (amd64 and arm64):
docker run --rm ghcr.io/sameeralam3127/ipmg --input 10.0.0.0/24
Then check it works, on any platform:
ipmg --version
Running in Docker
The image carries ping, runs as an unprivileged user (uid 10001), and keeps
everything a scan writes (reports and the history database) in /data. Mount
a volume there to keep it between runs:
docker run --rm -v ipmg-data:/data ghcr.io/sameeralam3127/ipmg --input 10.0.0.0/24 --compare
Ping needs no added capability: it uses the unprivileged ICMP sockets that
Docker and containerd enable by default, so it also works with
--cap-drop ALL and under Kubernetes' restricted pod security profile. To
scan your LAN rather than the container's network, add --network host
(Linux).
For IPMG Web, use the compose.yaml
in this repository. Inside a container IPMG Web must listen on 0.0.0.0 or
nothing outside the container could reach it, so the compose file starts it
with web --host 0.0.0.0 and publishes the port on the host's 127.0.0.1
only. Set a fixed IPMG_WEB_TOKEN in .env, then:
docker compose up -d                                      # http://127.0.0.1:8080/#token=<your token>
docker compose run --rm scan --input 10.0.0.0/24          # CLI scans land in the same history
Publishing the port more widely (8080:8080) exposes IPMG Web on your
network over plain HTTP; put a reverse proxy with TLS in front first. Images
are tagged with the release version (2.4.0), the minor line (2.4), and
latest.
Installing with pip
pip install ipmg works inside a virtual environment, and inside one only.
On Ubuntu 23.04+, Debian 12+, Fedora 38+, and recent openSUSE, installing into
the system Python is blocked by the distribution itself:
error: externally-managed-environment
× This environment is externally managed
That is PEP 668, and it is not an IPMG bug — the distro is protecting its own Python. Any of these get you around it:
# 1. uv — no system Python needed at all (what the installer above uses)
uv tool install ipmg

# 2. pipx — the standard way to install Python applications
pipx install ipmg

# 3. a virtual environment you manage yourself
python3 -m venv ~/.venvs/ipmg
~/.venvs/ipmg/bin/pip install ipmg
~/.venvs/ipmg/bin/ipmg --version
Please do not reach for --break-system-packages. It does what it says.
What gets installed
pip install ipmg is the lean core: scanning, every report format
(Excel included), history, change detection, notifications, and exit codes.
It is about 9 MB and 7 packages. IPMG Web, the browser UI with its REST API
and Prometheus /metrics, is the optional web extra, because its server
stack is most of the weight:
pip install "ipmg[web]" # or: uv tool install "ipmg[web]", pipx install "ipmg[web]"
The one-line installers, Homebrew, and the Docker image install it with the
web extra already. Run ipmg web without it and IPMG tells you the command
that adds it.
The one thing IPMG needs from your system
IPMG probes hosts with your operating system's ping command, and minimal
Ubuntu, RHEL, SUSE, and container images ship without it. If a scan reports
The system 'ping' command is not available, install it:
| System | Command |
|---|---|
| Ubuntu, Debian | sudo apt-get install -y iputils-ping |
| RHEL, Rocky, Alma, Fedora | sudo dnf install -y iputils |
| openSUSE, SLES | sudo zypper install -y iputils |
| Arch | sudo pacman -S iputils |
| Alpine | sudo apk add iputils |
| macOS, Windows | already included |
You do not need root, administrator rights, or a raw-socket capability —
IPMG runs the same ping you would run by hand.
Verified environments
Each of these was installed from scratch and run against a live target:
| Environment | Notes |
|---|---|
| Ubuntu 22.04 / 24.04 | 24.04 blocks pip install; the installer is unaffected |
| Debian 12 | same PEP 668 situation as Ubuntu |
| RHEL 8 / RHEL 9 (UBI), Rocky 9 | RHEL 8's system Python is 3.6 — uv supplies its own |
| Fedora 41 | |
| openSUSE Leap 15.6 | image has no Python at all; installer supplies everything |
| Alpine 3.20 | run the installer with bash, not sh |
| macOS | verified on Apple silicon |
Windows is not in that list because it cannot be tested in a container: it is
covered instead by the CI matrix, which runs the full test suite and a live
scan on windows-latest for every change.
Python 3.9 through 3.14 are supported, and CI runs the test suite against every one of them.
Other ways to install
uv (isolated global install):
uv tool install ipmg
Pin a specific version:
curl -sSL https://raw.githubusercontent.com/sameeralam3127/ipmg/main/install.sh | bash -s -- --version 1.13.0
From source (development):
git clone https://github.com/sameeralam3127/ipmg.git
cd ipmg
pip install -e ".[dev]"
Upgrade or remove:
uv tool upgrade ipmg
uv tool uninstall ipmg
Your first scan
The fastest way to see IPMG work is to point it at the network you are already
on. --discover finds your machine's address and scans the /24 around it:
ipmg --discover
Prefer to be specific? Any of these work as a target:
ipmg --input 8.8.8.8                  # one host
ipmg --input 192.168.1.0/24           # a CIDR block
ipmg --input 10.0.0.1-10.0.0.50       # a range
ipmg --input targets.txt              # a file of hosts
Here is what a finished scan looks like:
  ipmg 1.13.0  ·  scan
  ICMP probes only — scan only networks you are authorized to scan.

  Source   targets.txt
  Targets  3 hosts
  Config   50 threads · 2s timeout · 1 ping · reverse DNS

  Results
  ● Active   2  ━━━━━━━━━━━━━━━───────  66.7%
  ● Timeout  1  ━━━━━━━───────────────  33.3%

  3 hosts · 66.7% active · 5.8 ms avg · 3.08s · 2026-07-26 23:13:25

  Saved    results_20260726_231328.csv
Reading it top to bottom: where the targets came from, how the scan was configured, how the hosts answered, a one-line scorecard, and the report file IPMG wrote for you.
Running plain ipmg with no arguments uses ip_list.xlsx as its input, and
creates it with two sample targets (8.8.8.8 and 1.1.1.1) if it does not
exist yet. A file you name with --input must already exist.
Common tasks
Not sure which flags you need? The command builder on the website puts the command together as you pick what you want to know, and explains every flag it adds.
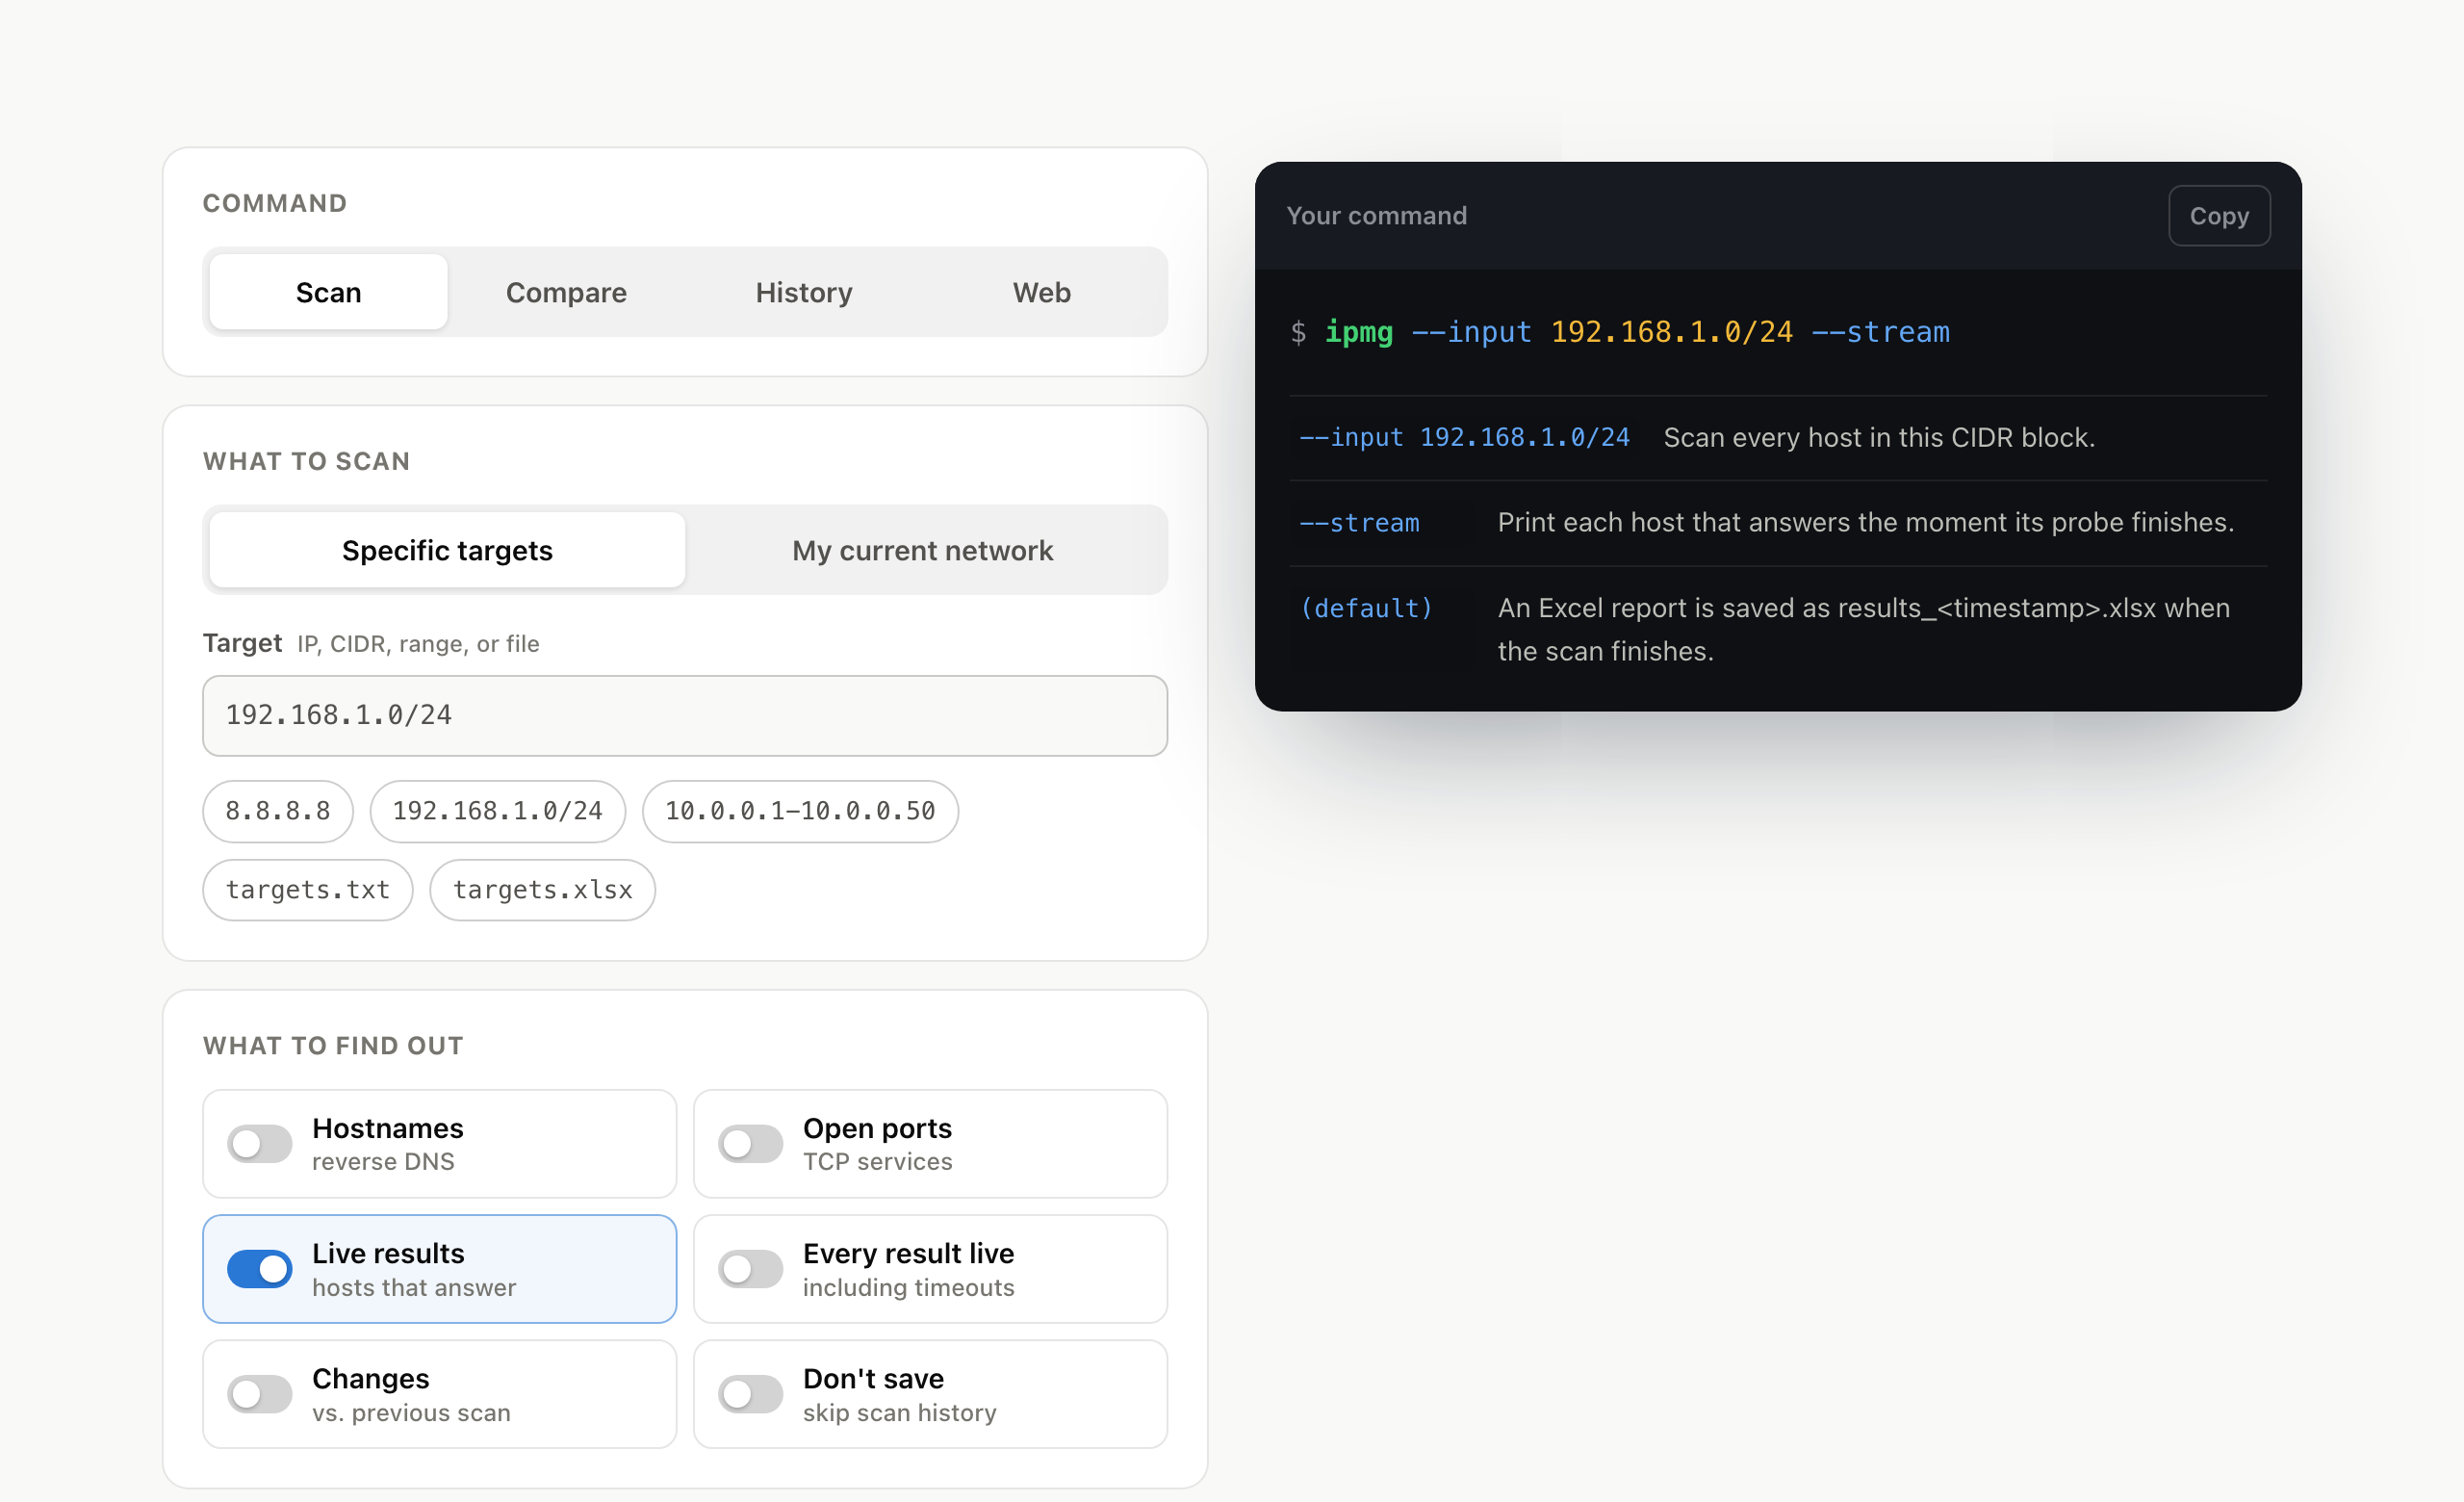
Or pick a ready-made command:
| I want to… | Command |
|---|---|
| Scan the network I am on | ipmg --discover |
| Scan hosts listed in a file | ipmg --input targets.txt |
| Scan a file plus a few extra hosts | ipmg --input targets.txt 10.0.0.0/30 10.0.0.5 |
| Get names, not just IP addresses | ipmg --input targets.txt --resolve |
| Get a report I can send to someone | ipmg --input targets.txt --formats md csv |
| Pipe the results into a script | ipmg --input targets.txt --json | jq . |
| See hosts appear as they answer | ipmg --input 192.168.1.0/24 --stream |
| See what changed since last time | ipmg --input targets.txt --compare |
| Check which services are listening | ipmg --input targets.txt --scan-ports |
| Keep scanning every 5 minutes | ipmg --input targets.txt --interval 5 |
| Look back at earlier scans | ipmg history |
| Compare two specific scans | ipmg diff 12 14 |
| Use IPMG Web in your browser instead | ipmg web |
| See every available flag | ipmg --help |
Live results
By default a scan prints its results once every host has been probed. On a
large range that is a long wait with nothing to look at, so --stream prints
each host the moment its probe finishes, above a progress bar that also carries
a running count of the hosts that answered:
ipmg --input 192.168.1.0/24 --stream
  Live
  Status        Host                Latency
  ● Active      192.168.1.1          0.9 ms
  ● Active      192.168.1.24         3.1 ms
   ⠹ Scanning ━━━━━━━━━━━───────────  48% 122/254 0:00:09 2 up
--stream shows only the hosts that answer, which is what makes a sparse range
readable. Add --stream-all to see every result, including timeouts and
unreachable hosts. The rows gain a Name column under --resolve and an
Open ports column under --scan-ports.
Streaming costs nothing in scan time: rows are printed by the thread that
collects results, so the workers never wait on the terminal. When output is
piped or redirected the progress bar is dropped and the rows are written as
plain lines, which makes ipmg --stream-all >> scan.log a usable live log.
Change detection
Every scan is stored in a local SQLite history (~/.ipmg/dashboard.db), shared
by the CLI and IPMG Web. IPMG can then tell you what moved between any two
scans — which is usually the question you actually have.
ipmg --input targets.txt --compare    # compare with the previous scan
ipmg diff                             # compare the two latest scans
ipmg diff 14                          # compare scan 14 with the one before it
ipmg diff 12 14                       # compare two specific scans
ipmg diff --diff-formats md json      # export the change summary
ipmg diff --fail-on-change            # exit 2 when anything changed (CI)
ipmg history --limit 10               # list stored scans
To hear about changes without watching the terminal, send them to Slack,
Microsoft Teams, any JSON webhook, or email. Any --notify-* flag turns on
--compare, and with --interval every pass that changes something alerts:
ipmg --input targets.txt --interval 15 --notify-slack        # URL from $IPMG_NOTIFY_SLACK
ipmg --input targets.txt --notify-email ops@example.com --smtp-host smtp.example.com
ipmg diff --notify-webhook https://ops.example.com/ipmg --notify-severity critical
Only changes at or above --notify-severity (default warning) trigger a
notification. A notification that fails is reported but never fails the scan.
Secrets such as webhook URLs and IPMG_SMTP_PASSWORD can come from environment
variables; see Notifications for all of them.
What counts as a change:
| Change | Severity | Meaning |
|---|---|---|
| Host offline | critical | Reachable in the baseline, not reachable now |
| New host | warning | An IP that the baseline never saw |
| Host removed | warning | An IP the current scan no longer covers |
| IP address changed | warning | A known hostname moved to a different IP |
| Service changed | warning | Status moved between failure modes (e.g. Timeout → Unreachable) |
| Host back online | info | Recovered since the baseline |
| Hostname changed | info | Same IP, different PTR record |
| Latency changed | info | Latency moved past both thresholds |
A latency change is only reported when it clears both --latency-threshold
(default 5 ms) and --latency-pct (default 25%), which keeps normal jitter out
of the report.
By default a scan is compared against the previous scan of the same target
source, so file-based and --discover runs do not get mixed up. Pass
--compare-any-source if you want the previous scan whatever its source.
| Flag | Default | Description |
|---|---|---|
--compare |
off | Print a change report after the scan |
--compare-any-source |
off | Allow a baseline from a different target source |
--no-history |
off | Do not store the scan |
--db |
~/.ipmg/dashboard.db |
History database location |
--diff-formats |
none | Export the change summary as md, json, csv |
--diff-output |
changes |
Base filename for exported change summaries |
--latency-threshold |
5 |
Minimum latency delta in ms |
--latency-pct |
25 |
Minimum relative latency change |
--fail-on-change |
off | ipmg diff exits 2 when changes are found |
--notify-webhook |
off | POST the change report as JSON to a URL |
--notify-slack |
off | Post changes to a Slack incoming webhook |
--notify-teams |
off | Post changes to a Microsoft Teams Workflows webhook |
--notify-email |
off | Email the Markdown change report (with --smtp-host, --smtp-port, --smtp-security, --smtp-user, --smtp-from) |
--notify-severity |
warning |
Only notify for changes at least this severe |
IPMG Web
Prefer clicking to typing? IPMG Web runs locally and shares the CLI's scanning engine:
ipmg web # starts http://127.0.0.1:8080 and opens your browser
ipmg --web does the same thing, so whichever one you reach for first works.
Each start creates a new access token. The browser opens with it already in
the link, and IPMG Web prints that link (http://127.0.0.1:8080/#token=…)
in the terminal. If you open IPMG Web in another browser, or after a
restart, use the link from the terminal. To keep the same token across
restarts, for example behind a reverse proxy, set IPMG_WEB_TOKEN.
It runs fully offline — every stylesheet and script is bundled with the package, nothing is loaded from a CDN. It gives you:
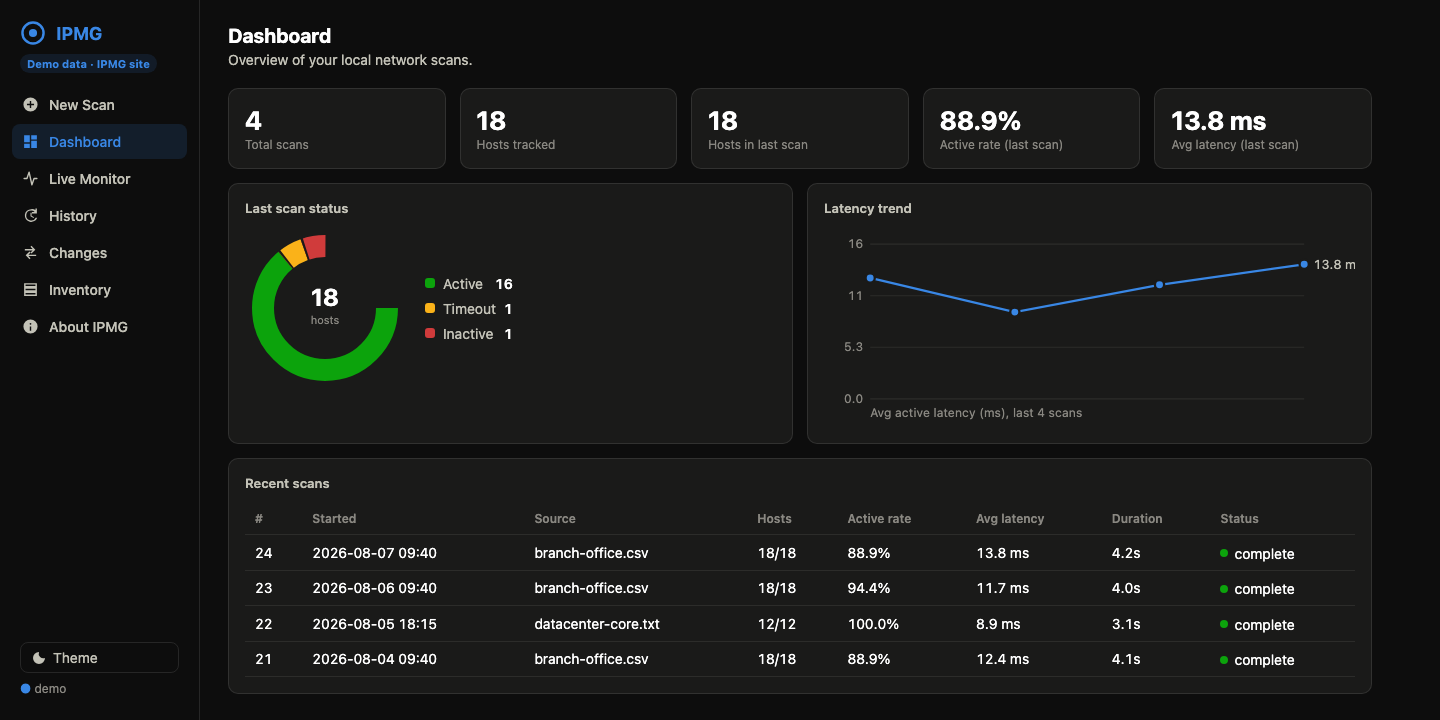
- Dashboard — status donut, latency trend, and recent scan overview
- New Scan — upload Excel/CSV/text/JSON target files or type IPs, CIDR blocks, and ranges; configure threads, timeout, and DNS options
- Live Monitor — real-time progress and results over WebSockets
- History — every scan stored locally in SQLite (
~/.ipmg/dashboard.db), searchable and downloadable as XLSX/CSV/JSON/Markdown - Changes — pick any two scans and see new/offline hosts, IP and hostname moves, and latency shifts; export the summary as Markdown/JSON/CSV
- Inventory — every host seen across scans, with last status and export
| Flag | Default | Description |
|---|---|---|
--port |
8080 |
Port to listen on |
--host |
127.0.0.1 |
Bind address (local-only by default) |
--no-browser |
off | Don't open the browser automatically |
--db |
~/.ipmg/dashboard.db |
History database location |
Scripting IPMG Web
Everything the dashboard does goes through a documented, versioned REST API
under /api/v1, so you can start scans, fetch results, and compare scans from
your own scripts. The API guide
covers authentication, errors, and worked curl examples; the running server
also serves interactive docs at http://127.0.0.1:8080/docs.
Prometheus metrics
ipmg web --metrics serves /metrics in the Prometheus text format, so the
results of every scan, whether run from cron with the CLI or from the browser,
land in the dashboards and alerts you already have. It reports the latest
completed scan of each source, and it is off unless you pass the flag:
IPMG_WEB_TOKEN=$(cat /etc/ipmg/token) ipmg web --metrics --no-browser
# prometheus.yml: the token is the same one the web UI uses
scrape_configs:
  - job_name: ipmg
    authorization:
      credentials_file: /etc/prometheus/ipmg-token
    static_configs:
      - targets: ["127.0.0.1:8080"]

# an alert rule: a host that stopped answering
groups:
  - name: ipmg
    rules:
      - alert: HostDown
        expr: ipmg_host_up == 0
        for: 10m
        annotations:
          summary: "{{ $labels.ip }} ({{ $labels.source }}) is not answering ping"
| Metric | Labels | Meaning |
|---|---|---|
ipmg_host_up |
source, ip |
1 if the host answered, else 0 |
ipmg_host_latency_seconds |
source, ip |
Round-trip time, for hosts that answered |
ipmg_host_open_ports |
source, ip |
Open TCP ports, for scans run with --scan-ports |
ipmg_host_info |
source, ip, hostname |
Always 1; carries the reverse DNS name |
ipmg_scan_hosts |
source, status |
Hosts in the latest scan, by status |
ipmg_scan_duration_seconds |
source |
How long the latest scan took |
ipmg_scan_timestamp_seconds |
source |
When the latest scan finished; alert on time() - this to catch a stalled cron job |
ipmg_scans_total |
source |
Completed scans stored for the source |
ipmg_metrics_sources_omitted |
Sources left out by --metrics-sources |
|
ipmg_build_info |
version |
Always 1 |
Cardinality is bounded. Host series carry only source and ip, never
the hostname or status, which change, so a rename does not start a new series.
Only the --metrics-sources most recently scanned sources are exported
(default 20), and a scan holds at most 65,536 hosts, so the page stays at
about sources × hosts × 4 series at most. Give recurring scans a stable
input (the same file) so each one updates its source rather than adding one.
On a server with no browser
On a Linux server with no display (e.g. accessed over plain SSH), IPMG detects
that no browser can be opened, skips the attempt, and prints a hint instead of
failing silently. IPMG Web still binds to 127.0.0.1 by default, so reach
it from your workstation with an SSH tunnel:
ssh -L 8080:127.0.0.1:8080 user@server
# then open the link the server printed (http://127.0.0.1:8080/#token=…) locally
Alternatively, bind to all interfaces with --host 0.0.0.0. Every request
still needs the access token. The traffic, token included, is plain HTTP,
so on anything but a trusted network put a reverse proxy with TLS in front
of it (see Security).
What you can scan
Anywhere IPMG takes --input, you can give it any of these:
-
A single IP —
8.8.8.8, or IPv6 such as2001:db8::1or a link-localfe80::1%eth0 -
A CIDR block —
10.0.0.0/24, or an IPv6 prefix up to 65,536 hosts (2001:db8::/112) -
A range —
10.0.0.1-10.0.0.200or2001:db8::10-2001:db8::20 -
A text file — one IP or CIDR per line. Blank lines and
#comments are ignored, so you can annotate it:# Production DNS 8.8.8.8 192.168.1.0/30
-
An Excel or CSV file (
.xlsx,.csv) — must contain a column namedIP Address. Cells can hold single addresses or CIDR blocks:IP Address 192.168.1.1 10.0.1.0/30 -
A JSON file (
.json) — a list of addresses, a list of objects keyed byIP Address,ip, ortarget, or an object with atargetsoripsarray:["192.168.1.1", "10.0.1.0/30"]
Because
IP Addressis one of the keys it accepts, a report IPMG wrote with--formats jsoncan be fed straight back in:ipmg --input results_20260628_120000.json
--input takes as many of these as you like, in any mix, and may also be
repeated:
ipmg --input targets.txt 10.0.0.0/30 10.0.0.5
ipmg --input targets.txt --input 10.0.0.5     # the same thing
IPv4 and IPv6 targets mix freely in one scan, and reports, history, and change
detection handle both. An IPv6 /64 holds 2^64 addresses, far too many to
sweep one by one, so it is rejected with a pointer to --discover ipv6, which
finds the hosts on your local links through neighbour discovery instead:
ipmg --discover ipv6      # IPv6 neighbours on the local links
ipmg --discover all       # the IPv4 /24 and the IPv6 neighbours together
Duplicate targets are removed automatically — across sources too, so a host that is both in the file and on the command line is scanned once — and one scan expands to at most 65,536 hosts in total. Larger CIDR blocks, ranges, or combinations are rejected up front, before the scan starts.
Reports
Every scan writes a report file named after the time it ran, e.g.
results_20260628_120000.xlsx. Choose the format with --formats (you can ask
for several at once) and the name prefix with --output:
ipmg --input targets.txt --formats md csv --output monday-audit
Each file has one row per host:
| IP Address | Status | Latency | Hostname | Open Ports | Batch Timestamp | Scan Duration (s) |
|---|---|---|---|---|---|---|
| 8.8.8.8 | Active | 12.5 | dns.google | 443 | 2026-04-09 11:42:13 | 6.24 |
Status is one of Active, Inactive, Timeout, Unreachable, Invalid IP,
or Error. Hostname is filled in when you pass --resolve.
The md format produces a shareable Markdown report with a status summary
table — handy for tickets, handoffs, and incident timelines. jsonl writes one
JSON object per line, which streams into jq and log pipelines.
Reports survive an interrupted scan. A scan writes its report as it goes,
so pressing Ctrl+C halfway through a /16 leaves a valid report of everything
scanned so far instead of nothing at all. csv and jsonl are appended per
host; xlsx, json, and md are re-saved every --autosave seconds (30 by
default). A finished scan overwrites those files with the complete report, so
the file names and contents are the same as they always were. Use
--no-incremental to go back to writing only at the end.
Pick up where an interrupted scan stopped. --resume reads the hosts the
partial report already holds, scans only the rest, and finishes that same
report — same file names, same batch timestamp:
ipmg --input 10.0.0.0/16 --formats jsonl xlsx     # Ctrl+C partway through
ipmg --input 10.0.0.0/16 --formats jsonl xlsx --resume
ipmg --input 10.0.0.0/16 --resume results_20260917_120000.csv
Without a path, --resume takes the newest report named after --output,
preferring jsonl or csv (current to the last host) over json or xlsx
(current to the last autosave). Hosts dropped from the target list since are
left out of the finished report.
Piping results into a script. --json prints the finished scan to stdout as
a JSON array, and --jsonl prints one object per host the moment its probe
finishes. The human output moves to stderr, so stdout is nothing but data and no
temp file or glob is needed:
ipmg --input 10.0.0.0/24 --json | jq '.[] | select(.Status == "Active")'
ipmg --input 10.0.0.0/24 --jsonl | while read -r host; do notify "$host"; done
ipmg --input 10.0.0.0/24 --json 2>/dev/null > hosts.json   # data only
The field names are the report columns above, and both flags print a host
identically — --json is what --jsonl prints, gathered into an array. Unless
you ask for --formats explicitly, a piped scan writes no report file at all.
Exit codes are unchanged.
Open ports. Open Ports is only populated when --scan-ports is set: for
each host that answers, IPMG probes a list of common TCP ports (SSH, HTTP,
HTTPS, RDP, SMB, FTP, SMTP, DNS, MSSQL, MySQL, PostgreSQL by default)
concurrently and records which ones accepted a connection.
ipmg --input targets.txt --scan-ports
ipmg --input targets.txt --scan-ports --ports 22,80,443 --port-timeout 0.5
In the terminal, colors follow NO_COLOR, the progress bar is hidden when
output is piped, and symbols fall back to ASCII on terminals that cannot render
them — so piping IPMG into a file or a log gives you clean text.
Default options in a file
If every run repeats the same flags, put them in ipmg.toml next to your
work instead:
threads = 200
timeout = 1
resolve = true
formats = ["md", "csv"]

[profile.datacenter]
threads = 400
scan-ports = true
ports = "22,80,443"
ipmg --input targets.txt                        # uses the file's defaults
ipmg --input targets.txt --profile datacenter   # and the profile on top
ipmg --input targets.txt --threads 20           # a flag always wins
Any long flag can be a key, written as the flag is (scan-ports) or with
underscores (scan_ports). A switch takes true to mean "as if the flag were
passed" — no-history = true is --no-history. Files are read from
~/.config/ipmg/config.toml first (or $XDG_CONFIG_HOME), then ./ipmg.toml
on top, so a project can override your global defaults:
| Flag | What it does |
|---|---|
--config PATH |
Read that file instead of searching |
--no-config |
Ignore every file and use the built-in defaults |
--profile NAME |
Apply the [profile.NAME] section as well |
The command line always wins. A flag that appears on it ignores the file
entirely for that flag — including --input, which merges several sources on
one command line but replaces the file's list rather than adding to it.
A key that is not a flag, a value of the wrong type, or a value outside a flag's choices is an error naming the key and the file it came from:
✗ Unknown option 'thredas' in ipmg.toml. Did you mean 'threads'?
✗ 'formats' in ipmg.toml: 'pdf' is not one of xlsx, csv, json, jsonl, md.
A project's ./ipmg.toml comes with whatever directory you scan from,
including a repository you just cloned, so it cannot say where results are
sent: the --notify-* destinations and --smtp-* settings are only read from
~/.config/ipmg/config.toml or a file you pass with --config. A file also
cannot combine flags that exclude each other, such as json and jsonl.
All options
ipmg --help always lists the current set. Grouped for reading:
Targets and reports
| Flag | Default | Description |
|---|---|---|
--input |
ip_list.xlsx |
What to scan: one or more files (.xlsx, .xls, .csv, .json, .txt, .list), IPs, CIDR blocks, or ranges (10.0.0.1-10.0.0.50), merged and de-duplicated |
--discover [FAMILY] |
off | Scan this machine's networks instead: ipv4 (the default) sweeps the local /24, ipv6 finds link neighbours, all does both |
--output |
results |
Report file name prefix |
--formats |
xlsx |
One or more of xlsx, csv, json, jsonl, md (no file at all with --json/--jsonl) |
--json |
off | Print the finished scan to stdout as a JSON array, human output on stderr |
--jsonl |
off | Stream one JSON object per host to stdout as each probe finishes |
--no-incremental |
off | Only write the report once the scan has finished |
--autosave |
30 |
How often a running scan re-saves xlsx, json, and md |
--resume |
off | Finish an interrupted scan from its partial report (newest one, or the path given) |
Speed and accuracy
| Flag | Default | Description |
|---|---|---|
--threads |
50 |
How many hosts to probe at once |
--timeout |
2 |
Seconds to wait for a reply |
--count |
1 |
Pings per host (raise it on a lossy link) |
--interval |
off | Repeat the whole scan every N minutes |
Names and services
| Flag | Default | Description |
|---|---|---|
--resolve |
off | Reverse DNS (PTR) lookup for each host |
--dns-cache-ttl |
300 |
Cache DNS results for this many seconds (0 disables caching) |
--scan-ports |
off | Probe common TCP ports on hosts that answer |
--ports |
21,22,25,53,80,443,445,1433,3306,3389,5432 |
Which TCP ports to probe when --scan-ports is set |
--port-timeout |
1 |
Connect timeout per port in seconds |
Live output
| Flag | Default | Description |
|---|---|---|
--stream |
off | Print each host that answers as soon as its probe finishes |
--stream-all |
off | Stream every result, including hosts that did not answer (implies --stream) |
--stream-refresh |
0.25 |
Seconds between progress-bar redraws while streaming (0.05-5) |
--verbose |
off | Debug logging |
--config |
search | Read defaults from this file instead of searching for ipmg.toml |
--no-config |
off | Ignore every configuration file |
--profile |
none | Apply a [profile.NAME] section from the configuration file |
Exit status
| Flag | Default | Description |
|---|---|---|
--fail-on-down |
off | Exit 3 if any target is not Active (reports are still written) |
--min-active |
off | Exit 3 if fewer than this percentage of targets are Active |
History and changes — see Change detection for
--compare, --no-history, --db, --diff-formats, --diff-output,
--latency-threshold, --latency-pct, --fail-on-change, and the
--notify-* flags.
Exit codes: 0 success, 1 error, 2 changes detected
(ipmg diff --fail-on-change), 3 hosts down (--fail-on-down,
--min-active), 130 interrupted.
Security
IPMG is built for scanning networks you are authorized to scan, and the tool itself is hardened accordingly:
- Pings run as a direct process call (no shell), and every target is validated as an IP address first
- IPMG Web binds to
127.0.0.1by default and serves everything locally — no CDN assets, no outbound requests - Every API request and WebSocket needs the access token created when IPMG Web starts, so other users on the machine and web pages you happen to visit cannot start scans or read your results
- WebSocket connections are also origin-checked, and a client that stops reading live updates is disconnected rather than buffered without limit
- Uploads are capped at 5 MB and one scan expands to at most 65,536 hosts, so a bad input file cannot exhaust memory
- All database access uses parameterized SQL
- The only outbound requests IPMG makes are the notifications you ask for
with a
--notify-*flag. Their URLs and the SMTP password can come from environment variables, and error messages never repeat them
If you bind to a non-local address with --host, the token still guards the
API. It travels over plain HTTP, though, so use an SSH tunnel or a reverse
proxy with TLS on any network you don't trust.
Found a vulnerability? See SECURITY.md for how to report it.
More help
- Command reference — every command and flag with copy-paste examples, a safe session that tries everything on your own machine, exit codes, and error messages
- Web API guide — script IPMG Web over HTTP: start scans, fetch results, compare scans, and follow live events
- Troubleshooting —
install errors,
command not found, every host timing out, slow scans, rejected input files - FAQ — root rights, Python versions, where history lives, running on a schedule
- Issues — report a bug or request a feature
Contributing
Contributions are welcome. CONTRIBUTING.md covers setting up a development environment, running the tests, the commit message format that drives automated releases, and how the project website and IPMG Web demo are built. Everyone taking part is expected to follow the Code of Conduct.
License
MIT — free for commercial and personal use.
1 maintainer

Metadata
1 maintainer
Release files for ipmg 3.1.0
For a detailed explanation of source distributions (sdists) and built distributions (wheels), please see the package formats documentation.
Source distribution (sdist)
| File | Size | Uploaded | |
|---|---|---|---|
| ipmg-3.1.0.tar.gz | 182.7 kB | Details |
Built distribution (wheel)
| File | Interpreter | ABI | Platform | Reset |
|---|---|---|---|---|
| ipmg-3.1.0-py3-none-any.whl | Python 3 | none | any | Details |
Total release size: 310.3 kB
Release files / ipmg-3.1.0.tar.gz
| Download URL | ipmg-3.1.0.tar.gz |
|---|---|
| Size | 182.7 kB |
| Tags | Source |
|
SHA-256 checksum How to use checksums |
8d50fa75eeb28448369e19a437750bc007d929db7506edd42cb20f8b3837b05a
|
|
BLAKE2b-256 checksum How to use checksums |
9d4fb75d536267446f752cb04dfce9e4322aacce4be64dce234e38df590e20d7
|
| Upload date | |
|
Uploaded using Trusted Publishing? What is trusted publishing? |
Yes |
| Uploaded via |
twine/7.0.0 CPython/3.13.14
|
Provenance
Provenance describes where a file came from. On PyPI, provenance is shared via attestations, which provide a verifiable record of the build or publishing details. View details, limitations and caveats.


PyPI Publish Attestation
PyPI verified that this artifact, at this checksum, originated from the publisher listed below.
Signed by GitHub Actions, verified by PyPI on Sep 27, 2026.
Transparency logRelease files / ipmg-3.1.0-py3-none-any.whl
| Download URL | ipmg-3.1.0-py3-none-any.whl |
|---|---|
| Size | 127.6 kB |
| Tags | Python 3 |
|
SHA-256 checksum How to use checksums |
3252e649aec465838211ff444704cb42abd59cbc1f0f9e2bbdee7a4486fb7d1d
|
|
BLAKE2b-256 checksum How to use checksums |
2101e4872629b965b53b80f1d5e5a99c18ee9d84d53d1d20c6e924476cbd5677
|
| Upload date | |
|
Uploaded using Trusted Publishing? What is trusted publishing? |
Yes |
| Uploaded via |
twine/7.0.0 CPython/3.13.14
|
Provenance
Provenance describes where a file came from. On PyPI, provenance is shared via attestations, which provide a verifiable record of the build or publishing details. View details, limitations and caveats.
PyPI Publish Attestation
PyPI verified that this artifact, at this checksum, originated from the publisher listed below.
Signed by GitHub Actions, verified by PyPI on Sep 27, 2026.
Transparency log













