
Plotting data in the terminal.
Project homepage: https://github.com/eerimoq/irwin
Installation
$ pip install irwinExamples
Command line
The plot subcommand
Read all data from given file and plot it. Data points are separated by any whitespace character.
$ echo "0,2 1,1 2,0 3,-1 4,1 5,3 6,5 7,7" > data.txt
$ irwin plot data.txt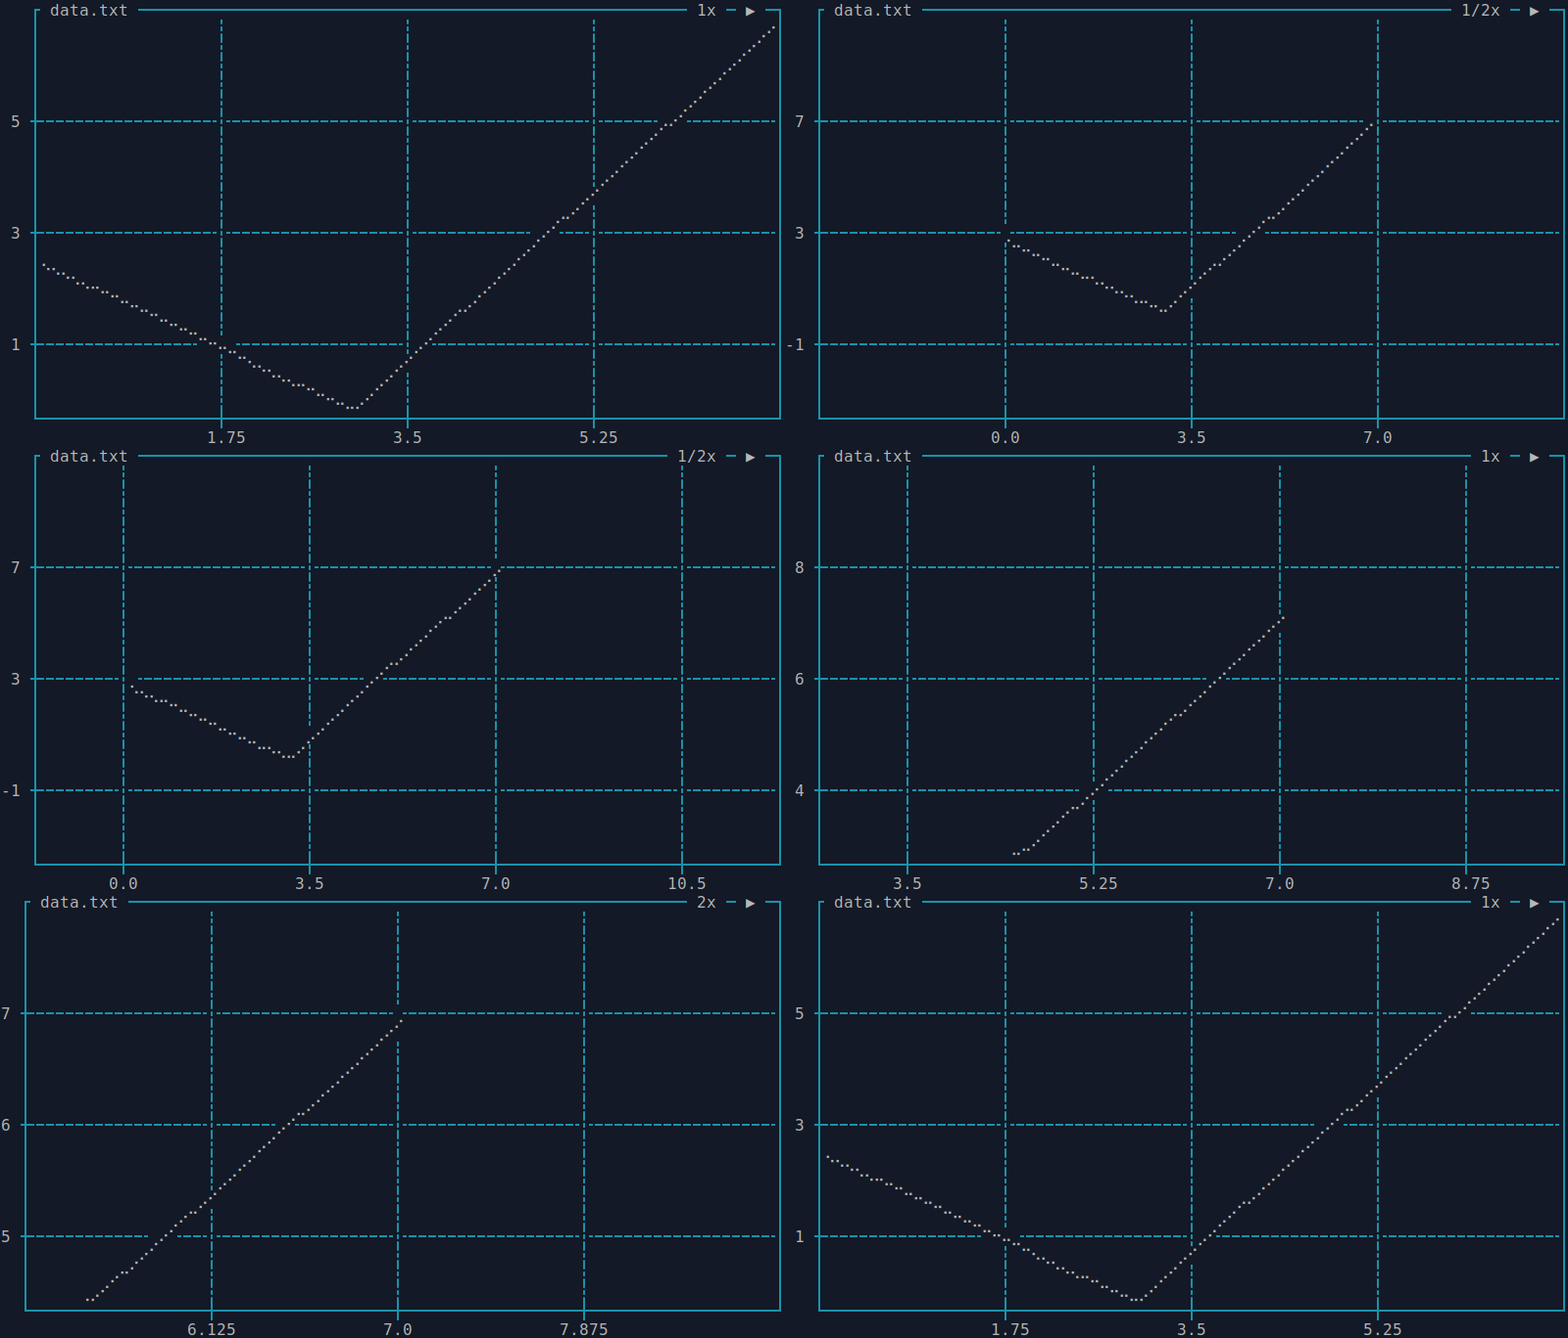
Give -t scatter to create a scatter plot.
$ python3 -c "import math, random, numpy ; \
      x = numpy.linspace(0, 3 * math.pi, 200) ; \
      y = [v + random.random() / 4 for v in numpy.cos(x)] ; \
      print(' '.join([f'{x},{y}' for x, y in zip(x, y)]))" > data.txt
$ irwin plot -t scatter data.txt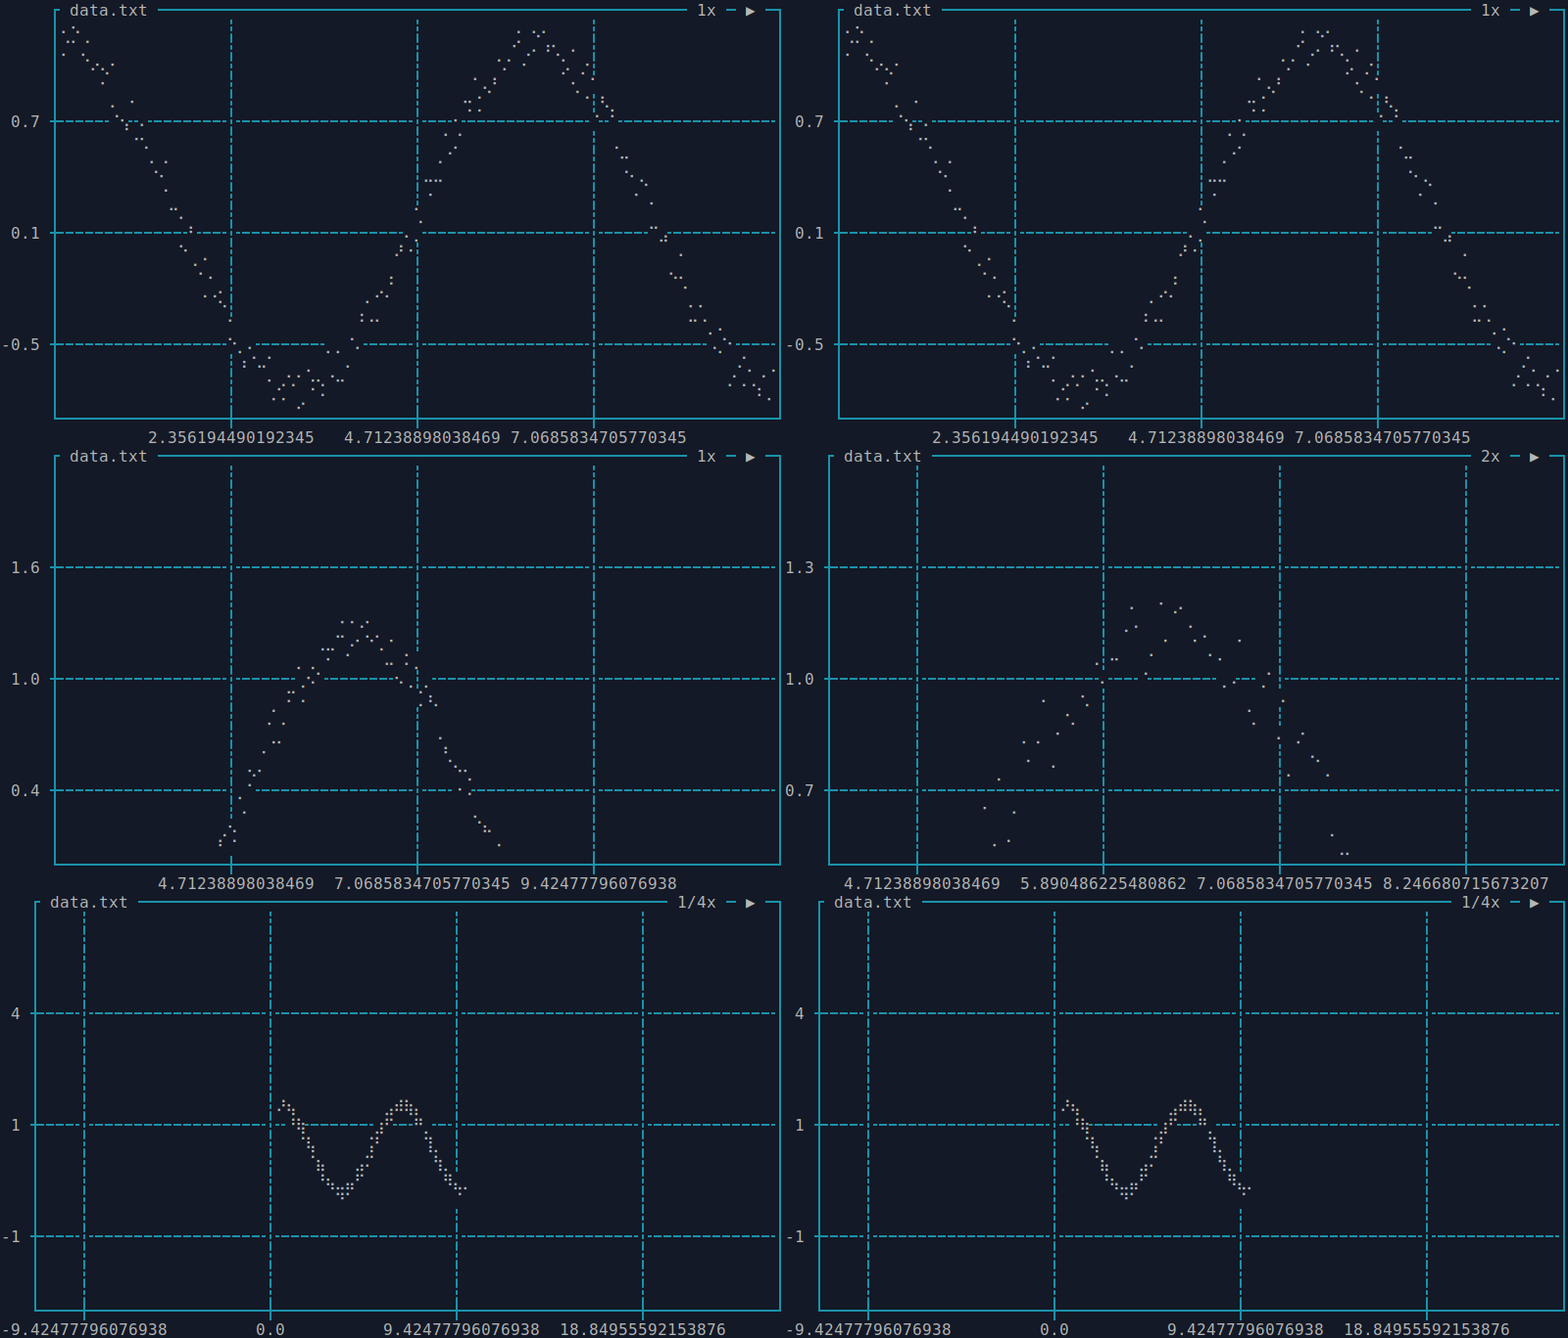
Add more samples by running python3 -c "import random ; print(f'{random.random()},{random.random()}') periodically.
$ irwin plot -t scatter \
      -c "python3 -c \"import random ; print(f'{random.random()},{random.random()}')\"" \
      data.txt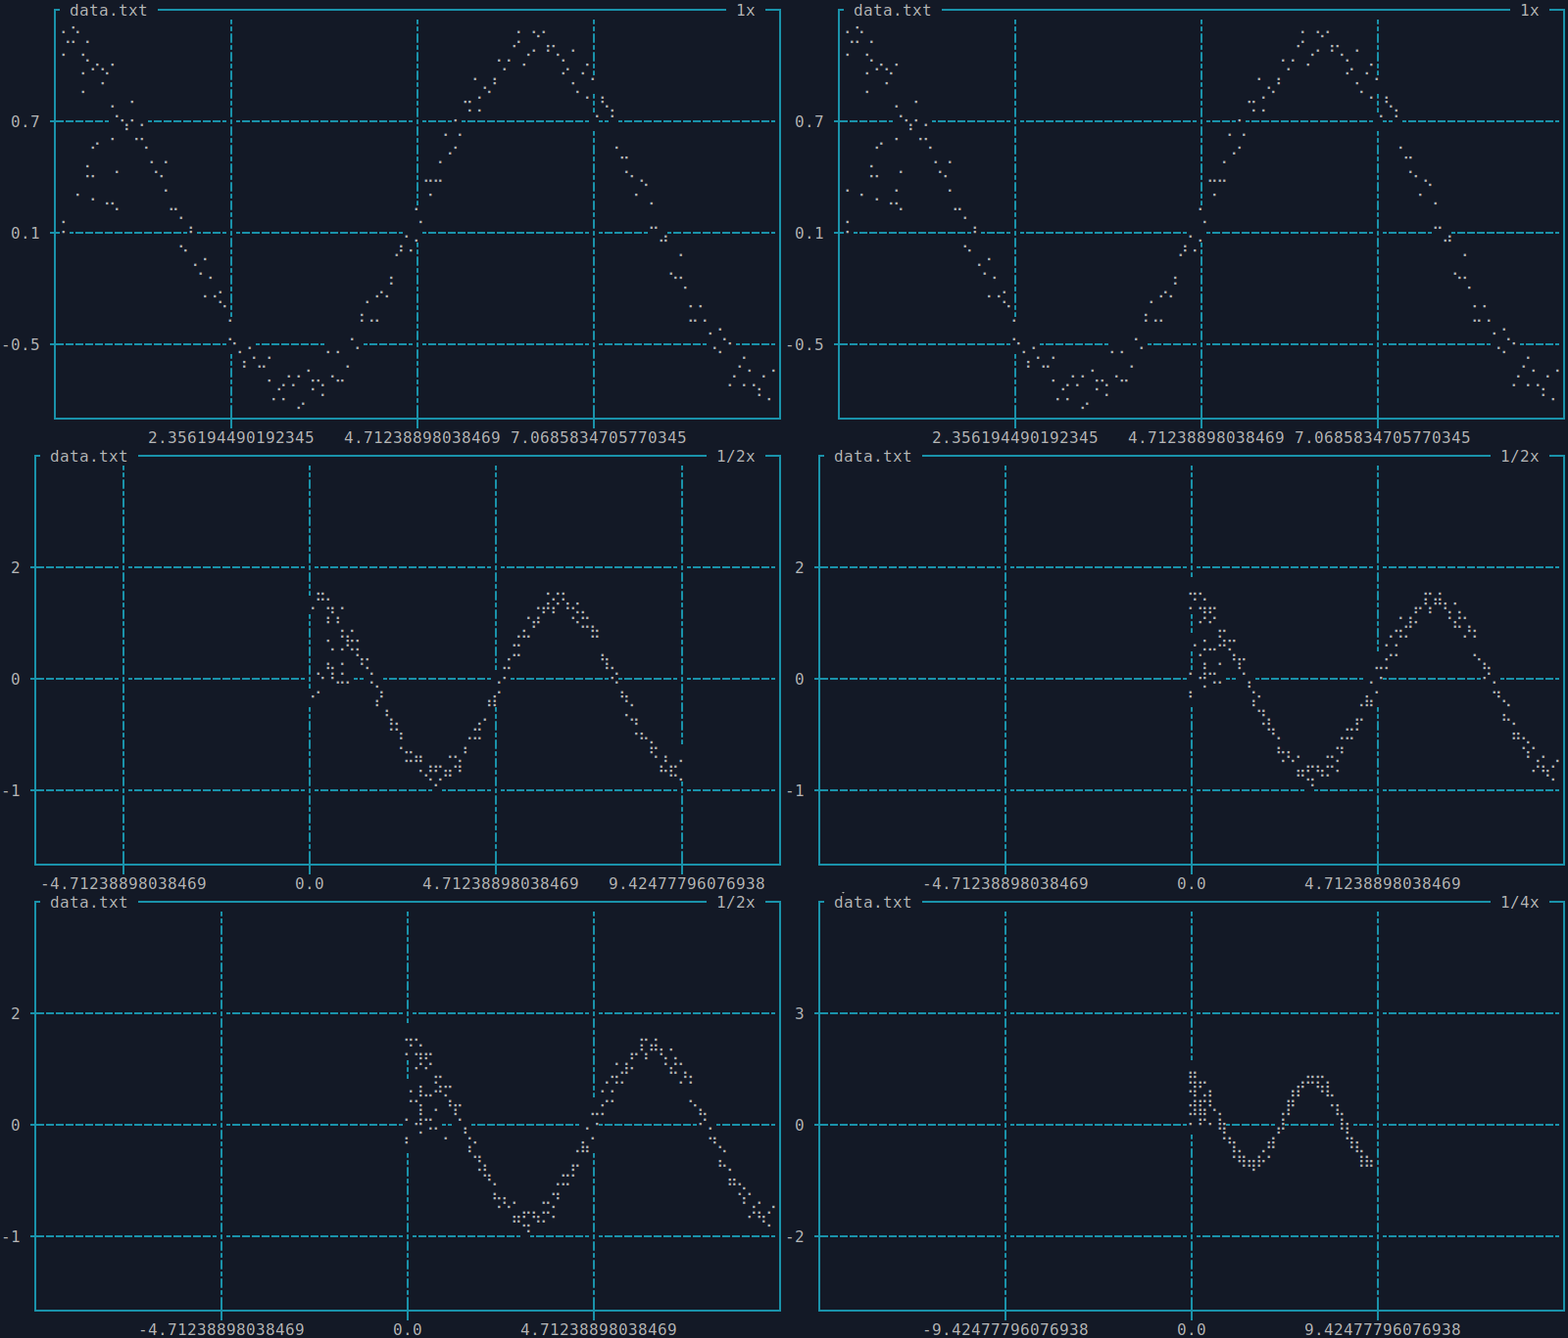
The watch subcommand
Run cat /proc/uptime | awk '{ print \$1 }' periodically any plot its output.
$ irwin watch "cat /proc/uptime | awk '{ print \$1 }'"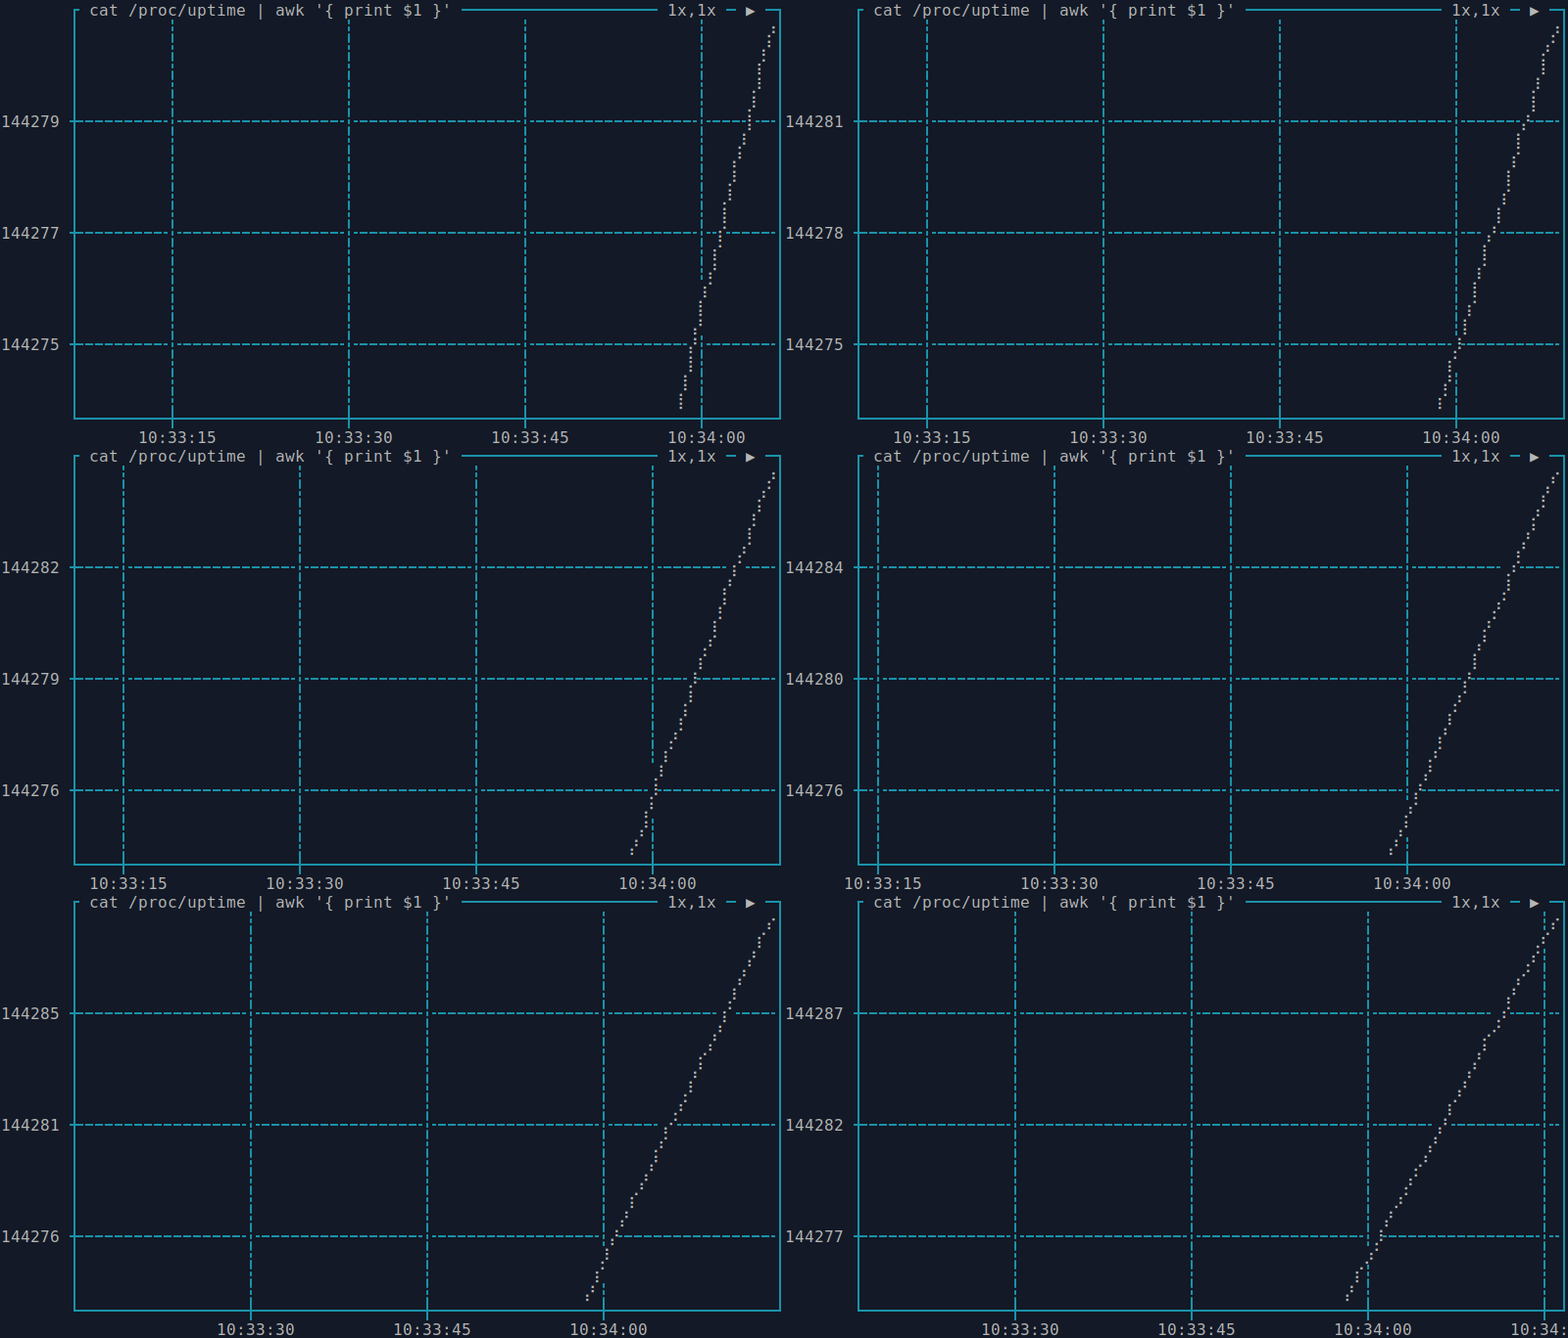
This is how to plot the CPU load on a machine with 4 CPUs.
$ irwin watch -a delta -y 0 -Y 100 -s -0.25 -o 100 \
      "head -1 /proc/stat | awk '{ print \$5 }'"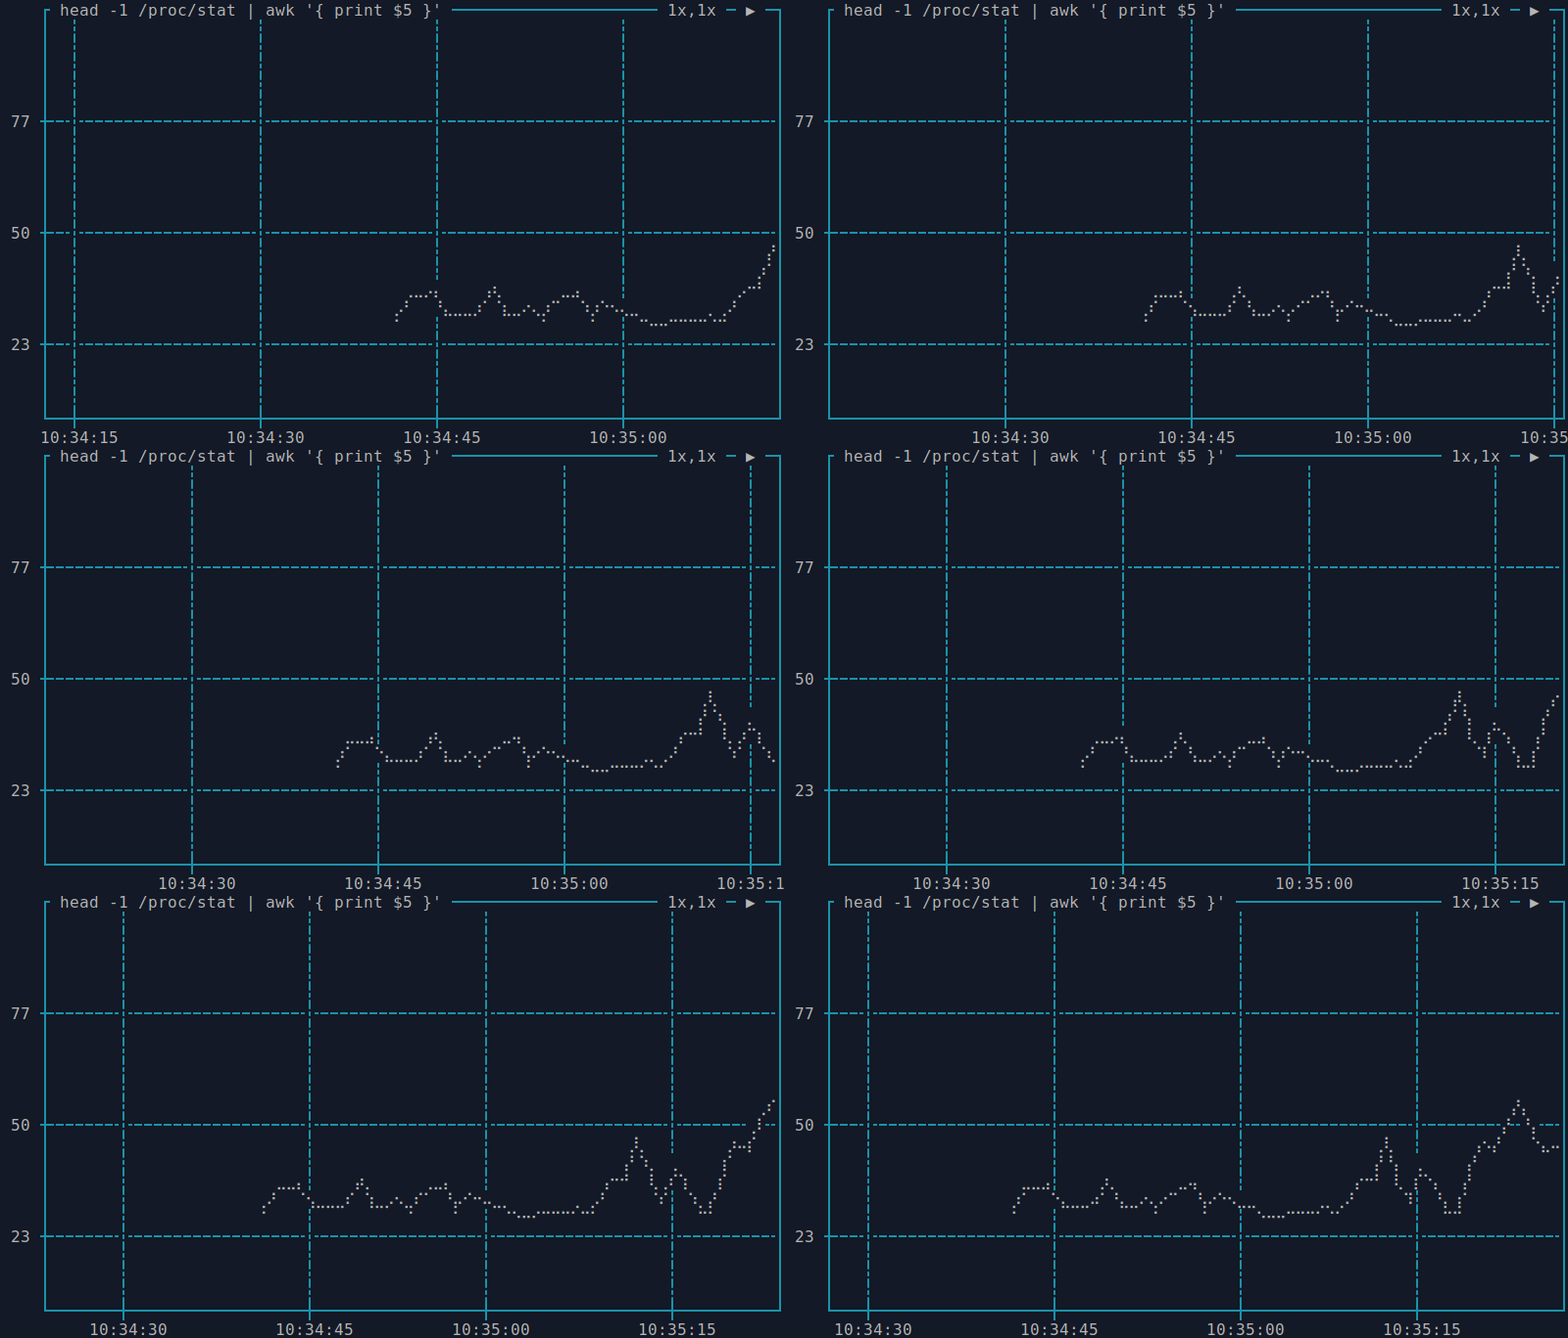
Scripting
Using a canvas
Draw on the canvas and render it. Print the rendered canvas.
import irwin

canvas = irwin.Canvas(width=40,
                      height=20,
                      x_min=0,
                      x_max=10,
                      y_min=0,
                      y_max=10)

# Draw the canvas edges.
canvas.draw_line(0, 0, 0, 10)
canvas.draw_line(0, 10, 10, 10)
canvas.draw_line(10, 10, 10, 0)
canvas.draw_line(10, 0, 0, 0)

# Draw a cross.
canvas.draw_line(0, 0, 10, 10)
canvas.draw_line(0, 10, 10, 0)

# Draw four points.
canvas.draw_point(5, 2.5)
canvas.draw_point(5, 7.5)
canvas.draw_point(2.5, 5)
canvas.draw_point(7.5, 5)

print(canvas.render())
The output:
⡟⢍⠉⠉⠉⠉⠉⠉⠉⠉⠉⠉⠉⠉⠉⠉⠉⠉⠉⠉⠉⠉⠉⠉⠉⠉⠉⠉⠉⠉⠉⠉⠉⠉⠉⠉⠉⠉⡩⢻
⡇⠀⠑⢄⠀⠀⠀⠀⠀⠀⠀⠀⠀⠀⠀⠀⠀⠀⠀⠀⠀⠀⠀⠀⠀⠀⠀⠀⠀⠀⠀⠀⠀⠀⠀⠀⡠⠊⠀⢸
⡇⠀⠀⠀⠑⢄⠀⠀⠀⠀⠀⠀⠀⠀⠀⠀⠀⠀⠀⠀⠀⠀⠀⠀⠀⠀⠀⠀⠀⠀⠀⠀⠀⠀⡠⠊⠀⠀⠀⢸
⡇⠀⠀⠀⠀⠀⠑⢄⠀⠀⠀⠀⠀⠀⠀⠀⠀⠀⠀⠀⠀⠀⠀⠀⠀⠀⠀⠀⠀⠀⠀⠀⡠⠊⠀⠀⠀⠀⠀⢸
⡇⠀⠀⠀⠀⠀⠀⠀⠑⢄⠀⠀⠀⠀⠀⠀⠀⠀⠀⠀⠀⠀⠀⠀⠀⠀⠀⠀⠀⠀⡠⠊⠀⠀⠀⠀⠀⠀⠀⢸
⡇⠀⠀⠀⠀⠀⠀⠀⠀⠀⠑⢄⠀⠀⠀⠀⠀⠀⠀⠈⠀⠀⠀⠀⠀⠀⠀⠀⡠⠊⠀⠀⠀⠀⠀⠀⠀⠀⠀⢸
⡇⠀⠀⠀⠀⠀⠀⠀⠀⠀⠀⠀⠑⢄⠀⠀⠀⠀⠀⠀⠀⠀⠀⠀⠀⠀⡠⠊⠀⠀⠀⠀⠀⠀⠀⠀⠀⠀⠀⢸
⡇⠀⠀⠀⠀⠀⠀⠀⠀⠀⠀⠀⠀⠀⠑⢄⠀⠀⠀⠀⠀⠀⠀⠀⡠⠊⠀⠀⠀⠀⠀⠀⠀⠀⠀⠀⠀⠀⠀⢸
⡇⠀⠀⠀⠀⠀⠀⠀⠀⠀⠀⠀⠀⠀⠀⠀⠑⢄⠀⠀⠀⠀⡠⠊⠀⠀⠀⠀⠀⠀⠀⠀⠀⠀⠀⠀⠀⠀⠀⢸
⡇⠀⠀⠀⠀⠀⠀⠀⠀⠀⠀⠀⠀⠀⠀⠀⠀⠀⠑⢄⡠⠊⠀⠀⠀⠀⠀⠀⠀⠀⠀⠀⠀⠀⠀⠀⠀⠀⠀⢸
⡇⠀⠀⠀⠀⠀⠀⠀⠀⠈⠀⠀⠀⠀⠀⠀⠀⠀⡠⠊⠑⢄⠀⠀⠀⠀⠀⠀⠀⠈⠀⠀⠀⠀⠀⠀⠀⠀⠀⢸
⡇⠀⠀⠀⠀⠀⠀⠀⠀⠀⠀⠀⠀⠀⠀⠀⡠⠊⠀⠀⠀⠀⠑⢄⠀⠀⠀⠀⠀⠀⠀⠀⠀⠀⠀⠀⠀⠀⠀⢸
⡇⠀⠀⠀⠀⠀⠀⠀⠀⠀⠀⠀⠀⠀⡠⠊⠀⠀⠀⠀⠀⠀⠀⠀⠑⢄⠀⠀⠀⠀⠀⠀⠀⠀⠀⠀⠀⠀⠀⢸
⡇⠀⠀⠀⠀⠀⠀⠀⠀⠀⠀⠀⡠⠊⠀⠀⠀⠀⠀⠀⠀⠀⠀⠀⠀⠀⠑⢄⠀⠀⠀⠀⠀⠀⠀⠀⠀⠀⠀⢸
⡇⠀⠀⠀⠀⠀⠀⠀⠀⠀⡠⠊⠀⠀⠀⠀⠀⠀⠀⠀⠀⠀⠀⠀⠀⠀⠀⠀⠑⢄⠀⠀⠀⠀⠀⠀⠀⠀⠀⢸
⡇⠀⠀⠀⠀⠀⠀⠀⡠⠊⠀⠀⠀⠀⠀⠀⠀⠀⠀⠈⠀⠀⠀⠀⠀⠀⠀⠀⠀⠀⠑⢄⠀⠀⠀⠀⠀⠀⠀⢸
⡇⠀⠀⠀⠀⠀⡠⠊⠀⠀⠀⠀⠀⠀⠀⠀⠀⠀⠀⠀⠀⠀⠀⠀⠀⠀⠀⠀⠀⠀⠀⠀⠑⢄⠀⠀⠀⠀⠀⢸
⡇⠀⠀⠀⡠⠊⠀⠀⠀⠀⠀⠀⠀⠀⠀⠀⠀⠀⠀⠀⠀⠀⠀⠀⠀⠀⠀⠀⠀⠀⠀⠀⠀⠀⠑⢄⠀⠀⠀⢸
⡇⠀⡠⠊⠀⠀⠀⠀⠀⠀⠀⠀⠀⠀⠀⠀⠀⠀⠀⠀⠀⠀⠀⠀⠀⠀⠀⠀⠀⠀⠀⠀⠀⠀⠀⠀⠑⢄⠀⢸
⣧⣊⣀⣀⣀⣀⣀⣀⣀⣀⣀⣀⣀⣀⣀⣀⣀⣀⣀⣀⣀⣀⣀⣀⣀⣀⣀⣀⣀⣀⣀⣀⣀⣀⣀⣀⣀⣀⣑⣼
Line plot
Not yet implemented.
import math
import numpy
import irwin

x = numpy.linspace(0, 2 * math.pi)
y = numpy.sin(x)

print(irwin.plot(x, y))
Scatter plot
Not yet implemented.
import math
import random
import numpy
import irwin

x = numpy.linspace(0, 2 * math.pi)
y = [v + random.random() / 4 for v in numpy.cos(x)]

print(irwin.scatter(x, y))1 maintainer

Download files
Download the file for your platform. If you're not sure which to choose, learn more about installing packages.
Source Distribution
irwin-0.16.0.tar.gz
(13.7 kB
view details)
File details
Details for the file irwin-0.16.0.tar.gz.
File metadata
- Download URL: irwin-0.16.0.tar.gz
- Upload date:
- Size: 13.7 kB
- Tags: Source
- Uploaded using Trusted Publishing? No
- Uploaded via:
twine/7.0.0 CPython/3.13.14
File hashes
| Algorithm | Hash digest | |
|---|---|---|
| SHA256 |
5071e5e0a5310139f0015f2f4a453d1e8f6ce2437ff64f8f033fcd2f1106191b
|
|
| MD5 |
e17baecc0c96879262323bf6294036ce
|
|
| BLAKE2b-256 |
93d4629dbdc8173fbc292ac05165a0db88f8b39c2bb43a56239d0111aa93d73f
|







