Tools for processing and analyzing neurophysiological signals recorded in-vivo.

Project description
ivneuro
Tools for processing and analyzing neurophysiological signals recorded in-vivo.
ivneuro provides tools for analyzing neural signals recorded in-vivo during behavior. It focus on time series analyses of continuous variables such as Local Field Potentials and is optimized to process either single signals in a single condition as well as multiple signals in multiple conditions simultaneously. It also provides a subpackage for extracting data from Nex files.
Installation
To install use:
pip install ivneuro
Documentation
Documentation can be found here.
Contributing
All contributions, bug reports, bug fixes, documentation improvements, enhancements, and ideas are strongly appreciated. To contribute, please review the guidelines at the CONTRIBUTING section.
Quick examples
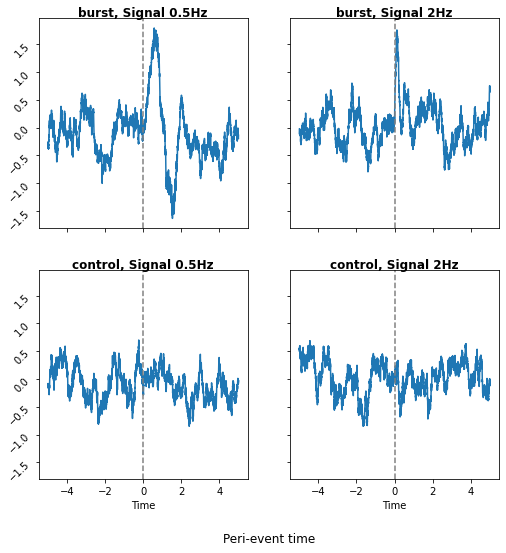
Peri-event histograms
>>> import ivneuro as ivn
>>> import pandas as pd

>>> # Create events
>>> burst = [*range(30,300, 30)]
>>> control = [*range(45,300, 30)]
>>> events={'burst':burst,'control':control}

>>> # Generate signals
>>> signal1 = ivn.generate_signal(300, burst, 2, burst_duration = 0.5, burst_amplitude=1)
>>> signal2 = ivn.generate_signal(300, burst, 0.5, burst_duration = 2, burst_amplitude=1.5, seed = 21)
>>> signal = pd.concat([signal1, signal2], axis = 1)


>>> # Make peri-event histogram
>>> hist=ivn.peh(signal, events, lower_lim = -5, higher_lim = 5)

>>> hist.plot()
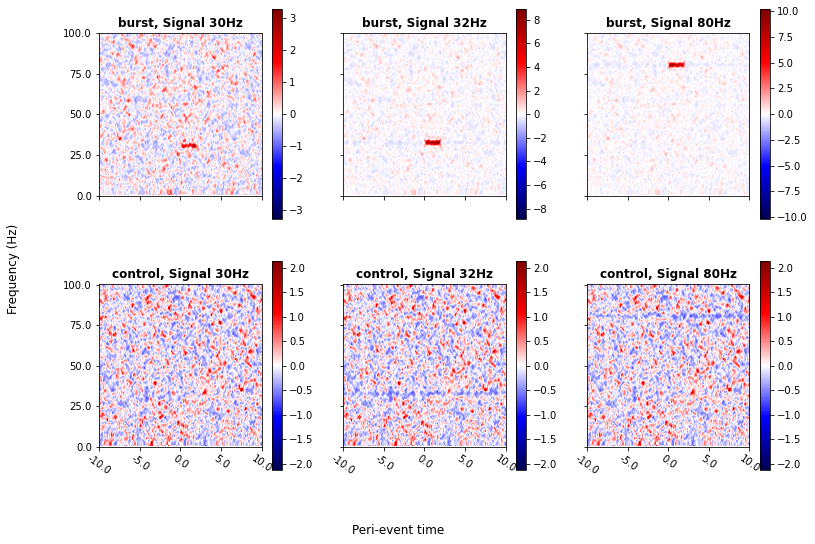
Peri-event spectograms
>>> import ivneuro as ivn
>>> import pandas as pd

>>> # Create events
>>> burst = [*range(30,300, 30)]
>>> control = [*range(45,300, 30)]
>>> events={'burst':burst,'control':control}

>>> # Generate signals
>>> signal1 = ivn.generate_signal(300, burst, 30, burst_amplitude=0.06)
>>> signal2 = ivn.generate_signal(300, burst, 32, burst_amplitude=0.13)
>>> signal3 = ivn.generate_signal(300, burst, 80, burst_amplitude=0.05)
>>> signals = pd.concat([signal1, signal2, signal3], axis = 1)

>>> # Calculate peri-event spectogram
>>> pes = ivn.peri_event_spectogram(signals, events, -10, 10, higher_freq=100)
>>> pes.normalize().plot()
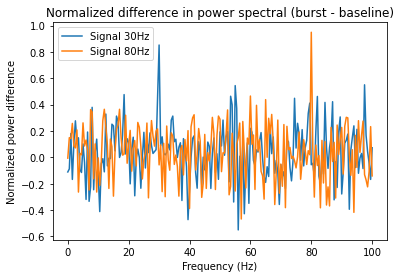
Difference in power spectral between an experimental condition and its baseline, for 2 signals
>>> import ivneuro as ivn
>>> import pandas as pd

>>> # Create event
>>> burst = [*range(30,300, 30)]

>>> # Make intervals
>>> burst_intervals = ivn.make_intervals(burst, 0, 2)
>>> baseline_intervals = ivn.make_intervals(burst, -6, -4)

>>> # Generate signals
>>> signal1 = ivn.generate_signal(300, burst, 30, burst_amplitude=0.06, seed=15)
>>> signal2 = ivn.generate_signal(300, burst, 80, burst_amplitude=0.05, seed = 50)
>>> signals = pd.concat([signal1, signal2], axis = 1)


>>> # Calculate change in power spectral
>>> power_burst, power_baseline, delta_power = ivn.delta_power_spectral(signals, burst_intervals, baseline_intervals, lowest_freq = 0, highest_freq = 100)
>>> delta_power.plot(xlabel = 'Frequency (Hz)', ylabel = 'Normalized power difference', title = 'Normalized difference in power spectral (burst - baseline)')
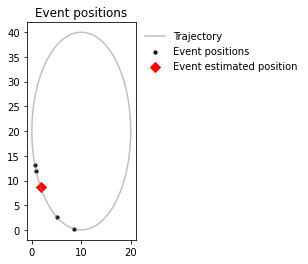
Positions in which an event occurs
>>> import numpy as np
>>> import ivneuro as ivn

>>> # Create coordinates and timestamps for an oval trajectory
>>> x = 10 * np.cos(np.linspace(0, 2*np.pi, 100)) + 10
>>> y = 20 * np.sin(np.linspace(0, 2*np.pi, 100)) + 20
>>> timestamps = np.linspace(0,20,100).round(1)

>>> # Create event
>>> np.random.seed(24)
>>> event = np.random.choice(timestamps[(timestamps>10) & (timestamps<15)], size=5, replace = False)

>>> # Make EventPosition object and plot
>>> pos = ivn.EventPosition(x, y, timestamps, event)
>>> pos.plot()
License
The codes are released under MIT License


Download files
Download the file for your platform. If you're not sure which to choose, learn more about installing packages.
Source Distribution
Built Distribution
Filter files by name, interpreter, ABI, and platform.
If you're not sure about the file name format, learn more about wheel file names.
Copy a direct link to the current filters
File details
Details for the file ivneuro-0.1.3.tar.gz.
File metadata
- Download URL: ivneuro-0.1.3.tar.gz
- Upload date:
- Size: 42.0 kB
- Tags: Source
- Uploaded using Trusted Publishing? No
- Uploaded via: twine/4.0.2 CPython/3.11.3
File hashes
| Algorithm | Hash digest | |
|---|---|---|
| SHA256 |
f1e67c66c2e2f2061dae46f9ca705fcf89a6207cd11857a23af3d8fd2059ba2d
|
|
| MD5 |
edd09b29b6734e83c28f2893996faaa2
|
|
| BLAKE2b-256 |
f8cf1d6ae13090514efb0cdad34df0c879b390dc9da960753853927ca1865512
|
File details
Details for the file ivneuro-0.1.3-py3-none-any.whl.
File metadata
- Download URL: ivneuro-0.1.3-py3-none-any.whl
- Upload date:
- Size: 46.3 kB
- Tags: Python 3
- Uploaded using Trusted Publishing? No
- Uploaded via: twine/4.0.2 CPython/3.11.3
File hashes
| Algorithm | Hash digest | |
|---|---|---|
| SHA256 |
437fa90d185ee8232b950aa94d29534770849a4295307a0a2d89c969b444796b
|
|
| MD5 |
f0888a368bd8ccae0bf476fa8e6adfe2
|
|
| BLAKE2b-256 |
bdc5f4f1a9e71596a1e80f43a98e166809bc7d16055175eb378cd395d4a6ce5e
|


