
IXPLORE
Bounded Ideal Point Estimation with Grid-Based Uncertainty Quantification: A Python package for embedding users and questionnaire items in a shared 2D latent space.
Overview
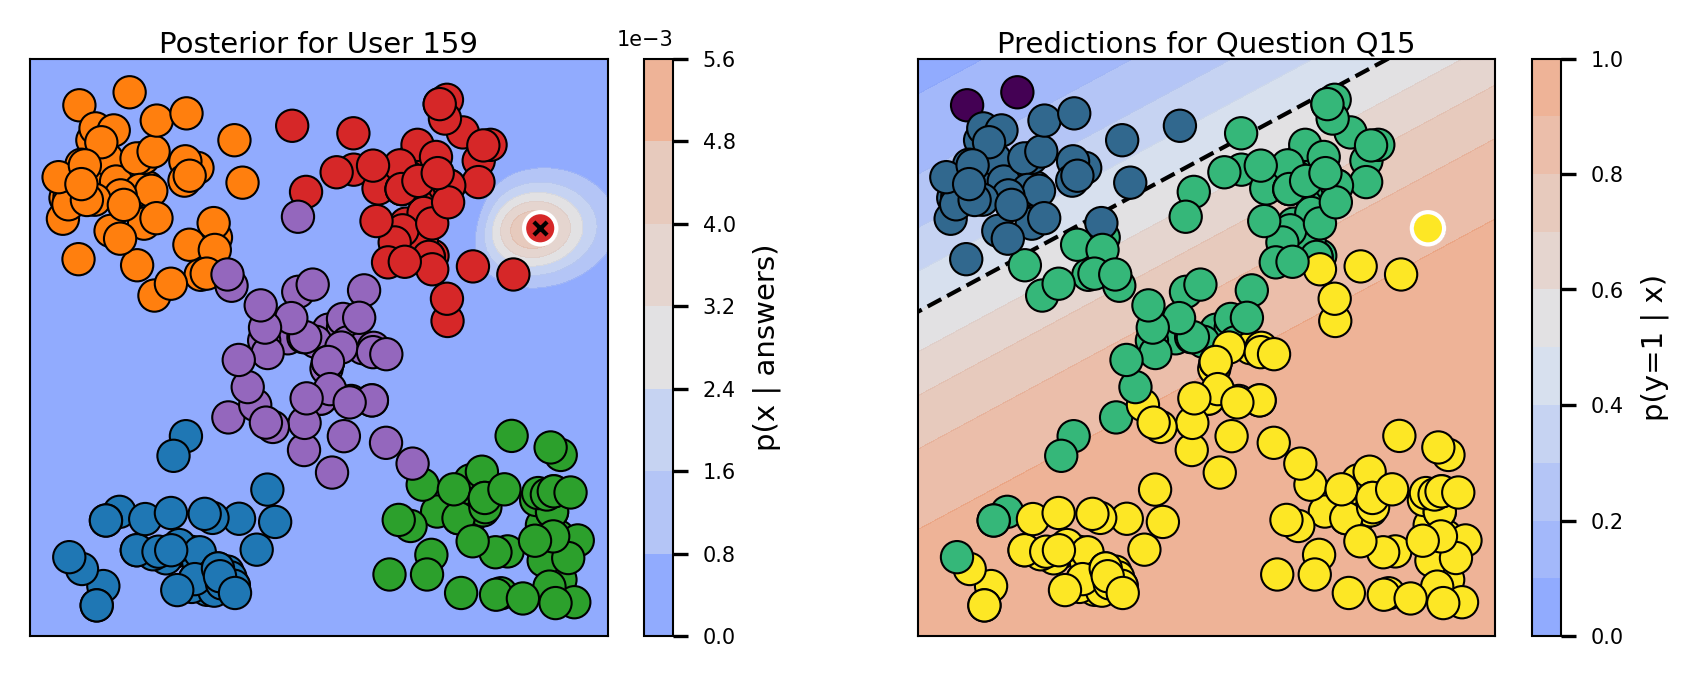
IXPLORE is a Python package that jointly embeds users and questionnaire items in a shared 2D latent space. It is designed for user-item reaction matrices commonly found in political questionnaires, where each row represents a user and each column represents an item (question). Responses can be binary (agree/disagree) or Likert-scale values, which are automatically normalized to the [0, 1] range.
The core idea is simple: a user's position in 2D space should predict their responses to all items. Each item defines a logistic regression decision boundary in this space, separating regions of agreement from disagreement. The model iteratively refines both the user positions and the item boundaries until they are mutually consistent.
IXPLORE produces:
- User embeddings (N x 2): a 2D coordinate for each user representing their latent preferences
- Item parameters (K x 3): logistic regression coefficients (beta1, beta2, intercept) defining each item's decision boundary
- Posterior distributions: full probability distributions over the 2D space quantifying uncertainty about each user's position
This enables interpretable visualization of preference landscapes, principled uncertainty quantification, and missing value imputation grounded in the learned geometry.
For the design rationale behind these choices, see docs/motivation.md. For a feature-by-feature walkthrough and the full API reference, see docs/documentation.md. For the full paper, see the technical report on ArXiv.
Features
- User Embedding: Compute posterior distributions for users based on their reactions
- Item Models: Define decision boundaries for each question with logistic regression models
- Iterative Refinement: Jointly optimize user embeddings and item models through iterative updates
- Flexible Initialization: Initialize embeddings via PCA, random values, or load pretrained embeddings
- Missing Data Handling: Robust to missing values in the user-item reaction matrix
- Answer Imputation: Predict answers based on positions in latent space
- New User Embedding: Embed new users in the latent space with uncertainty quantification
- Visualization Tools: Built-in plotting functions for embeddings, posteriors, and item decision boundaries
Installation
pip install ixplore
Or install from source:
git clone https://github.com/fsvbach/ixplore.git
cd ixplore
pip install -e .
Quick Start
import pandas as pd
from ixplore import IXPLORE

# Load reaction data (users × items matrix, values in {0, 1} or Likert-scale)
reactions = pd.read_csv('../data/likert_reactions.csv', index_col=0)

# Initialize and fit the model
model = IXPLORE(reactions, pca_initialization=True)

# Refine with a few iterations of joint optimization
model.iterate(n_iterations=1)

# Get user embeddings and item parameters
embedding  = model.get_embedding()    # User positions (N × 2) with columns ['x', 'y']
parameters = model.get_parameters()   # Item parameters (K × 3): ['beta1', 'beta2', 'alpha']

# Embed a new user based on their answers
new_user_answers = pd.Series({'Q1': 0.8, 'Q2': 0.2, 'Q3': 0.6}, name='new_user')
position = model.embed(new_user_answers)

# Impute all answers for a user
predicted = model.impute_answers(new_user_answers)
Custom Configuration
import numpy as np

model = IXPLORE(
    reactions,
    prior_variance=1.0,                         # Prior regularization
    sampling_resolution=200,                    # Grid resolution for posteriors
    limits=(-1, 1),                             # Bounds for both axes (square space)
    pca_initialization=True,                    # Initialize with PCA
    random_state=17                             # For reproducibility
)
Loading Pretrained Models
# Load pretrained embedding and model parameters
pretrained_embedding = pd.read_csv('../data/pretrained_embedding_likert.csv', index_col=0)
pretrained_models = pd.read_csv('../data/pretrained_models_likert.csv', index_col=0)

model = IXPLORE(
    reactions,
    pretrained_embedding=pretrained_embedding,
    pretrained_models=pretrained_models
)
Visualization
from ixplore.visualization import plot_overview

# Load user metadata (e.g., colors for plotting)
users = pd.read_csv('../data/synthetic_users.csv', index_col=0)

# Plot user embeddings
_ = plot_overview(model, question='Q12', user='159', colors=users.color)
For the full constructor parameters and method reference, see docs/documentation.md.
Notebooks
Runnable examples live in notebooks/:
- demo.ipynb — end-to-end workflow: load data, fit, visualize, embed new users, impute answers.
- data.ipynb — generate the synthetic users, binary/Likert/categorical reactions used by the other notebooks.
- prior.ipynb — sweep
prior_varianceviaapply_priorand see how the prior shapes the embedding. - weights.ipynb — per-(user, item)
weightsand thescale_weightsflag for sparse responses. - features.ipynb — non-linear decision boundaries via the
kernelargument (interaction, quadratic, RFF) on categorical data. - distortion.ipynb — quantify latent-space distortion with
ixplore.metrics.compute_distortion. - timing.ipynb — runtime breakdown and scaling in
n_users,n_items, andsampling_resolution.
Dependencies
- numpy
- pandas
- scipy
- matplotlib
License
This project is licensed under the MIT License - see the LICENSE file for details.
Citation
If you use IXPLORE in your research, please cite:
@software{bachmann_ixplore_2026,
  author       = {Bachmann, Fynn},
  title        = {IXPLORE: Bounded Ideal Point Estimation with Grid-Based Uncertainty Quantification},
  year         = {2026},
  publisher    = {ArXiv Preprint},
  url          = {http://arxiv.org/abs/2609.06018}
}
Or in text format:
Bachmann, F. (2026). IXPLORE: Bounded Ideal Point Estimation with Grid-Based Uncertainty Quantification. ArXiv Preprint. http://arxiv.org/abs/2609.06018
1 maintainer

Metadata
1 maintainer
Release files for ixplore 1.2.1
For a detailed explanation of source distributions (sdists) and built distributions (wheels), please see the package formats documentation.
Source distribution (sdist)
| File | Size | Uploaded | Provenance | Actions |
|---|---|---|---|---|
| ixplore-1.2.1.tar.gz | 23.0 kB | Without provenance | Details for ixplore-1.2.1.tar.gz |
Built distribution (wheel)
| File | Interpreter | ABI | Platform | Actions Reset |
|---|---|---|---|---|
| ixplore-1.2.1-py3-none-any.whl | Python 3 | none | any | Details for ixplore-1.2.1-py3-none-any.whl |
Total release size: 44.2 kB
Release files / ixplore-1.2.1.tar.gz
| Download URL | ixplore-1.2.1.tar.gz |
|---|---|
| Size | 23.0 kB |
| Tags | Source |
|
SHA-256 checksum How to use checksums |
c3b6f64734daa3e5fe710f9984e4753bb32eedc4ff62fd4c14586d11e2e6f44b
|
|
BLAKE2b-256 checksum How to use checksums |
ddc259569a9405004158a8c0d6b12a6dfba74d66f64fd6760249c816bf6a6f4f
|
| Upload date | |
|
Uploaded using Trusted Publishing? What is trusted publishing? |
No |
| Uploaded via |
twine/6.2.0 CPython/3.14.0
|
Release files / ixplore-1.2.1-py3-none-any.whl
| Download URL | ixplore-1.2.1-py3-none-any.whl |
|---|---|
| Size | 21.1 kB |
| Tags | Python 3 |
|
SHA-256 checksum How to use checksums |
151de9bad9c744ff5687395ab6781bc322420f68464de6d66e2d305e6eecc249
|
|
BLAKE2b-256 checksum How to use checksums |
92b8ed2543c81f14dd75ac5b7ceaf7a64ff0ede11c7347f600bf317d0dff5069
|
| Upload date | |
|
Uploaded using Trusted Publishing? What is trusted publishing? |
No |
| Uploaded via |
twine/6.2.0 CPython/3.14.0
|
Security for ixplore 1.2.1
Provenance
Provenance describes where a file came from. On PyPI, provenance is shared via attestations, which provide a verifiable record of the build or publishing details. View details, limitations and caveats.
No provenance found
None of the files in this release were uploaded with provenance metadata.
A note on package security
PyPI is a repository for distributing packages, not a service for auditing them. While third-party security researchers and our staff do their best to detect and remove malicious packages, PyPI cannot guarantee the quality, security or suitability of any given package.
To learn more about protecting yourself from malicious actors, visit our package security documentation.














